Original Link: https://www.anandtech.com/show/10303/choosing-the-right-ssd-for-a-skylakeu-system
Choosing the Right SSD for a Skylake-U System
by Ganesh T S on May 9, 2016 8:00 AM EST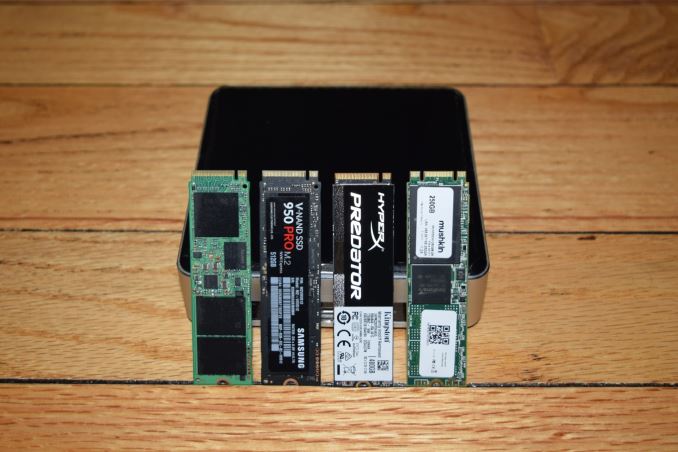
Our Skylake NUC review had a brief section on the performance of the storage subsystem. The comments section raised a few questions about the inability of SSDs such as the Samsung SSD 950 PRO to achieve maximum performance in the NUC. After some discussion with Intel, we discovered some interesting aspects in the design of Skylake-U systems that have a bearing on the performance of some M.2 PCIe SSDs. These can affect the consumer's choice of SSDs for a Skylake-U system - be it a NUC or an user-upgradeable notebook.
Background
Intel has a wide range of CPUs based on the Skylake microarchitecture. These target a variety of markets ranging from tablets / 2-in-1s and Compute Sticks to the traditional tower desktops. The same microarchitecture is able to serve different markets because of the scalable nature of the TDP / power envelop (from 4.5W to 91W).
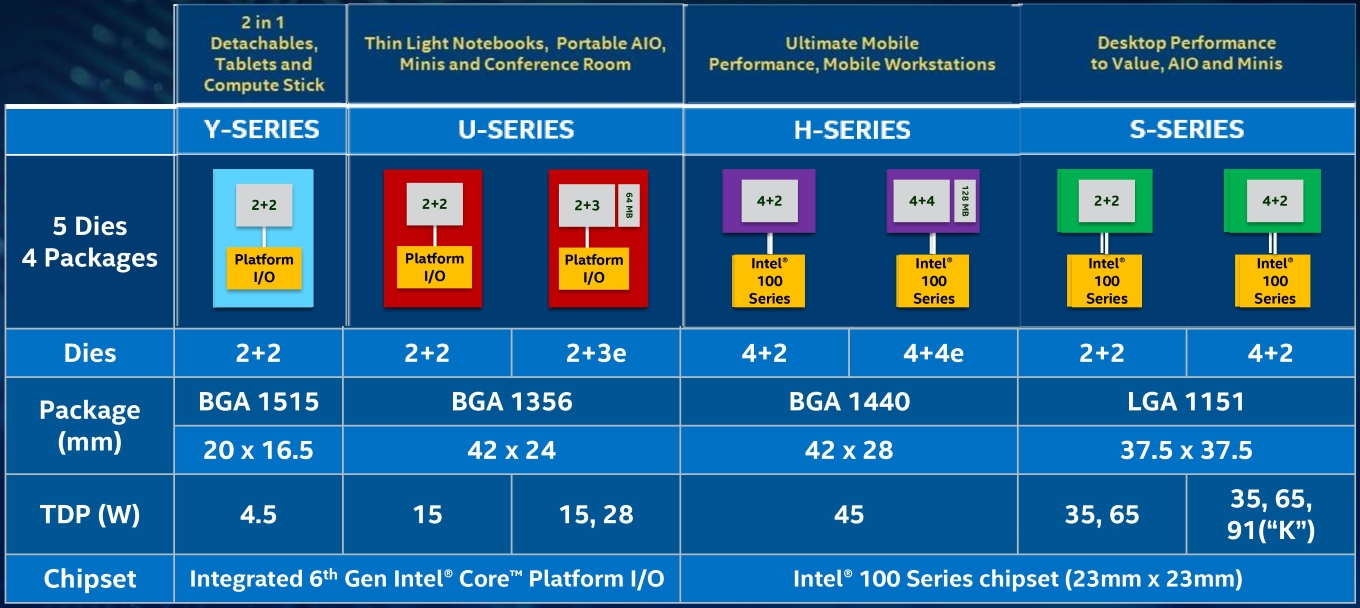
While the high-performance H-, S- and K- CPUs need a separate Intel 100 Series platform controller hub (Sunrise Point PCH), the Skylake-U and Skylake-Y are Multi-Chip Packages (MCP) that have the Sunrise Point-LP PCH die integrated with the CPU in a single package.
The communication between the CPU and the PCH in the H-,S- and K- systems is via the Direct Media Interface (DMI 3.0),a proprietary link protocol developed by Intel. Skylake-U/-Y series processors, on the other hand, have an On Package DMI interconnect interface termed as OPI. Unlike DMI 3.0, the OPI in Skylake-U/-Y can be configured to meet the desired power or performance needs of a mobile system design. The following table summarizes the differences between DMI and the two configurable OPI options in Skylake systems.
| Skylake CPU - PCH(-LP) Communication Link Characteristics | |||
| Aspect | DMI 3.0 | OPI GT2 | OPI GT4 |
| Applicable Systems | Skylake-H/-S/-K | Skylake-U/-Y | |
| Link Width | x4 | x8 | |
| Transfer Rate per Lane | 8 GT/s | 2 GT/s | 4 GT/s |
| Max. Theoretical Bandwidth | 3.94 GBps | 2 GBps | 4 GBps |
For all practical purposes, DMI 3.0 and PCIe 3.0 are equivalent, and this is important when a PCIe 3.0 x4 SSD is connected to the a Skylake-H/-S/-K system using PCIe lanes from the PCH. Any other peripheral communicating with the CPU at the same time as the PCIe SSD would end up creating a bottleneck at the CPU-PCH link. On the other hand, Skylake-U/-Y systems that have a PCIe 3.0 x4 SSD connected to the Sunrise Point-LP PCIe lanes will be directly impacted by the configuration of the OPI. The GT4 configuration should have enough bandwidth to get full performance from a PCIe 3.0 x4 SSD, but a GT2 configuration could end up throttling such a device.
Analyzing the Skylake NUC6i5SYK Storage Subsystem
In order to determine whether the Sylake NUC6i5SYK is affected by the OPI capabilities, it is essential to understand the board design and the way each of the peripheral ports connect to the CPU.
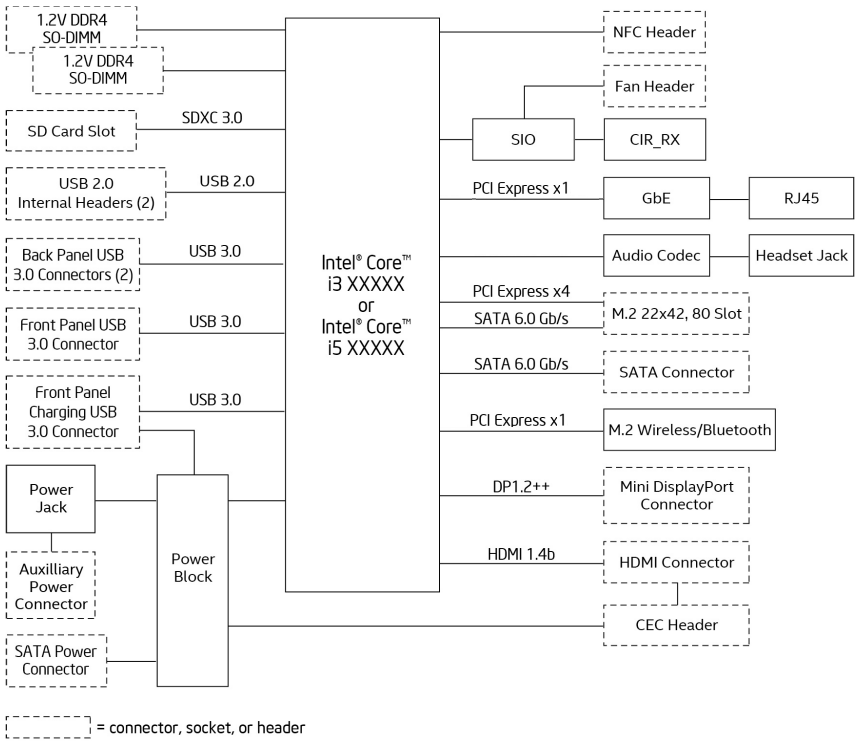
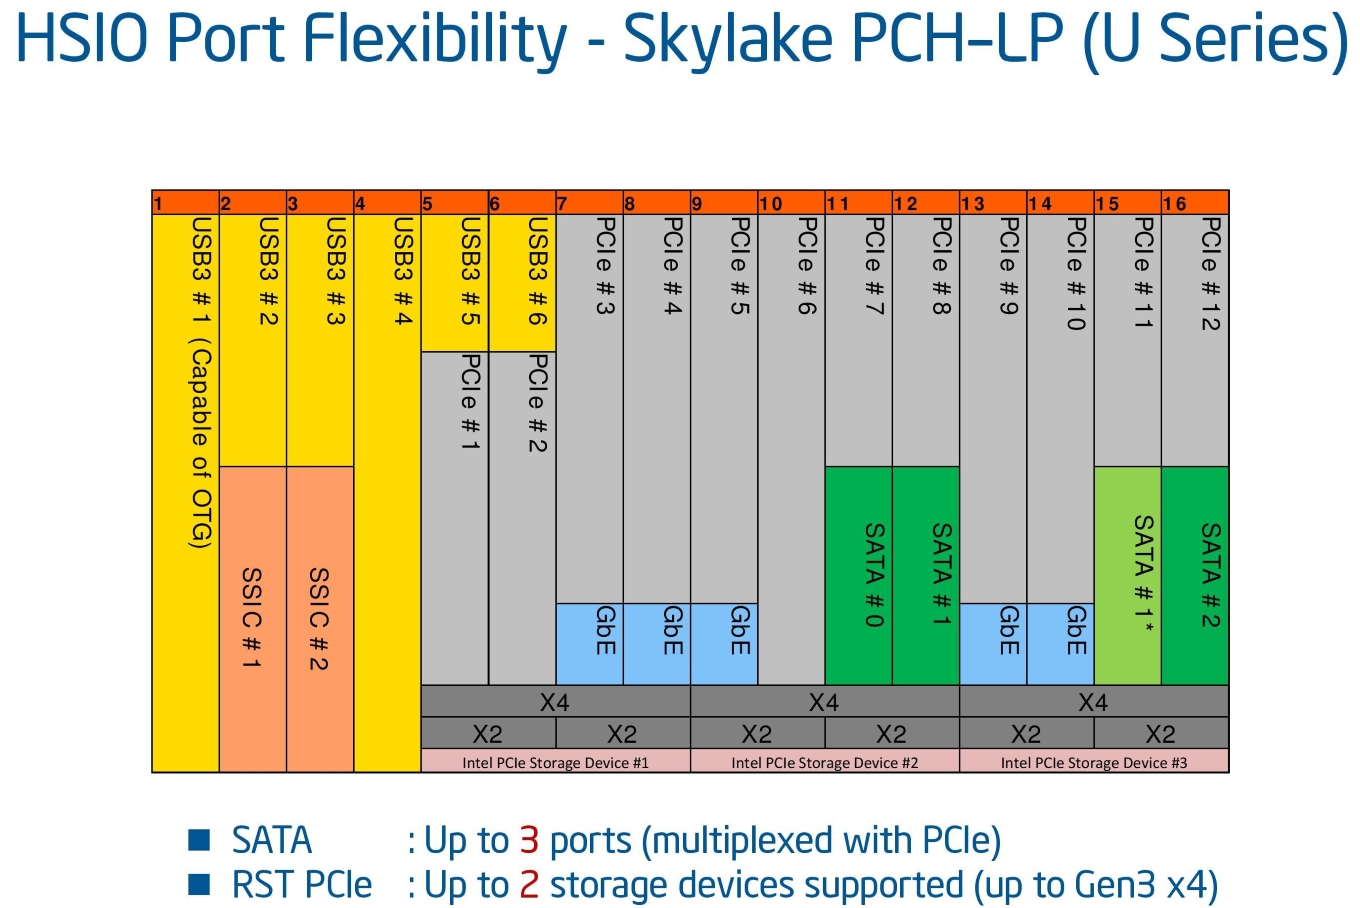
The above block diagram should be considered in conjunction with the Skylake PCH-LP high-speed I/O (HSIO) configuration options depicted below. One of the x4 links multiplexed with a SATA lane is used for the M.2 22x42,80 SSD slot. One of the PCIe lanes that gets multiplexed with GbE is connected to the Intel I-219V Ethernet Adapter., and yet another PCIe lane is used for the WLAN adapter. The important aspect to note here is that any M.2 SSD can have full PCIe 3.0 x4 connectivity to the Sunrise Point-LP PCH.
Intel's current technical documentation (PDF) for the Skylake NUC board mentions that the maximum possible performance for any M.2 SSD is around 1600 MBps. The Samsung SSD 950 PRO and SM951 PCIe 3.0 x4 NVMe SSDs claim performance numbers in excess of 2000 MBps. This obviously means that there is a bottleneck between the Skylake CPU and the Sunrise Point-LP.
Intel's Skylake-U/-Y reference designs are optimized for lower power and default the OPI to GT2 rates. In the development of the NUC6i5SY product family, the Intel team utilized the reference designs and default settings for the OPI and GT2 rates. Therefore, PCIe 3.0 x4 SSDs connected to the M.2 port of the NUC6i5SYK (BIOS v0042) are effectively limited to PCIe 2.0 x4 rates. This throttling makes sense for battery-operated devices like 2-in-1s, but, not so much for UCFF desktops like the NUCs.
After we brought this to Intel's attention, the development team decided to complete the necessary changes and validation to support the maximum PCIe 3.0 performance. Intel sent over a development BIOS (v1142) that turned on the higher performance OPI GT4 rate. This BIOS is scheduled to be made public before the end of May 2016 (after completion of internal validation).
Evaluating the NUC6i5SYK Storage Subsystem
The rest of this review deals with two major aspects - a quantitative measurement of the effectiveness of different types of SSDs in the Skylake NUC, and an evaluation of the improvements resulting from ramping up the OPI to GT4 rates (i.e, a comparison of the performance using BIOS v0042 and BIOS v1142). In order to do this, we processed various benchmarks while keeping everything other than the M.2 SSD and the BIOS version constant.
| Intel NUC6i5SYK Benchmarked Configuration | |
| Processor | Intel Core i5-6260U Skylake, 2C/4T, 1.8 GHz (Turbo to 2.9 GHz), 14nm, 4MB L2, 15W TDP |
| Memory | Corsair CMSX16GX4M2A2400C16 DDR4 15-15-15-35 @ 2133 MHz 2x8 GB |
| Graphics | Intel Iris Graphics 540 (Skylake-U GT3e) |
| Disk Drive(s) | Various M.2 SSDs |
| Operating System | Windows 10 Pro x64 |
| Full Specifications | Intel NUC6i5SYK Specifications |
The various benchmarks presented in the next few sections were all processed with the M.2 SSD as the primary drive. The drive was initialized with two partitions. The primary OS partition was set to be 120GB in size, while the remaining space was allocated to the secondary partition. Both of the partitions were formatted in NTFS with default settings.
In the next section, we will first take a look at the specifications of the four M.2 SSDs that were evaluated in the NUC6i5SYK, along with CrystalDiskMark scores for each in both the BIOS versions. Following this, we move on to real-world benchmarks - SYSmark 2014, PCMark 8 Storage Bench and a slightly tweaked AnandTech DAS Suite. Prior to our concluding remarks, we take a look at a few miscellaneous aspects - power consumption, thermal characteristics and pricing.
M.2 SSD Options for the Skylake NUC
The M.2 2280 slot in the NUC6i5SYK supports both PCIe and SATA SSDs. The PCIe SSDs (up to Gen3 x4) can be either NVMe or AHCI. A detailed comparison of Non-Volatile Memory Express (NVMe) and the Advanced Host Controller Interface (AHCI) is beyond the scope of this review, but one of our previous articles provides further information. For the purpose of this piece, it is sufficient to know that NVMe SSDs have advantages in performance over AHCI SSDs. SATA SSDs, as seen from the block diagram in the previous section, are connected to the chipset via a SATA III 6Gbps link.
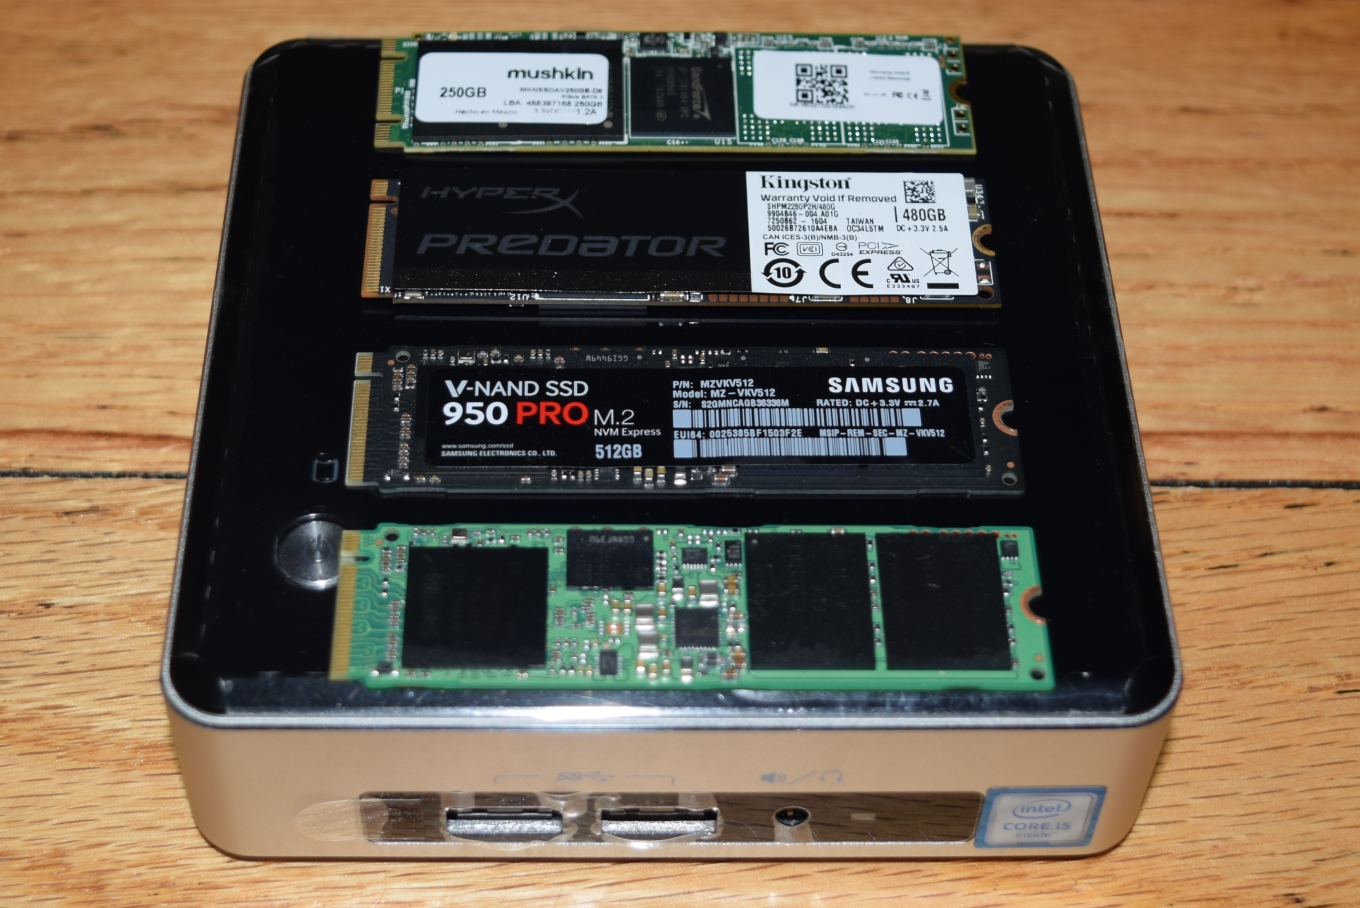
There are plenty of SSDs compatible with the Intel NUC6i5SYK, but, what does one choose for the best experience? There are decisions to make - PCIe 3.0 vs. PCIe 2.0, NVMe vs. AHCI, PCIe vs. SATA and so on. Obviously, a PCIe 3.0 x4 NVMe SSD is the best in terms of performance, but, it might not be great on the wallet, or even for power consumption. In this review, we are going to look at four M.2 SSD options:
- Samsung SM951 256GB PCIe 3.0 x4 NVMe
- Samsung 950 PRO 512GB PCIe 3.0 x4 NVMe
- Kingston HyperX Predator 240GB PCIe 2.0 x4 AHCI
- Mushkin Atlas Vital 250GB SATA 6Gbps
The table below smmarizes the specifications (claimed by the manufacturers) for the various evaluated SSDs. The entries in bold indicate the features corresponding to the tested sample.
| Evaluated M.2 2280 SSDs - Specifications | ||||
| Drive | Samsung SM951 | Samsung SSD 950 PRO | Kingston HyperX Predator | Mushkin Atlas Vital |
| Available Capacities | 128GB, 256GB, 512GB | 256GB, 512GB | 240GB, 480GB | 120GB, 240GB, 250GB, 480GB, 500GB |
| Interface | PCIe 3.0 x4 | PCIe 3.0 x4 | PCIe 2.0 x4 | SATA III |
| Supported Protocols | NVMe, AHCI | NVMe | AHCI | AHCI |
| Evaluated Model | MZVPV256HDGL | MZVKV512 | SHPM2280P2/480G | MKNSSDAV250GB-D8 |
| Controller | Samsung UBX S4LN058A01-8030 |
Marvell Altaplus 88SS9293 |
SandForce SF-2281VB4-SPC | |
| NAND | Samsung 16nm 64Gbit MLC | Samsung V-NAND 32-layer 128Gbit MLC | Toshiba A19nm 64Gbit MLC | MLC |
| DRAM | 512MB | 1GB | - | |
| Sequential Read | 2150MB/s | 2500MB/s | 1400MB/s | 550MB/s |
| Sequential Write | 1260MB/s | 1500MB/s | 1000MB/s | 530MB/s |
| 4KB Random Read | 300K IOPS | 300K IOPS | 117K IOPS | 86K IOPS |
| 4KB Random Write | 100K IOPS | 110K IOPS | 70K IOPS | 86K IOPS |
| Endurance | 75TBW | 400TBW | 892TBW (1.7 DWPD) | N/A |
| Street Price (as on date) | $200 | $318 | $300 | $90 |
| Warranty | OEM / Unknown | Five years | Three years | |
The rest of this section will present more information about each of these SSDs as well as a quick look at their CrystalDiskMark scores, when used in the M.2 slot of the NUC6i5SYK. It must be noted that CrystalDiskMark is an artificial benchmark. Nonetheless, it is useful to determine whether the SSDs are operating as per the manufacturer's claimed specifications. It can also help in finding out whether the SSD is connected via the most optimal interface. For example, it can quickly reveal whether a PCIe x4 SSD is inadvertently being operated in the x1 mode (which is entirely possible due to BIOS settings in certain systems).
Samsung SM951 MZVPV256HDGL 256GB PCIe 3.0 x4 NVMe SSD
The SM951 is an OEM-only M.2 2280 SSD. The 256GB variant is a single-sided card with two flash packages, a single DRAM package and the controller on the top side. In the Skylake NUC, the thermal strip attached to the lid is able to make contact with all the chips on the SSD to aid in cooling down the components.
The gallery below presents some photographs of the sample used in our review.


The screenshots below show the CrystalDiskMark v5.0.2 scores of the SM951 in the Skylake NUC6i5SYK with BIOS v0042 on the left and the new development BIOS (v1142) on the right.
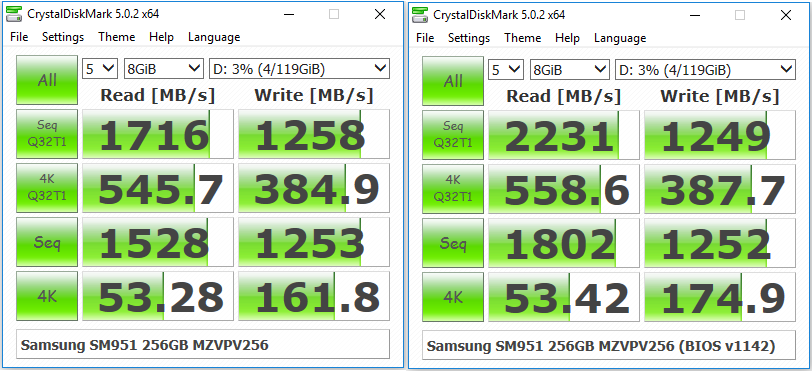
As expected, the change from OPI GT2 to OPI GT4 unlocks the full performance potential of the SM951 PCIe 3.0 x4 NVMe SSD. There is no change in the write speeds, but the maximum read rates go up from 1716 MBps to 2231 MBps.
Samsung SSD 950 PRO MZVKV512 512GB PCIe 3.0 x4 NVMe SSD
The SSD 950 PRO uses the same controller as the SM951. This product is available in the retail channel, unlike the SM951. The main selling point here is the V-NAND, which enables higher endurance ratings (up to 400TB of writes). Like the SM951, despite the higher capacity, the 950 PRO is also single-sided. A label across the top prevents the thermal pad on the NUC lid from coming in direct contact with the packages. As we shall see later, our 950 PRO test sample runs a little bit hotter for the same workload as compared to the SM951.
The gallery below presents a couple of photographs of the sample used in our review.


The screenshots below show the CrystalDiskMark v5.0.2 scores of the SSD 950 PRO in the Skylake NUC6i5SYK with BIOS v0042 on the left and the new development BIOS (v1142) on the right.

As expected, and already seen with the SM951, the change from OPI GT2 to OPI GT4 is required in order to take advantage of the full capabilities of the SSD.
Kingston HyperX Predator SHPM2280P2H/480G 480GB PCIe 2.0 x4 AHCI SSD
Kingston was one of the very few vendors to jump on to the PCIe bandwagon for consumer SSDs. The HyperX Predator PCIe 2.0 x4 SSDs adopt the traditional AHCI protocol, and not the NVMe used by the two Samsung SSDs discussed above. The main selling point of these units is the high endurance ratings compared to the Samsung SSDs. Kingston's three-year warranty period, coupled with a 1.7 drive writes per day (DWPD) rating for the 480GB version comes out to an endurance rating of more than 890TBW.
The SSDs come either in a pure M.2 version, or, bundled along with a half-height / half-length (HHHL) adapter to fit traditional desktop motherboards that don't have a M.2 slot. The HHHL adapter also includes a thermal pad on the underside to keep the components cooled. The 480GB version is populated with eight flash packages (four on either side). The pricing on the various available options (240GB and 480GB, with and without the HHHL adapter) is a bit volatile. I have often seen the HHHL bundle available at a lower price compared to the pure M.2 version.
Kingston sent us the 480GB HHHL version for consideration in this piece. Some photographs of the package and the contents are presented in the gallery below. We again have a label covering the packages and preventing the thermal pad on the NUC lid from doing an effective job of keeping the SSD cool.


The screenshots below show the CrystalDiskMark v5.0.2 scores of the Kingston HyperX Predator M.2 SSD in the Skylake NUC6i5SYK with BIOS v0042 on the left and the new development BIOS (v1142) on the right.
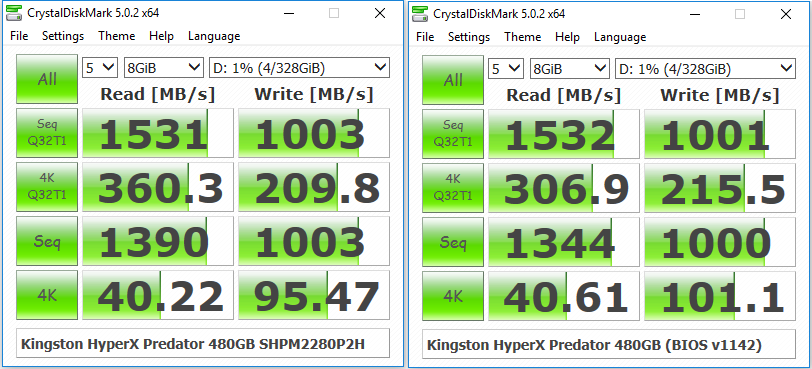
The move from OPI GT2 to OPI GT4 is not expected to make any difference to PCIe 2.0 x4 SSDs, and this is proved by our quick test above.
Mushkin Atlas Vital MKNSSDAV250GB-D8 250GB SATA M.2 SSD
Mushkin has been selling SandForce SF2200-based SSDs for a long time. The DRAM-less nature of the controller means that the the board footprint for the SandForce SSDs tends to be small. Due to this, Mushkin has been able to migrate the designs from 2.5" drives to mSATA and now, down to M.2 form factors. The Atlas Vital is the M.2 version of their SF2200-based drive.
The early review samples of the 250GB Atlas Vital that were seeded to the press used the SF2241 quad-channel controller, but our sample had the eight-channel SF2281 controller. There are only two flash packages on board (making it a single-sided design), though it can be seen that the board is designed to accommodate up to eight packages. Mushkin packages the NAND themselves, and there is no guarantee who the vendor is (except that it is MLC flash). The gallery below shows some photographs of the unit used in our review.


The screenshots below show the CrystalDiskMark v5.0.2 scores of the Mushkin Atlas Vital SSD in the Skylake NUC6i5SYK with BIOS v0042 on the left and the new development BIOS (v1142) on the right.
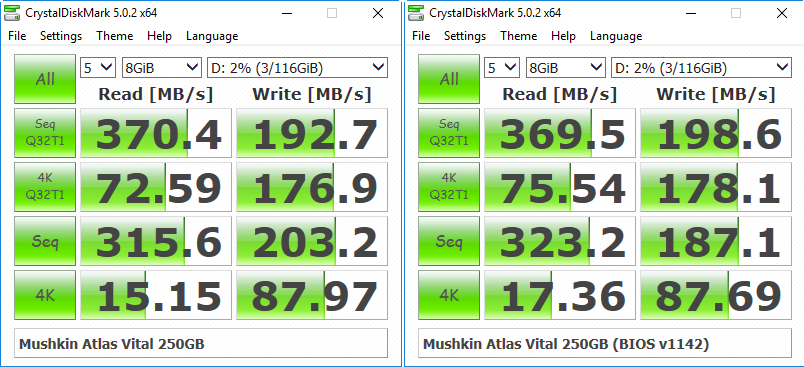
The SSD is presented here as a value proposition, and is not meant to lead the performance charts obviously. The SATA interface is the main limitation, and the OPI GT2 or GT4 rates have no effect on the performance of the SSD.
Do these artificial benchmark numbers have any bearing on the performance of the drive in real-world workloads that might be run on Skylake-U systems? The next few sections attempt to address that question.
SYSmark 2014 Benchmarks
BAPCo's SYSmark 2014 is an objective performance benchmark for PCs. It is based on running real computer applications that one might use in day-to-day business / office activities. It is important to note that it does not intend to artificially drive components to peak capacity. Real user workloads and datasets are processed to determine how the user experience is impacted by the performance of the system.
SYSmark 2014 has three usage scenarios
- Office Productivity
- Media Creation
- Data/Financial Analysis.
The Office Productivity scenario models productivity usage including word processing, spreadsheet data manipulation, email creation/management and web browsing. The Media Creation scenario models using digital photos and digital video to create, preview, and render advertisements for a fictional businesses. The Data/Financial Analysis scenario creates, compresses, and decompresses data to review, evaluate and forecast business expenses. Also, the performance and viability of financial investments is analyzed using past and projected performance data.
The raw scores are meant to be compared against the 1000 scored by a Haswell Core i3-based desktop sporting a 500GB hard drive and 4GB of RAM. A score of 2000 would meant that the PC under test would appear to be twice as responsive as the calibration system.
SYSmark 2014's whitepaper (PDF) includes sensitivity analysis - how the scores vary with the amount of RAM, processor choice, GPU, storage drive, OS and display resolution. The whitepaper's sensitivity analysis for the storage subsystem involves comparison of a hard-drive based system and a SATA SSD. One can get as much as 20% improvement in scores (depending on the workload) by upgrading from a HDD to a SSD.
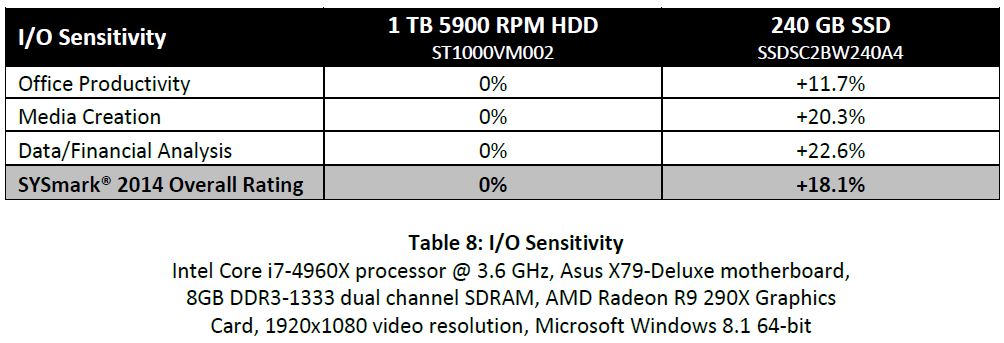
Since our evaluation also keeps all the system hardware and software the same, except for the storage drive, it also fits SYSmark 2014's sensitivity analysis model. What is the improvement when one goes from a SATA SSD to a PCIe SSD, or, from a PCIe AHCI SSD to a PCIe NVMe SSD, or, from a PCIe 2.0 x4 SSD to a PCIe 3.0 x4 SSD? The graphs in this section bring out the SYSmark 2014 scores in these scenarios.
A note about the colors used in the graphs is in order. Since we are dealing with a number of degrees of freedom - BIOS version differences corresponding to OPI GT2 and OPI GT4 rates, as well the characteristics of the SSDs themselves - PCIe vs. SATA and AHCI vs. NVMe, we chose to go with a lighter color shade for the older BIOS / OPI GT2 link and separate colors for the different SSDs.
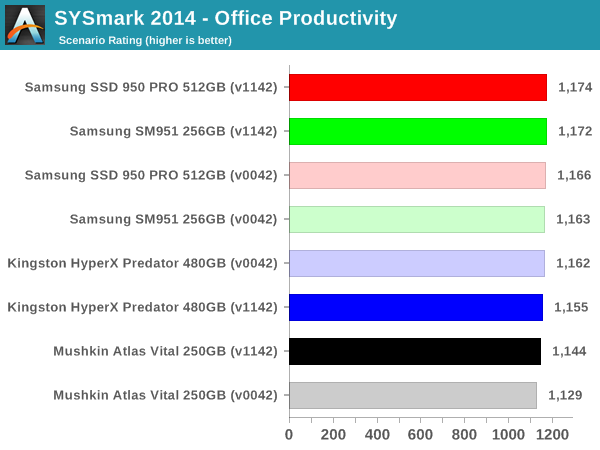
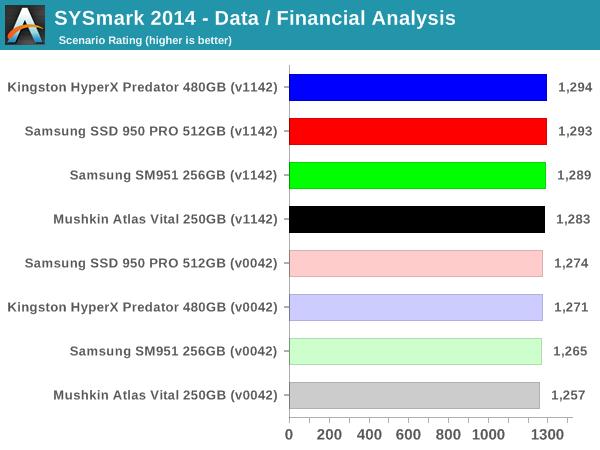
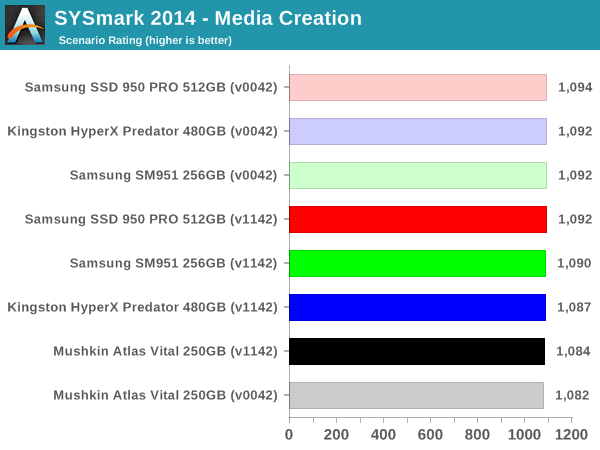
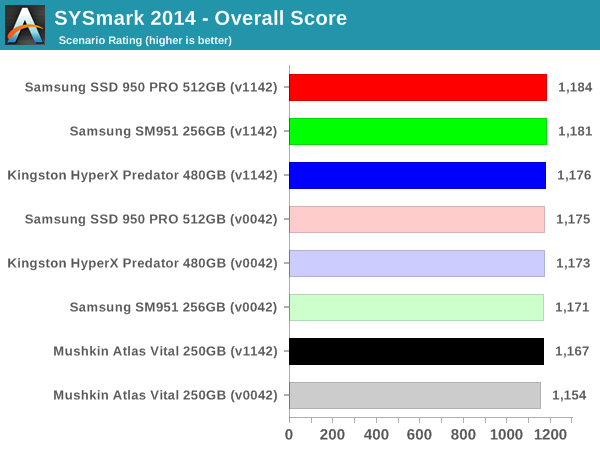
The important takeaway here is that day-to-day PC activities have little to gain by moving from AHCI to NVMe or from PCIe 2.0 x4 to PCIe 3.0 x4. There is a bit of discernible benefit in moving from SATA to PCIe, though. Surprisingly, the OPI GT4 rates improve the scores quite a bit for the Mushkin Atlas Vital SATA SSD. This means that even budget Skylake NUC users using traditional SATA SSDs have something to gain by moving to the BIOS with OPI GT4 rates when it becomes public.
PCMark 8 Storage Bench
Futuremark's PCMark 8 evaluates the performance of PCs with a variety of benchmarks for different use-case scenarios. We usually present the scenario scores in all our system reviews. It is similar to the SYSmark 2014 scoring in terms of presenting overall effectiveness of the system for day-to-day activities. However, PCMark 8 also includes a dedicated storage benchmark suite.
The PCMark 8 Storage test simulates disk activity by playing back a trace of storage activity recorded during actual use of applications from the Adobe Creative Suite, Microsoft Office and a selection of popular games. Idle time compression is is avoided to make the benchmark behave more like real-world applications. The benchmark keeps track of the time taken to complete playback of the trace (termed as the primary result). The secondary result is the total amount of data transferred (both reads and writes) divided by the storage I/O busy time (i.e, time duration during which the number of pending I/O operations was at least 1). The secondary result is a very important metric when idle time compression is involved, but it doesn't matter as much as the primary result when it comes to application responsiveness (as the workload might be CPU-bound, rather than storage-bound).
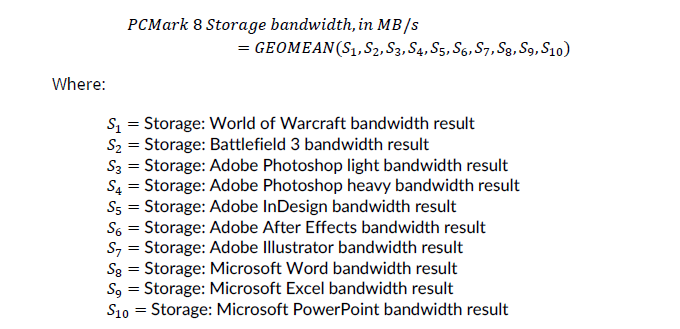
PCMark 8's technical guide (PDF) explains the formulae used to arrive at the benchmark scores that are presented in the two graphs below.
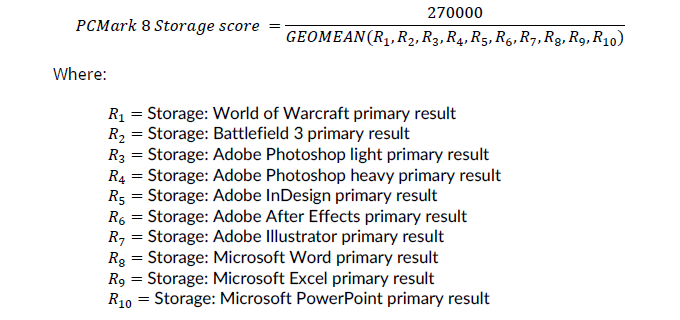
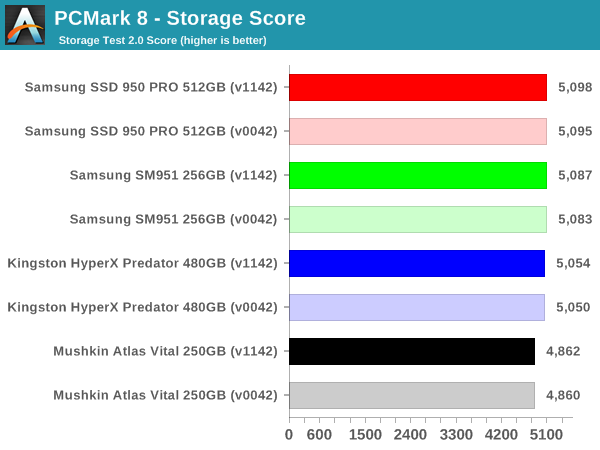
The storage scores reflect what we saw in the SYSmark 2014 results. When it comes to SATA vs. PCIe, there is a significant difference (translates to approximately 1 - 2s differences in the time taken to complete each of the storage traces). However, between AHCI and NVMe, there is not much to choose. In fact, the difference of 30 to 40 points comes from differences as low as 0.1s - 0.4s in the time taken to complete each of the traces. In real-world situations, it is our opinion that this is indiscernible to the end-user.
A detailed breakdown of the time taken to complete each trace for different SSDs in the Skylake NUC6i5SYK using BIOS v1142 is available in the exported storage bench results linked below.
- Mushkin Atlas Vital 250GB (PDF)
- Kingston HyperX Predator 480GB (PDF)
- Samsung SM951 256GB (PDF)
- Samsung SSD 950 PRO 512GB (PDF)
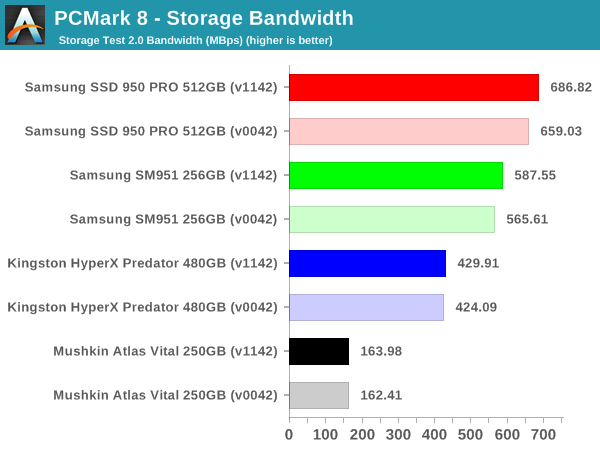
The bandwidth numbers, on the other hand, show that there is a lot to gain by going from SATA to PCIe, and from AHCI to NVMe, and from PCIe 2.0 to PCIe 3.0. However, the gains obtained in each of these upgrades becomes progressively smaller. Current PC usage models (typical of what one might do with a Skylake-U system) have minimal benefit from moving to NVMe or PCIe 3.0 when it comes to application responsiveness.
AnandTech DAS Suite - Power Consumption and Thermal Characteristics
SYSmark 2014 and PCMark 8 provide a high-level view of how the storage device might affect the overall responsiveness of the system. However, when evaluating different SSDs for use in the same system, there are other factors like power consumption and thermal characteristics. In addition, one of the scenarios not considered by either SYSmark 2014 or PCMark 8 is the transfer of large amounts of data (say, a bunch of photos or videos) from a mass storage device to the primary drive in the system. AnandTech's DAS (Direct-Attached Storage) Test Suite covers all these aspects.
The Intel NUC6i5SYK doesn't have a USB 3.1 Gen 2 or Thunderbolt port. Hence, it is difficult, if not, impossible, for an external storage device to keep up with the performance of the PCIe drives inside the system. Therefore, we modified our DAS suite to do the transfer from the primary 120GB partition to the secondary partition of the SSD under test. No RAM drive was set up. The bandwidth and temperature tracking were retained. The test can also reveal whether thermal throttling is triggered due to the transfer of large amounts of data (around 250GB) within a small time window. Before looking at the performance consistency / temperature / bandwidth graphs, let us take a look at the total instantaneous bandwidth numbers for the three different test cases in the DAS test suite.
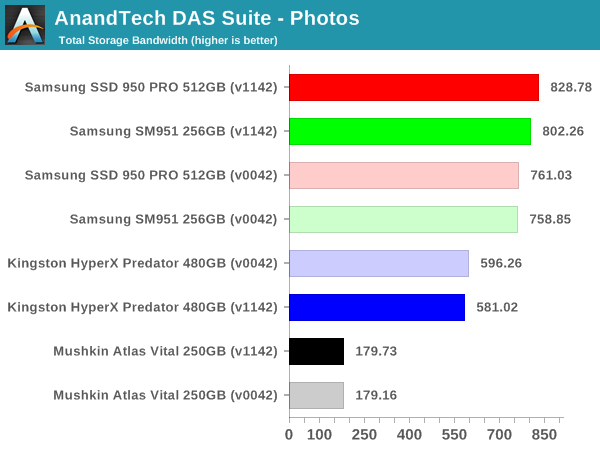
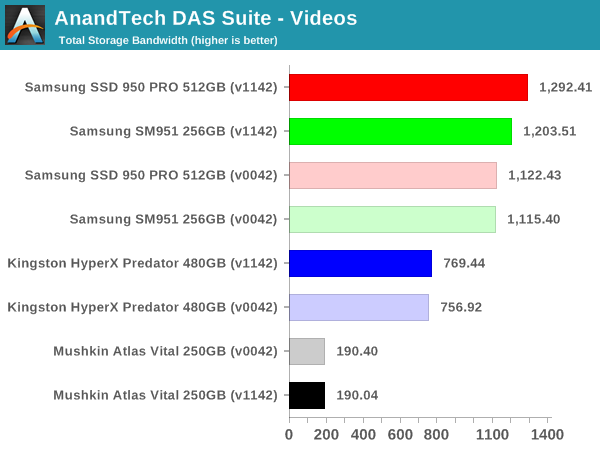
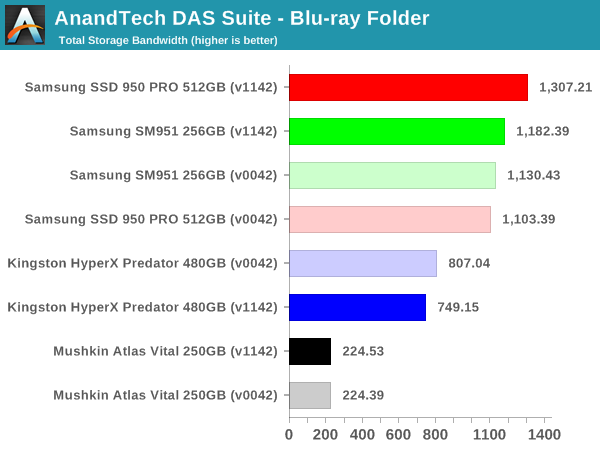
In terms of raw bandwidth and the time taken to finish copying large amounts of data between partitions, the PCIe 3.0 x4 NVMe SSDs obviously win big. However, one must also consider how common this use-case is going to be (given that most external storage devices for Skylake-U systems are not going to keep up with PCIe 2.0 x4 AHCI drives, let alone going to PCIe 3.0 x4 NVMe drives).
The graphs below show the temperature and instantaneous bandwidth numbers for different SSDs with the two BIOS versions. Below that, we also have the power consumed at the wall by the NUC while processing the test suite.
| AnandTech DAS Suite Instantaneous Bandwidth, Thermal Characteristics and At-Wall Power Consumption |
|||
| Mushkin Atlas Vital 250GB MKNSSDAV250GB D8 | Samsung SM951 256GB MZVPV256 | Samsung SSD 950 PRO 512GB | Kingston HyperX Predator 480GB SHPM2280P2H 480G |
-Performance-Consistency.png) |
|||
-Power.png) |
|||
| Mushkin Atlas Vital 250GB MKNSSDAV250GB D8 | Samsung SM951 256GB MZVPV256 | Samsung SSD 950 PRO 512GB | Kingston HyperX Predator 480GB SHPM2280P2H 480G |
The interesting graph to note here is that of the Kingston HyperX Predator SSD. Within a short time after the benchmarking script completes, the drive starts doing power-intensive data shuffling using the huge 1GB DRAM cache on the SSD. We did confirm that the consistently high power draw during the process was not related to any CPU activity. It can also be seen that this background activity in the HyperX Predator is dependent on a number of factors, and the behavior is not always consistent (with the older BIOS, the activity took place without any breaks, but, with the newer BIOS, there were two regions of idling inbetween).
| Intel NUC6i5SYK - Idle Power Consumption | ||||
| Samsung SM951 | Samsung SSD 950 PRO | Kingston HyperX Predator | Mushkin Atlas Vital | |
| OPI GT2 (BIOS v0042) |
7.86 W | 8.46 W | 10.77 W | 7.62 W |
| OPI GT4 (BIOS v1142) |
8.18 W | 10.15 W | 10.78 W | 8.25 W |
Coming back to the quantitative aspects, the tables on either side show the power numbers for the two different link rates (they are slightly different from the numbers in the graphs above, because they only consider the time taken for the test suite to complete, and don't take into account the eventual data shifting done by the controller during idle periods). It can be seen that OPI GT2 is a little bit more power efficient compared to OPI GT4 for the same hardware configuration. The load numbers are a bit different, though, with there being no clear winner across all tested SSDs.
| Intel NUC6i5SYK - Load Power Consumption (AnandTech DAS Suite) | ||||
| Samsung SM951 | Samsung SSD 950 PRO | Kingston HyperX Predator | Mushkin Atlas Vital | |
| OPI GT2 (BIOS v0042) |
22.49 W | 22.49 W | 20.06 W | 17.53 W |
| OPI GT4 (BIOS v1142) |
22.09 W | 22.14 W | 21.24 W | 16.08 W |
The Mushkin Atlas Vital is the most power efficient of the lot (both at load and idle). Even though the Mushkin SSD consumes a lot more energy for the tested task compared to the other SSDs, its idle power is also the lowest. For a desktop running 24x7, it is bound to come out as the better choice for users building a low power computer. The Kingston SSD idles a bit higher compared to the Samsung SSDs, but the load power is lower thanks to the lower transfer rates sustained by former. The number of flash packages and the presence of DRAM in the SSD also influences the power consumption numbers in the above tables. Temperature-wise, all the SSDs ended up between 56 and 59C after the test suite finished processing.
Miscellaneous Aspects and Concluding Remarks
Intel's Skylake platform attempts to scale a wide variety of computing form factors, and its members span a wide TDP range - from 4.5W up to 91W. The low power Y- and U- series CPUs come with plenty of knobs in order to enable Intel's customers to create the right characteristics for a product to achieve the desired performance level. In designing the Intel NUC, one of these parameters (namely, the speed at which the on-die platform controller hub and the CPU communicate) was left at the default low-power setting. This prevented PCIe 3.0 x4 SSDs from achieving optimal performance. Fortunately, Intel has a BIOS fix in the pipeline that enables the get NUC6i5SYK to full performance with the latest generation of high-performance PCIe 3.0 x4 NVMe SSDs.
Intel provided us with advanced access to the development BIOS, and we were able to verify that the fix works as intended. We also took this opportunity to evaluate different M.2 SSDs in order to determine the right fit for a particular build. The results were as expected, but presented a wealth of data for the average PC builder to consider.
PCs that are going to be used for business / office activities or basic personal computing tasks have very little to gain by going in for the higher-priced PCIe cards. A SATA SSD is more than good enough for these purposes, as shown by the SYSmark 2014 scores. For other scenarios, such as those involving heavy multimedia editing and frequent transfers of large-sized files, the PCIe SSDs can definitely provide tangible benefits. Keeping that in mind, let us take a look at the conditions under which one might choose the different SSDs evaluated in this article.
Mushkin Atlas Vital 250GB
This is the budget choice, coming in at just $90 for 250GB of storage. The SandForce controller has been around for a long time now, and it can be considered to be stable and proven in the field. Mushkin also promises MLC flash in the SSD. For a majority of the use-cases for Skylake-U systems, this SATA 6Gbps M.2 SSD balances price and performance perfectly.
Kingston HyperX Predator 480GB
In terms of price per GB, it is quite close to the Samsung SSDs discussed below. In terms of performance and features (PCIe 2.0 / AHCI), it does come second to them too. The power consumption is also a bit on the higher side, making it unsuitable for users looking to upgrade their notebooks. The SSD also makes extensive use of the 1GB DRAM cache, due to which we recommend ensuring uninterrupted power supply to the system in which it is used.
However, the Kingston SSD impresses us with one major feature - the endurance claims coupled with the warranty. Kingston has a 3-year warranty, but, it also says that the 480GB version can withstand 1.7 drive writes per day (DWPD). This works out to more than 891TB of writes, compared to the 75 - 400TB of the Samsung drives discussed in this article.
We have no hesitation in recommending the $300 HyperX Predator M.2 480GB SSD for Skylake-U desktops with heavy write workloads (common in multimedia editing and other similar scenarios). It strikes the best balance of endurance and performance for such use-cases.
Samsung SM951 256GB
Most consumers should opt for the more recent SSD 950 PRO, unless the SM951 is available for a much lower price per GB. Both of them have similar performance in Skylake-U systems with the higher OPI link rates, as they both use the same controller and interface / protocol (PCIe 3.0 x4 / NVMe). However, the warranty aspect is a bit worrisome, since the SM951 is an OEM model. The pricing from third-party sellers is also a bit on the higher side, with the 256GB model that we evaluated coming in at $200. In addition, it uses lower endurance flash memory compared to the 950 PRO. All in all, given a choice between the SM951 and the 950 PRO, it would make sense to go with the latter.
Samsung SSD 950 PRO 512GB
We saved the best for the last. This is undoubtedly the top performer, has the best warranty (five years), and uses the latest MLC V-NAND flash technology (promising higher endurance compared to the planar NAND used in the SM951). The power profile is also excellent (better than both the SM951 and the Kingston HyperX Predator). To top it all, the price per GB is very competitive, with the 512GB version coming in at $318. Pretty much the only downside is the lower endurance rating (400TBW) compared to the Kingston HyperX Predator.
Coming to the business end of the review, it is heartening to see Intel respond in a quick and positive manner to user complaints regarding the performance of PCIe 3.0 x4 SSDs in the Skylake NUC. The available tweak will also enable Skylake-U system manufacturers such as GIGABYTE (with its latest BRIX lineup) and Zotac (which has regularly put out mini-PCs based on the U-series CPUs) to optimize system performance. We also managed to check out four different SSDs for usage in Skylake-U systems in general (and the NUC6i5SYK in particular). All the four SSDs considered in the article are good choices for Skylake-U systems, though the ideal fit would depend on the budget as well as the intended use-case.


