Original Link: https://www.anandtech.com/show/10724/zotac-zbox-ci523-nano-fanless-skylakeu-minipc-review
Zotac ZBOX CI523 nano Fanless Skylake-U mini-PC Review
by Ganesh T S on October 5, 2016 8:00 AM EST
Passively cooled computing systems are popular amongst consumers worried about noise from fans and their associated maintenance requirements (particularly, for industrial use-cases). Traditionally, fanless high-performance PCs have come with a high price tag. However, with the focus on low-power Core-series CPUs by Intel, we have many vendors targeting this market segment with affordable models. Zotac started a new lineup of passively cooled ultra-compact form factor (UCFF) machines in the C-series back in mid-2014. Initially, the members of the series utilized either Atom-class or -Y series CPUs (with a sub-10W TDP). With Skylake, Zotac has re-engineered the design to accommodate 15W Skylake-U CPUs. This review focuses on evaluating the performance and thermal design of the Zotac ZBOX CI523 nano, a fanless NUC-style machine designed to go against the Intel NUC6i3SYH (based on the Intel Core i3-6100U).
Introduction
Zotac's fanless C-series mini-PCs have been generally been well-reviewed and can be credited with bringing affordable passively-cooled high-performance computing systems to the average consumer. We reviewed the three different families in the first-generation - the Haswell-Y-equipped ZBOX CI540 nano, the AMD A6-1450-equipped ZBOX CA320 nano and the Bay Trail-M-equipped ZBOX CI320 nano. Out of these three, the Haswell-Y probably put the most stress on the thermal design with a 11.5W TDP / 6W SDP. However, our thermal stress test showed that the design was able to handle that without any hiccups. With the latest C-series announced in tandem with other Skylake mini-PCs, Zotac has gone in for a slightly larger and heavier solution to handle the higher TDP of the Skylake-U series. In order to maintain affordability and price-competitiveness against the corresponding actively-cooled Intel NUC, Zotac has opted for DDR3L SO-DIMM slots (instead of DDR4) and support for 2.5" SATA drives only (no M.2 slot).
Hardware Design and Platform Analysis
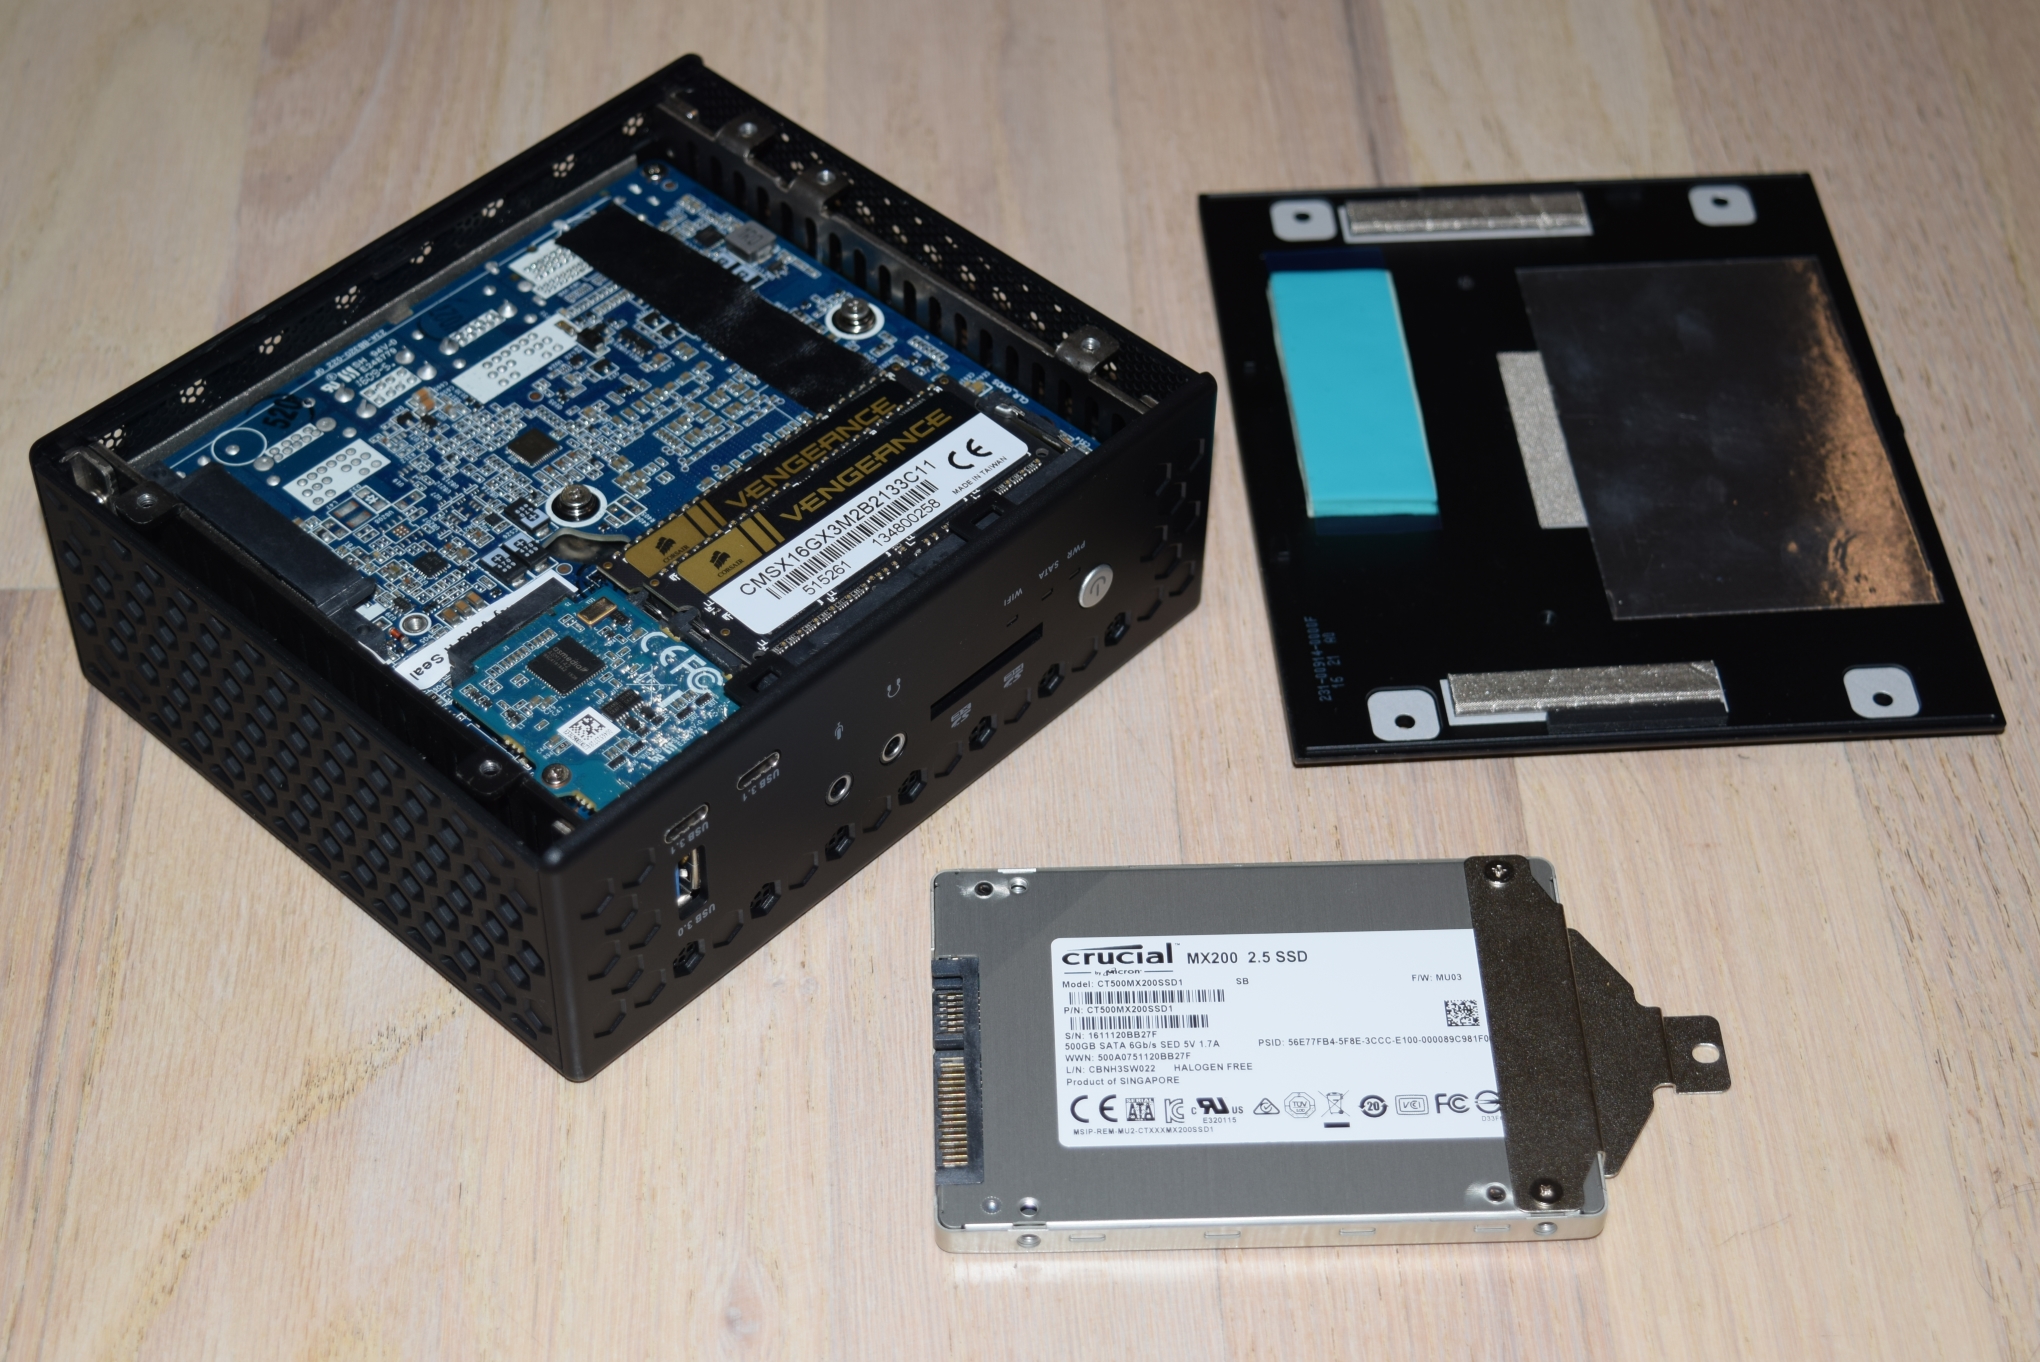
The Zotac ZBOX CI523 nano comes in a barebones configuration as well as PLUS configurations. The latter includes a single RAM stick (one slot left empty for future upgrade by the end user) and a SSD. We were sampled the barebones configuration. In order to complete the build, we used Corsair's Vengeance DDR3L 2133 MHz 2x 8GB kit and a 500GB Crucial MX200 SSD.
The specifications of our review configuration are presented in the table below.
| Zotac ZBOX CI523 nano Specifications | |
| Processor | Intel Core i3-6100U Skylake, 2C/4T, 2.3 GHz, 14nm, 3MB L2, 15W TDP |
| Memory | Corsair Vengeance CMSX16GX3M2B2133C11 9-9-9-28 @ DDR3L-1600 2x8 GB |
| Graphics | Intel HD Graphics 520 |
| Disk Drive(s) | Crucial MX200 CT500MX200SSD1 (500 GB; 2.5in SATA 6Gb/s; 16nm; MLC) |
| Networking | Intel Dual Band Wireless-AC 3165 (1x1 802.11ac - 433 Mbps) Realtek RTL8168/8111 PCIe Gigabit Ethernet Adapter |
| Audio | 3.5mm Headphone and Microphone Jacks (Realtek ALC892) Capable of 5.1/7.1 digital output with HD audio bitstreaming (HDMI) |
| Display | 1x DP 1.2 (3840x2160 @ 60 Hz) 1x HDMI 1.4b (4096x2160 @ 24Hz) |
| Miscellaneous I/O Ports | 2x USB 3.1 Gen 2 Type-C 2x USB 3.0 Type-A 2x USB 2.0 Type-A 1x SDXC Slot |
| Operating System | Retail unit is barebones, but we installed Windows 10 Pro x64 |
| Pricing (As configured) | $320 ($640) |
| Full Specifications | Zotac ZBOX CI523 nano Specifications |
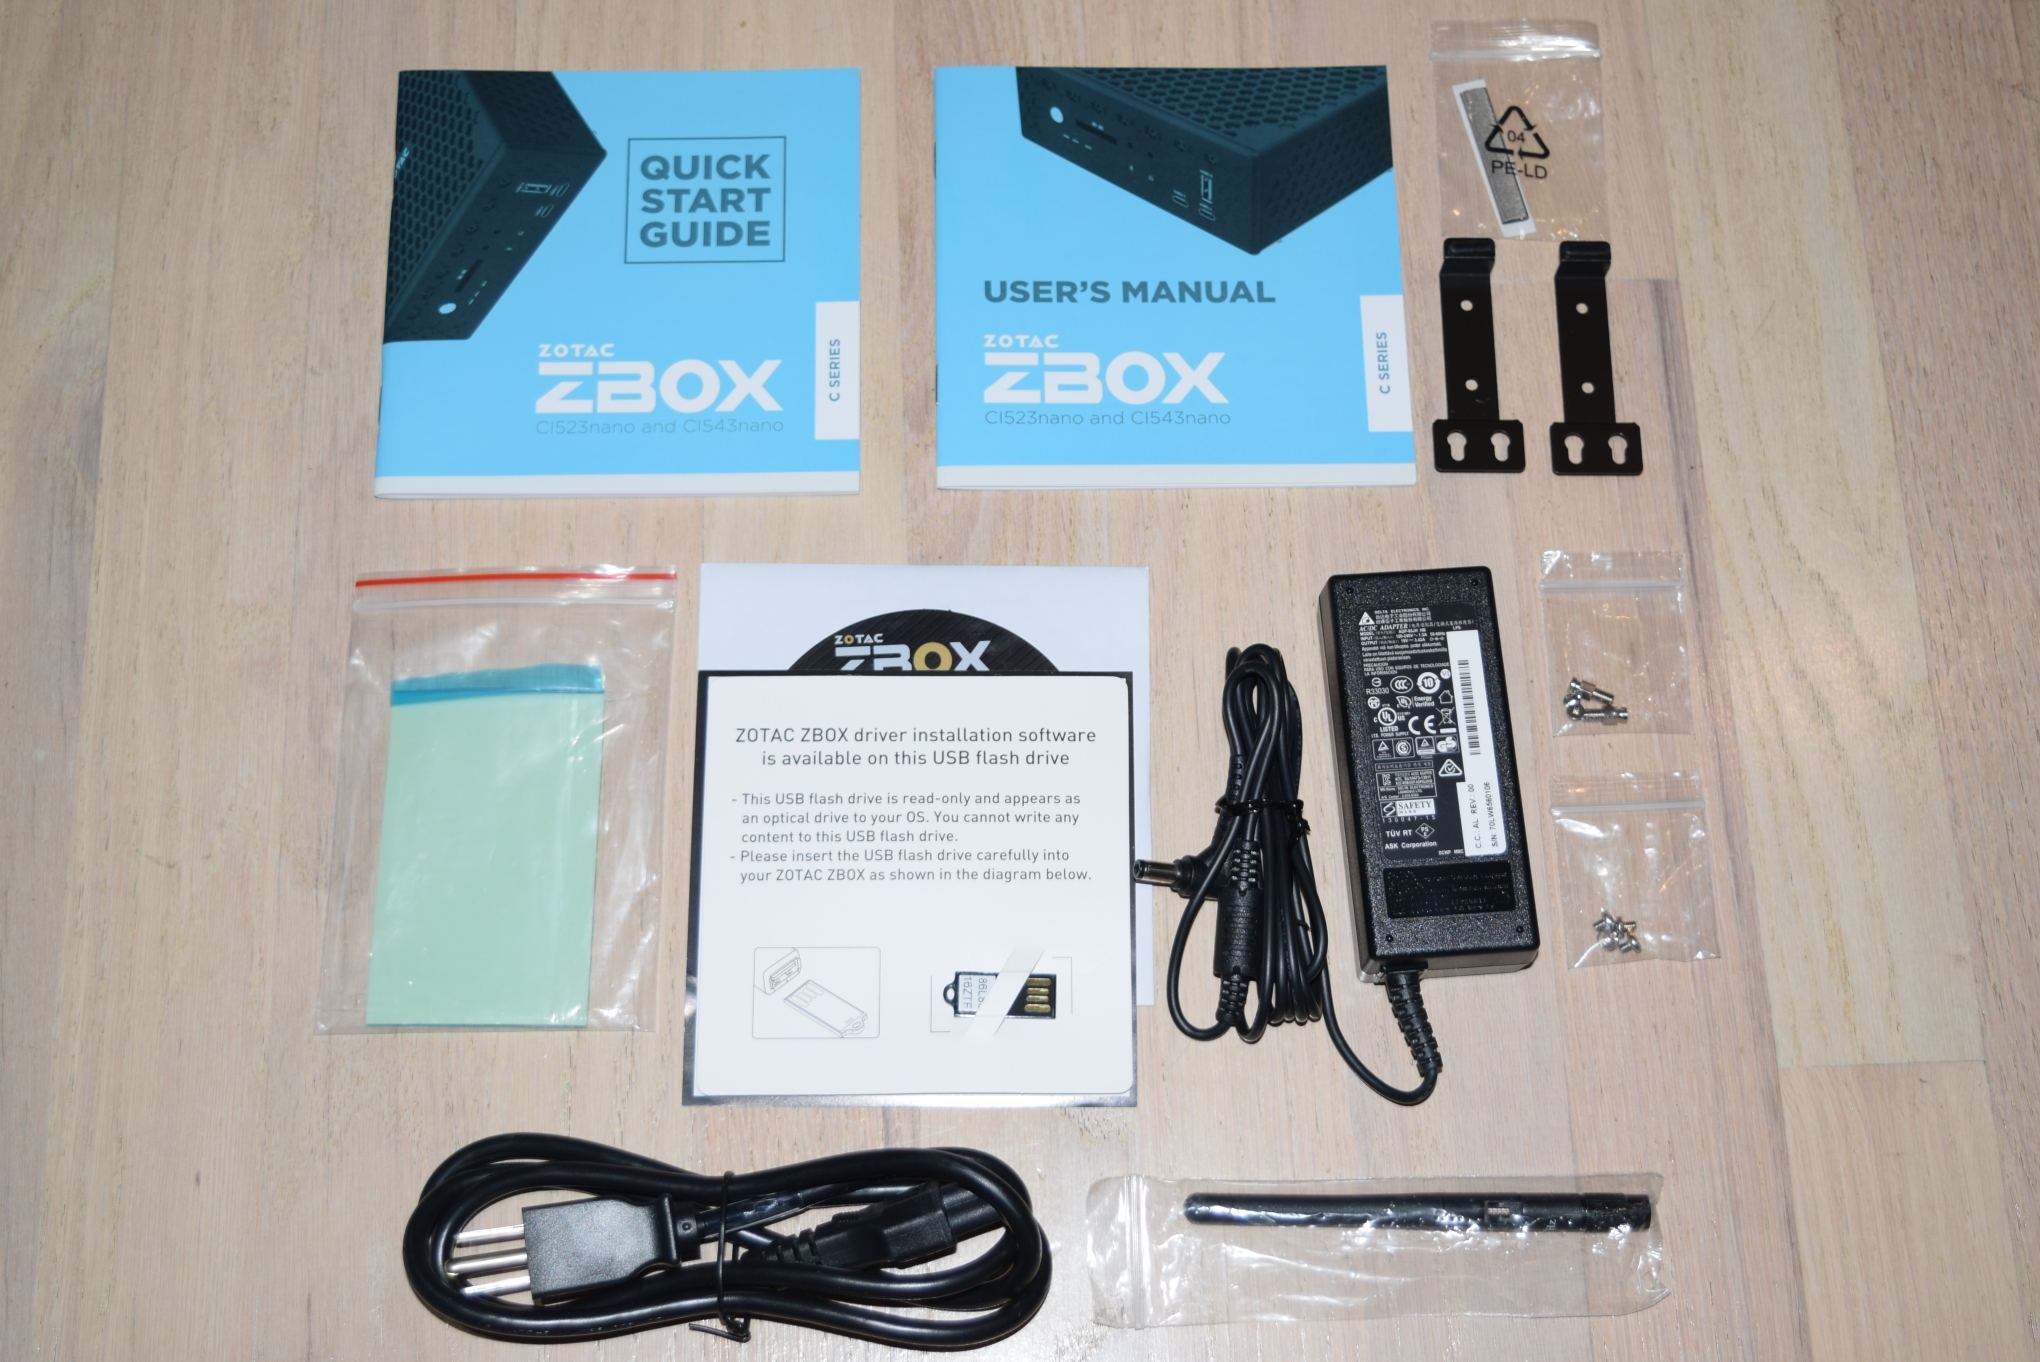
The kit doesn't come with any OS, but we installed Windows 10 Pro x64 for our benchmarking purposes. The package does include a CD as well as a read-only USB key with the Windows 10 drivers. Other than the main unit, we also have a 65W (19V @ 3.42A) DC adapter, a user manual and a quick start guide, metal tabs and screws for VESA mounting, a thermal pad for the 2.5" drive and a dual-band Wi-Fi dipole antenna.
The dimensions of the CI523 nano come in at 146.4mm x 126.5mm x 60.5mm, making it slightly larger than the NUC6i3SYH at 115mm x 111mm x 48mm. The internals get an upgrade compared to the previous C-series units: instead of the thermal pad over the SoC / CPU, we now have a substantial heat-sink (pictured in the gallery below, courtesy of ComputerBase.de). The underside of the chassis also has a metal plate with ridges to aid in VESA mounting. The ridged plate is part of the thermal design to take away the heat from the DRAM and the 2.5-inch drive on the bottom side of the board. This is aided by thermal pads that are affixed to those components and make contact with the bottom part of the chassis. Otherwise, the chassis and thermal design are similar to the previous generation units - a honeycomb design with a mesh inside to help in the convective cooling process.


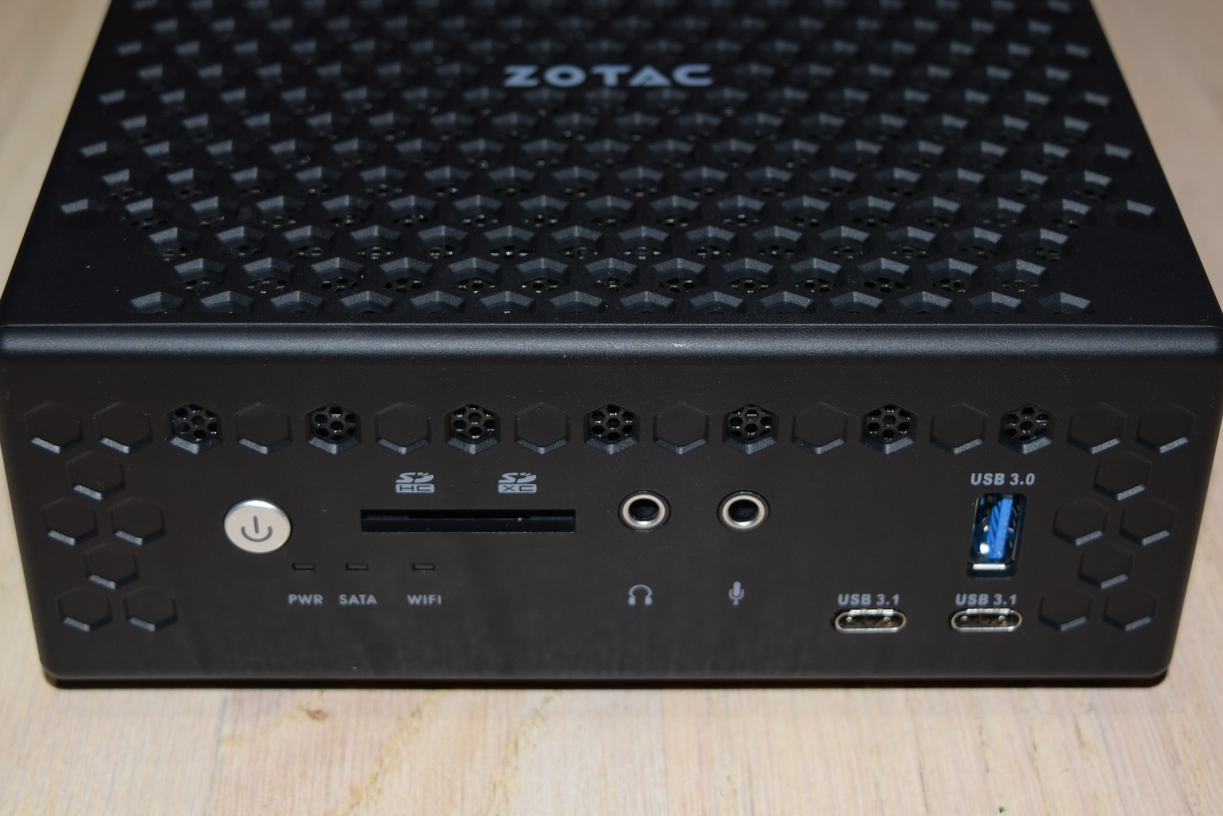
Moving on to the other features of the CI523 nano, we have two USB 3.1 Gen 2 Type-C ports in the front panel that are enabled by an ASMedia ASM1142 controller. A USB 3.0 Type-A port is placed vertically above these two Type-C ports. Audio jacks and a SDXC card slot, along with the power button and some status LEDs round out the front panel. The rear panel has two USB 2.0 ports and a USB 3.0 port (all Type-A), a RJ-45 Gigabit LAN port, HDMI and Display Port (full-size) outputs and a RP-TNC connector for the Wi-Fi dipole antenna.
The Zotac ZBOX CI523 nano is based on the standard Skylake-U platform with the Sunrise Point-LP PCH integrated in the same package as the CPU. There are a maximum of 16 possible high-speed I/O lanes in a Skylake-U system, and they can be configured in a flexible manner.
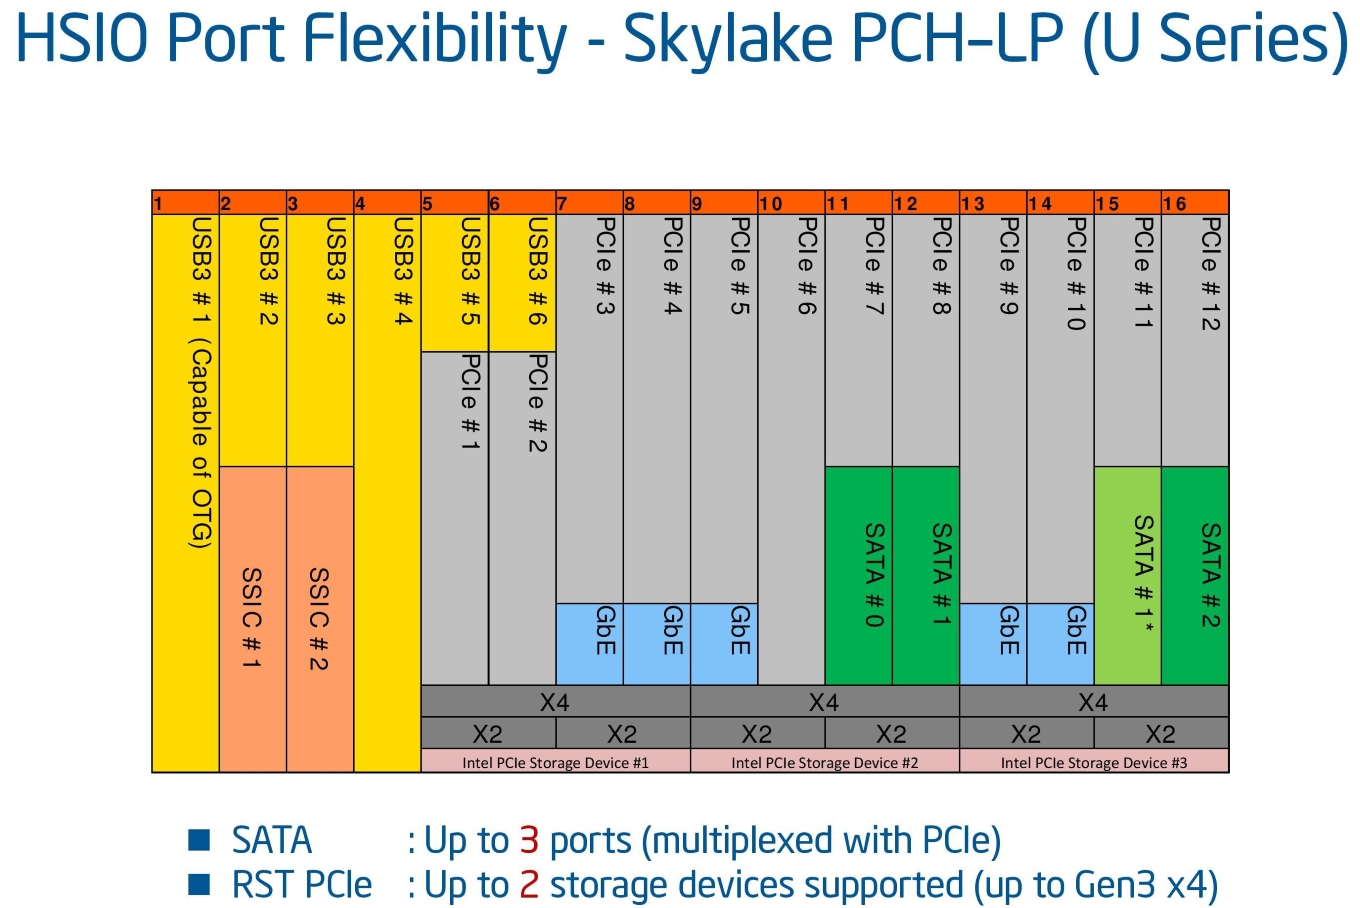
The PCIe lanes in our configuration of the ZBOX CI523 nano are distributed as follows:
- PCI-E 3.0 x2 port #4 In Use @ x1 (Realtek RTL8168/8111 PCI-E Gigabit Ethernet Adapter)
- PCI-E 3.0 x1 port #5 In Use @ x1 (Intel Dual Band Wireless-AC 3165 AC HMC WiFi Adapter)
- PCI-E 3.0 x1 port #12 In Use @ x1 (ASMedia ASM1142 USB 3.1 xHCI Controller)
In the table below, we have an overview of the various systems that we are comparing the ZOTAC ZBOX CI523 nano against. Note that they may not belong to the same market segment. The relevant configuration details of the machines are provided so that readers have an understanding of why some benchmark numbers are skewed for or against the ZOTAC ZBOX CI523 nano when we come to those sections.
| Comparative PC Configurations | ||
| Aspect | ZOTAC ZBOX CI523 nano | |
| CPU | Intel Core i3-6100U | Intel Core i3-6100U |
| GPU | Intel HD Graphics 520 | Intel HD Graphics 520 |
| RAM | Corsair Vengeance CMSX16GX3M2B2133C11 9-9-9-28 @ DDR3L-1600 MT/s 2x8 GB |
Corsair Vengeance CMSX16GX3M2B2133C11 9-9-9-28 @ DDR3L-1600 MT/s 2x8 GB |
| Storage | Crucial MX200 CT500MX200SSD1 (500 GB; 2.5in SATA 6Gb/s; 16nm; MLC) |
Crucial MX200 CT500MX200SSD1 (500 GB; 2.5in SATA 6Gb/s; 16nm; MLC) |
| Wi-Fi | Intel Dual Band Wireless-AC 3165 (1x1 802.11ac - 433 Mbps) |
Intel Dual Band Wireless-AC 3165 (1x1 802.11ac - 433 Mbps) |
| Price (in USD, when built) | $640 | $640 |
Performance Metrics - I
The ZOTAC ZBOX CI523 nano was evaluated using our standard test suite for low power desktops / industrial PCs. Not all benchmarks were processed on all the machines due to updates in our testing procedures. Therefore, the list of PCs in each graph might not be the same. In the first section, we will be looking at SYSmark 2014, as well as some of the Futuremark benchmarks.
BAPCo SYSmark 2014
BAPCo's SYSmark 2014 is an application-based benchmark that uses real-world applications to replay usage patterns of business users in the areas of office productivity, media creation and data/financial analysis. Scores are meant to be compared against a reference desktop (HP ProDesk 600 G1 with a Core i3-4130, 4GB RAM and a 500GB hard drive) that scores 1000 in each of the scenarios. A score of, say, 2000, would imply that the system under test is twice as fast as the reference system.
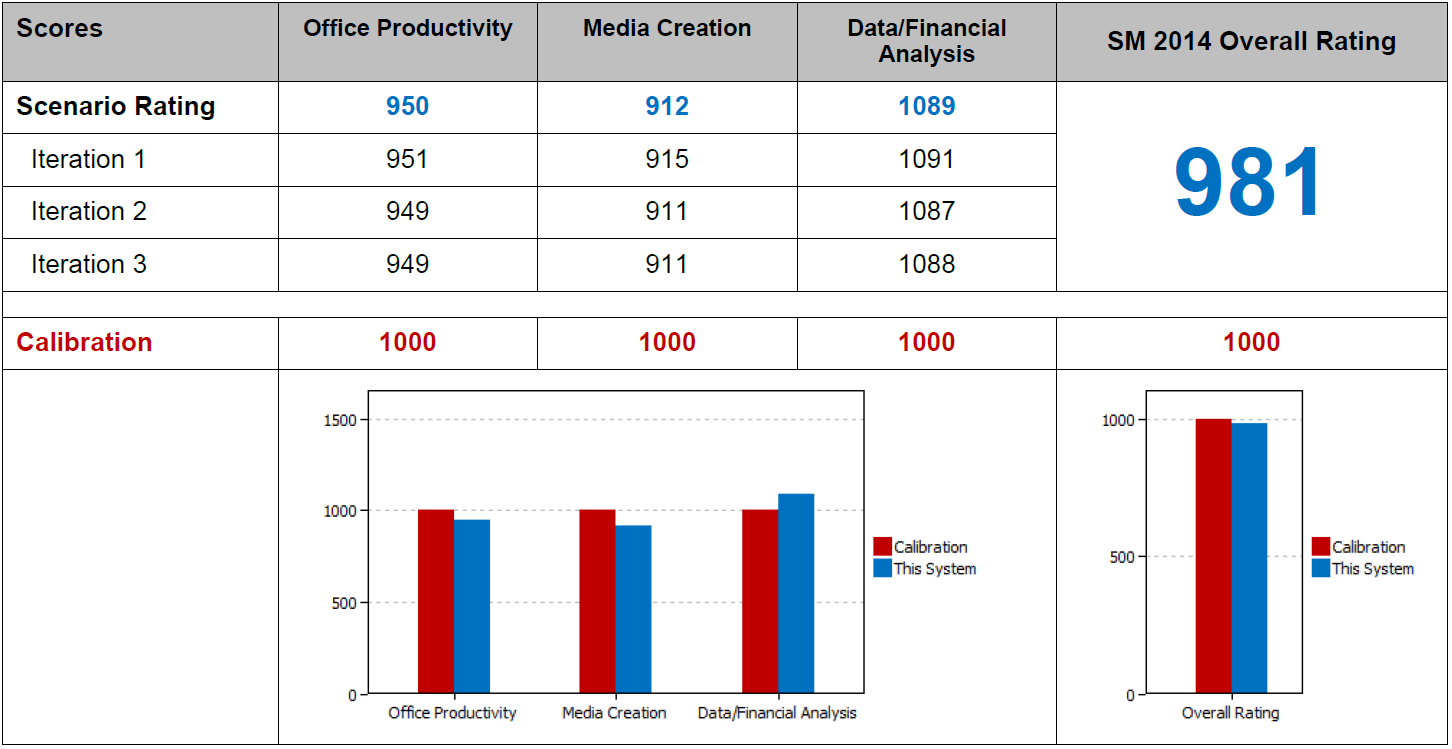
We have not processed SYSmark 2014 on any of the passively cooled PCs that have been through our review process before. So, we only have the reference system for comparison purposes. It is interesting to see that a Core i3-6100U can almost match a desktop Haswell Core i3 with a much higher TDP
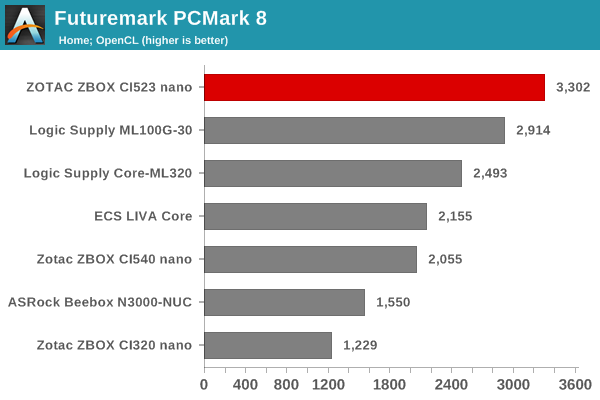
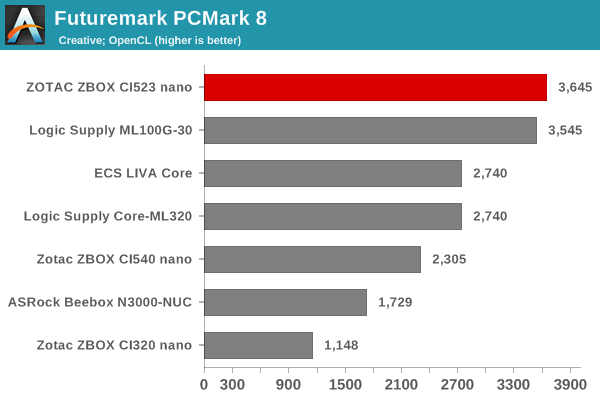
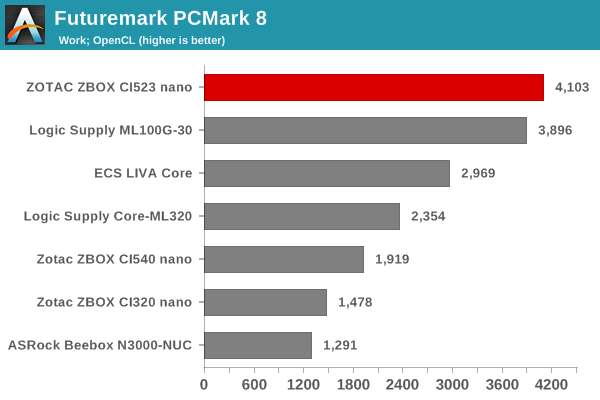
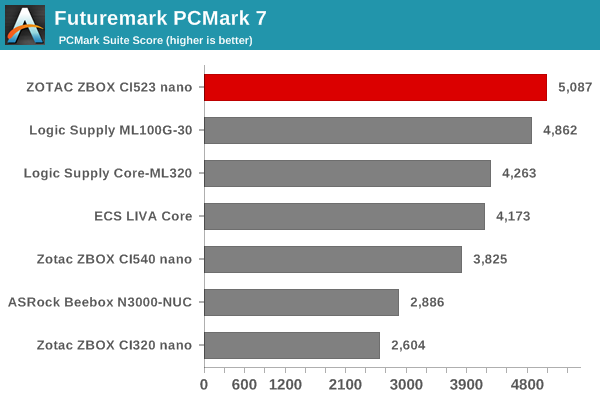
Futuremark PCMark 8
PCMark 8 provides various usage scenarios (home, creative and work) and offers ways to benchmark both baseline (CPU-only) as well as OpenCL accelerated (CPU + GPU) performance. We benchmarked select PCs for the OpenCL accelerated performance in all three usage scenarios. These scores are heavily influenced by the CPU in the system. The CI523 nano with a Skylake-U CPU is easily able to surpass all the other systems based on processors from the earlier generations.
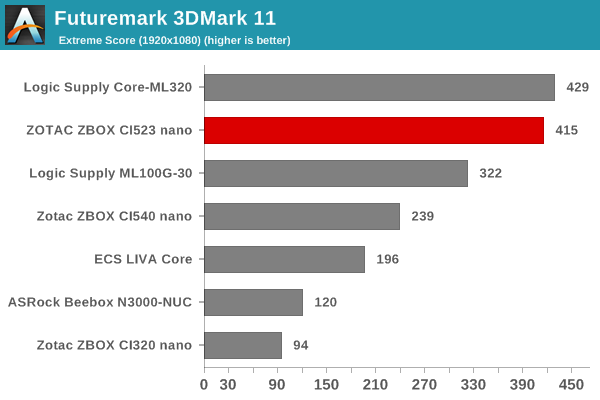
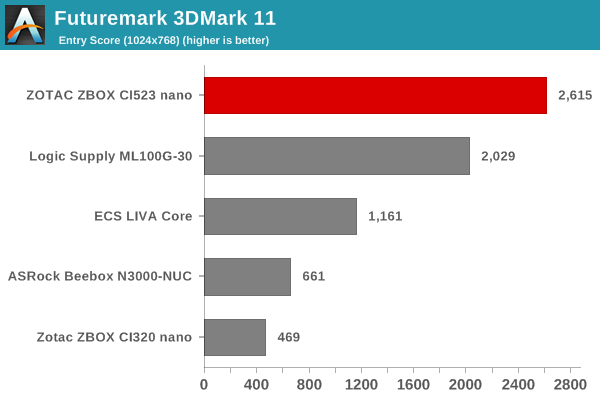
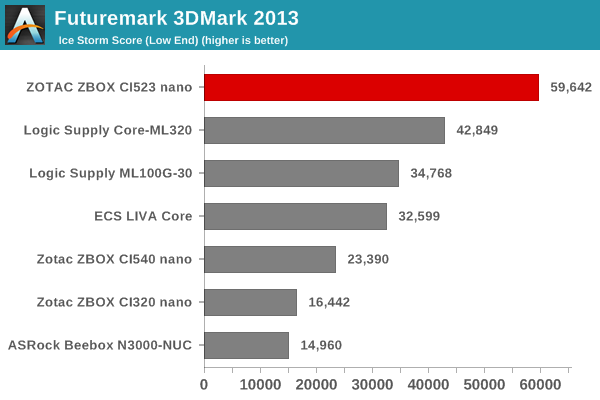
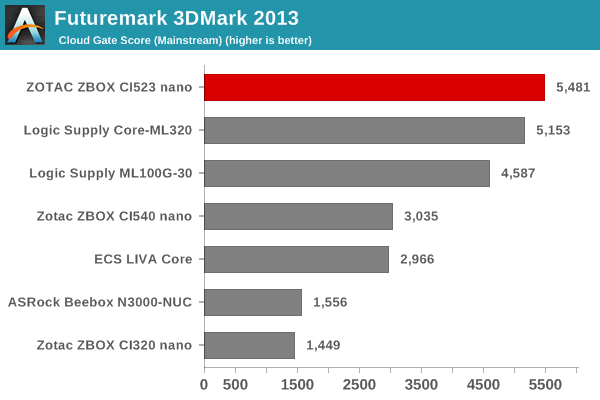
Miscellaneous Futuremark Benchmarks
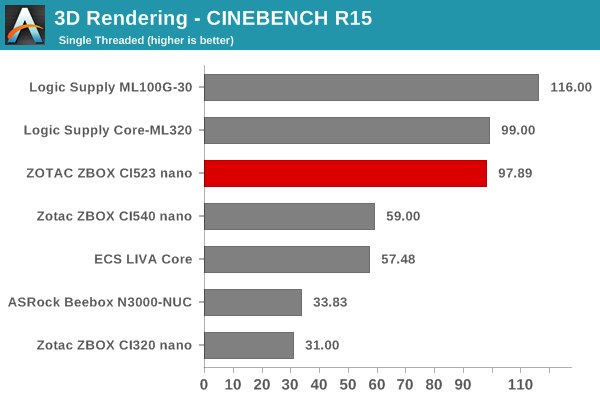
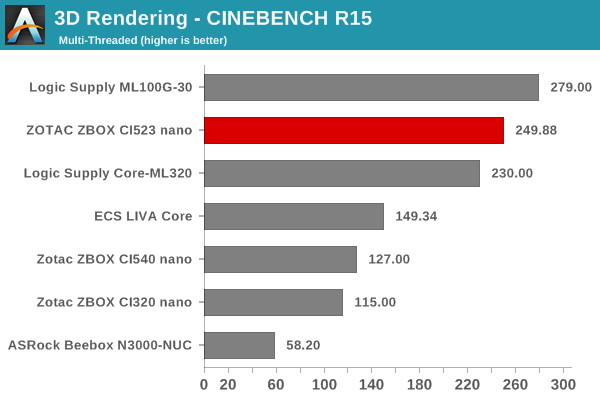
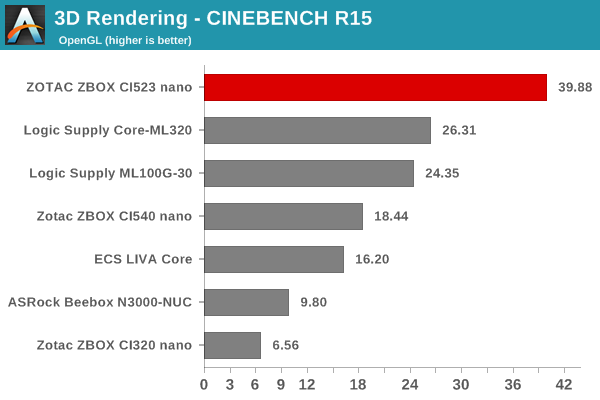
3D Rendering - CINEBENCH R15
CINEBENCH R15 provides three benchmark modes - OpenGL, single threaded and multi-threaded. Evaluation of select PCs in all three modes provided us the following results. In the CPU-focused benchmark, the Logic Supply ML100G-30 (based on a Broadwell-U Core i5, and having a higher turbo clock) is able to beat the CI523 nano (with a Skylake-U Core i3). However, the GPU improvements from Broadwell to Skylake ensure that the CI523 nano comes out on top in the OpenGL routine.
Performance Metrics - II
In this section, we mainly look at benchmark modes in programs used on a day-to-day basis, i.e, application performance and not synthetic workloads.
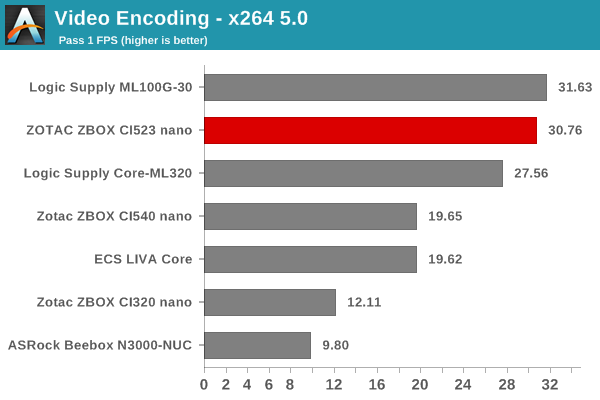
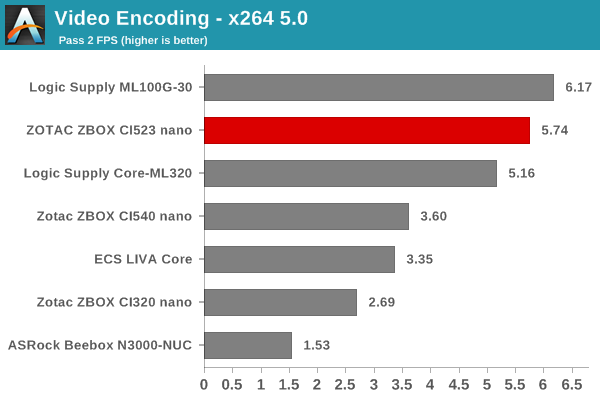
x264 Benchmark
First off, we have some video encoding benchmarks courtesy of x264 HD Benchmark v5.0. This is simply a test of CPU performance. As expected, the higher turbo frequency of the Core i5-5300U in the Logic Supply ML100G-30 pushes down the Zotac ZBOX CI523 nano to the second place amongst the PCs considered for comparison.
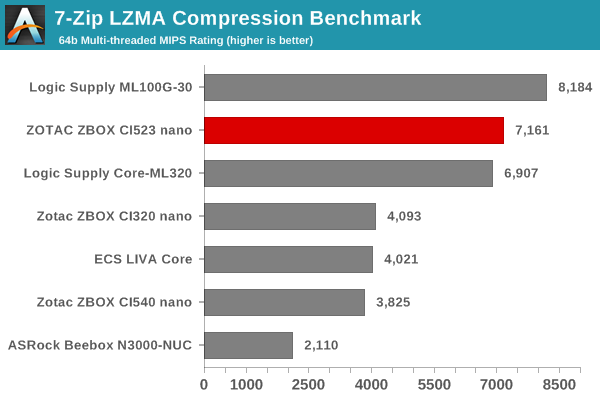
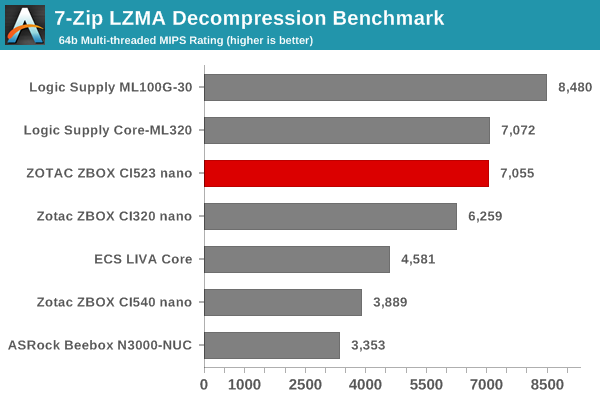
7-Zip
7-Zip is a very effective and efficient compression program, often beating out OpenCL accelerated commercial programs in benchmarks even while using just the CPU power. 7-Zip has a benchmarking program that provides tons of details regarding the underlying CPU's efficiency. In this subsection, we are interested in the compression and decompression MIPS ratings when utilizing all the available threads. Again, the higher turbo clock in the ML100G-30 helps it come ahead of the CI523 nano.
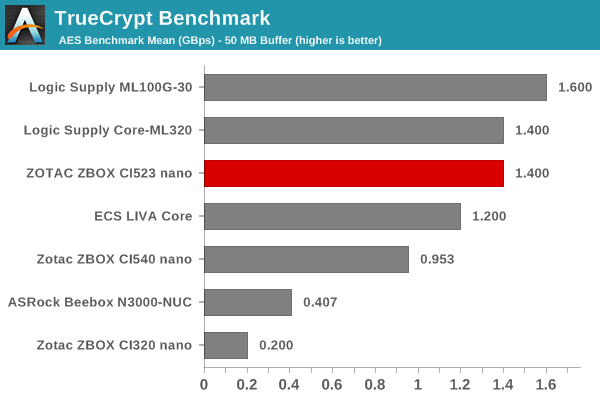
TrueCrypt
As businesses (and even home consumers) become more security conscious, the importance of encryption can't be overstated. CPUs supporting the AES-NI instruction can accelerate the encryption and decryption processes. The Core i3-6100U does have AES-NI support. TrueCrypt, a popular open-source disk encryption program can take advantage of the AES-NI capabilities. In the graph below, we can get an idea of how fast a TrueCrypt volume would behave in the ZOTAC ZBOX CI523 nano and how it would compare with other select PCs. This is a purely CPU feature / clock speed based test.
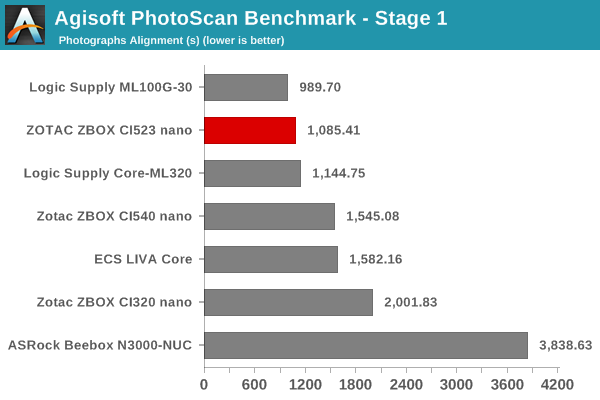
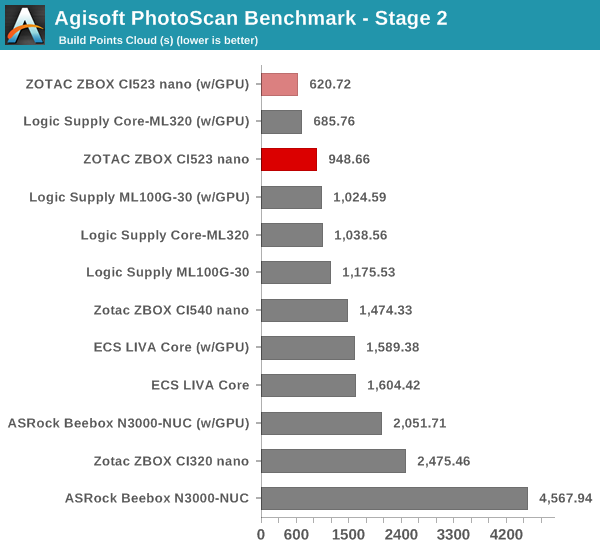
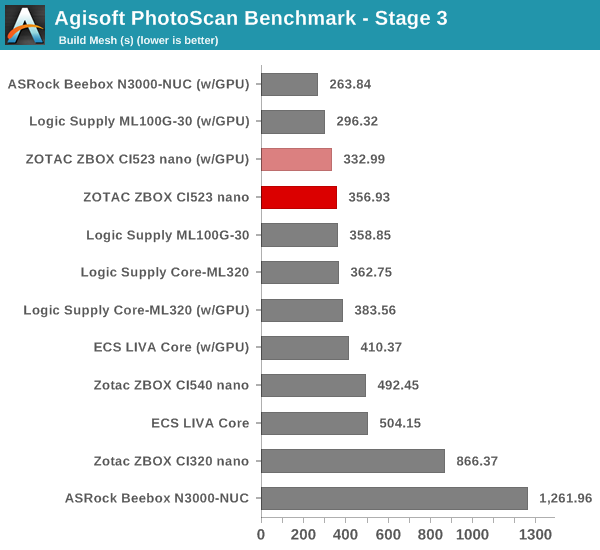
Agisoft Photoscan
Agisoft PhotoScan is a commercial program that converts 2D images into 3D point maps, meshes and textures. The program designers sent us a command line version in order to evaluate the efficiency of various systems that go under our review scanner. The command line version has two benchmark modes, one using the CPU and the other using both the CPU and GPU (via OpenCL). The benchmark takes around 50 photographs and does four stages of computation:
- Stage 1: Align Photographs
- Stage 2: Build Point Cloud (capable of OpenCL acceleration)
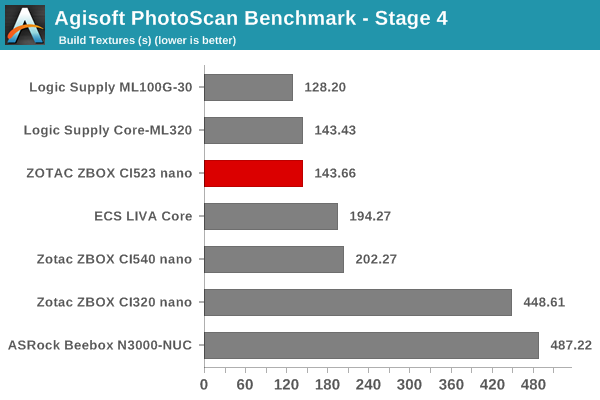
- Stage 3: Build Mesh
- Stage 4: Build Textures
We record the time taken for each stage. Since various elements of the software are single threaded, others multithreaded, and some use GPUs, it is interesting to record the effects of CPU generations, speeds, number of cores, DRAM parameters and the GPU using this software.
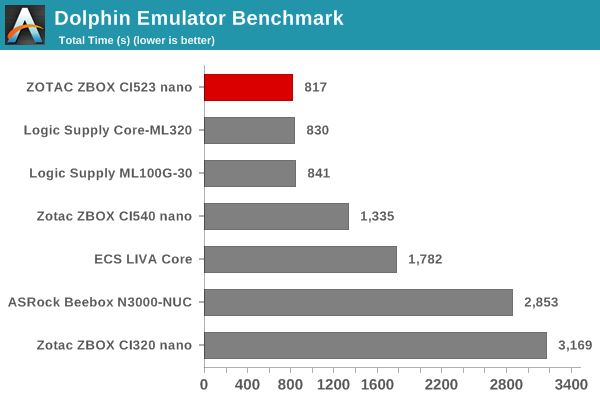
Dolphin Emulator
Wrapping up our application benchmark numbers is the Dolphin Emulator benchmark mode results. This is again a test of the CPU capabilities. Even though the ZBOX CI523 nano comes out on top, there is not much separating it from the Broadwell-U Core i5-based ML100G-30 and Haswell-U Core i5-based Core-ML320 industrial PCs from Logic Supply.
Networking and Storage Performance
Networking and storage are two major aspects which influence our experience with any computing system. This section presents results from our evaluation of these aspects in the ZOTAC ZBOX CI523 nano. On the storage side, one option would be repetition of our strenuous SSD review tests on the drive(s) in the PC. Fortunately, to avoid that overkill, PCMark 8 has a storage bench where certain common workloads such as loading games and document processing are replayed on the target drive. Results are presented in two forms, one being a benchmark number and the other, a bandwidth figure. We ran the PCMark 8 storage bench on selected PCs and the results are presented below.
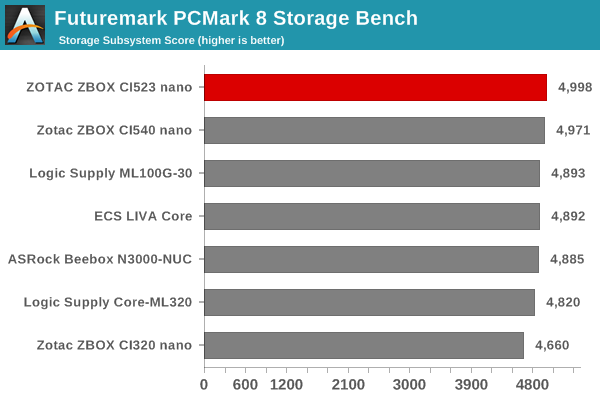
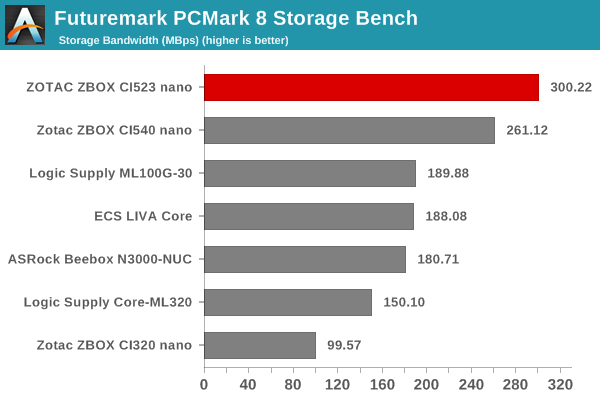
The ZBOX CI523 nano comes out on top for two reasons - none of the passively cooled PCs in the comparison list had support for M.2 SSDs, and, the Crucial MX200 500GB SSD is one of the top performers in the SATA SSD segment.
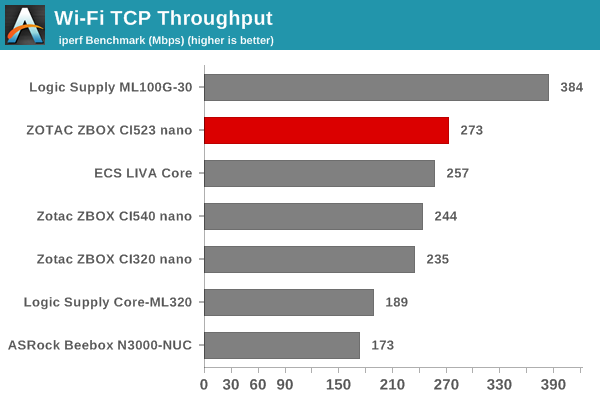
On the networking side, we restricted ourselves to the evaluation of the WLAN component. Our standard test router is the Netgear R7000 Nighthawk configured with both 2.4 GHz and 5 GHz networks. The router is placed approximately 20 ft. away, separated by a drywall (as in a typical US building). A wired client is connected to the R7000 and serves as one endpoint for iperf evaluation. The PC under test is made to connect to either the 5 GHz (preferred) or 2.4 GHz SSID and iperf tests are conducted for both TCP and UDP transfers. It is ensured that the PC under test is the only wireless client for the Netgear R7000. We evaluate total throughput for up to 32 simultaneous TCP connections using iperf and present the highest number in the graph below.
In the UDP case, we try to transfer data at the highest rate possible for which we get less than 1% packet loss.
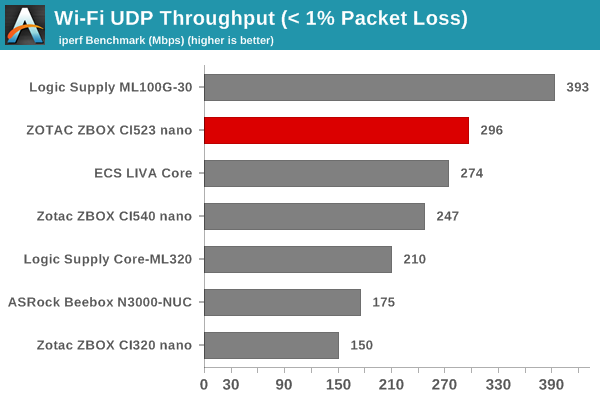
The AC3165 solution in the ZBOX CI523 nano emerges as the top performer amongst all the compared 1T1R solutions. Only the 2x2 AC7260 solution in the Logic Supply ML100G-30 manages to beat the CI523 nano in terms of raw throughput numbers.
HTPC Credentials
Given the CI523 nano's fanless nature and the presence of Intel HD Graphics 520, we expect many purchasers to use it as a media playback machine / HTPC. It is obvious that we are not looking at a madVR capable machine, but one targeted at the entry-level / average HTPC user or someone looking for a HTPC to put in a second or third room (non-primary HTPC). There are two HTPC aspects that we will explore in this section, one related to network streaming (OTT services), and the other related to local file playback. Prior to that, we have a small sub-section dealing with refresh rate accuracy.
Refresh Rate Accurancy
Starting with Haswell, Intel, AMD and NVIDIA have been on par with respect to display refresh rate accuracy. The most important refresh rate for videophiles is obviously 23.976 Hz (the 23 Hz setting). As expected, the ZOTAC ZBOX CI523 nano has no trouble with refreshing the display appropriately in this setting.

The gallery below presents some of the other refresh rates that we tested out. The first statistic in madVR's OSD indicates the display refresh rate.


Network Streaming Efficiency
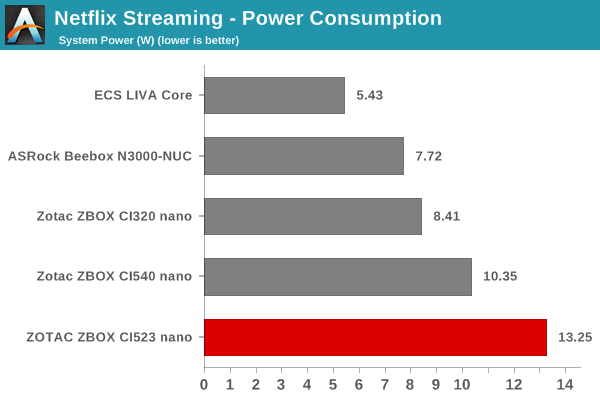
Evaluation of OTT playback efficiency was done by playing back our standard YouTube test stream and five minutes from our standard Netflix test title. Using HTML5, the YouTube stream plays back a 1080p H.264 encoding. Since YouTube now defaults to HTML5 for video playback, we have stopped evaluating Adobe Flash acceleration. Note that only NVIDIA exposes GPU and VPU loads separately. Both Intel and AMD bundle the decoder load along with the GPU load. The following two graphs show the power consumption at the wall for playback of the HTML5 stream in Mozilla Firefox (v 49.0.1). The numbers show that the CI523 nano is not exactly a power efficient platform for OTT streaming.
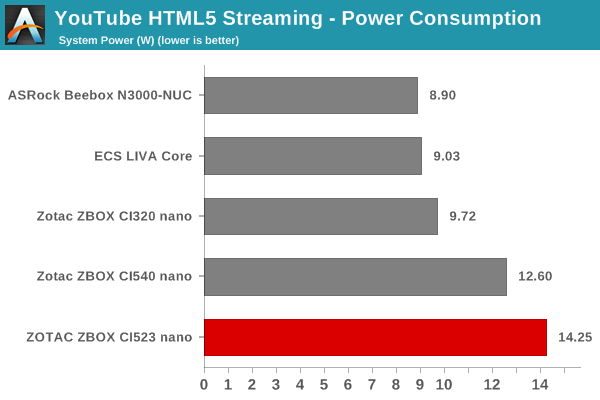
GPU load was around 24.15% for the YouTube HTML5 stream and 0.0181% for the steady state 6 Mbps Netflix streaming case.
Netflix streaming evaluation was done using the Windows 10 Netflix app. Manual stream selection is available (Ctrl-Alt-Shift-S) and debug information / statistics can also be viewed (Ctrl-Alt-Shift-D). Statistics collected for the YouTube streaming experiment were also collected here.
Decoding and Rendering Benchmarks
In order to evaluate local file playback, we concentrate only on Kodi 16.1 with default settings. We already know that EVR works quite well even with the Intel IGP for our test streams. In our earlier reviews, we focused on presenting the GPU loading and power consumption at the wall in a table (with problematic streams in bold). Starting with the Broadwell NUC review, we decided to represent the GPU load and power consumption in a graph with dual Y-axes. Nine different test streams of 90 seconds each were played back with a gap of 30 seconds between each of them. The characteristics of each stream are annotated at the bottom of the graph. Note that the GPU usage is graphed in red and needs to be considered against the left axis, while the at-wall power consumption is graphed in green and needs to be considered against the right axis.
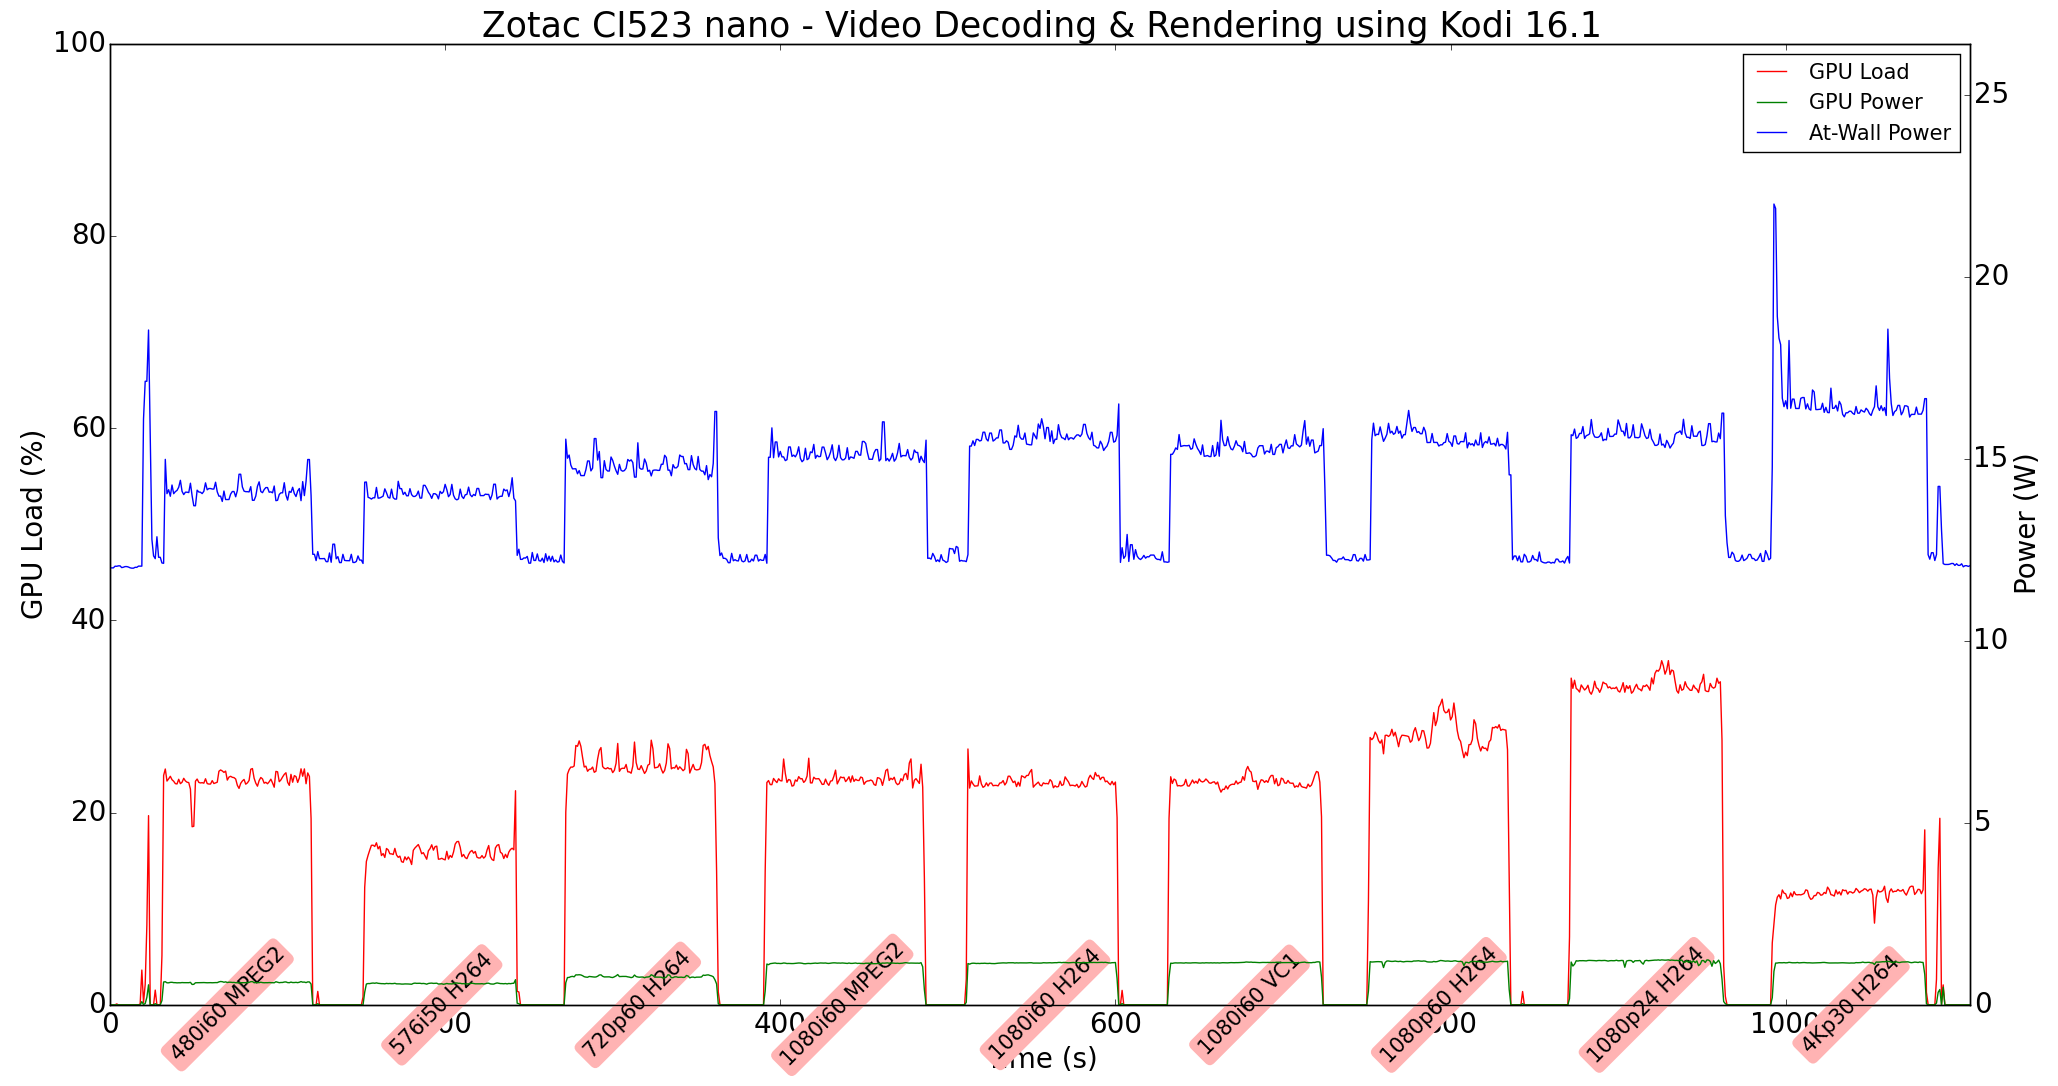
Frame drops are evident whenever the GPU load consistently stays above the 85 - 90% mark. However, the Zotac ZBOX CI523 nano has no trouble with our video benchmarking suite (as has become customary with all the mini-PCs that we have evaluated this year). Our suite is yet to integrate HEVC clips, but, we can get an idea of the decoding capabilities of the CI523 nano with the help of DXVA Checker.
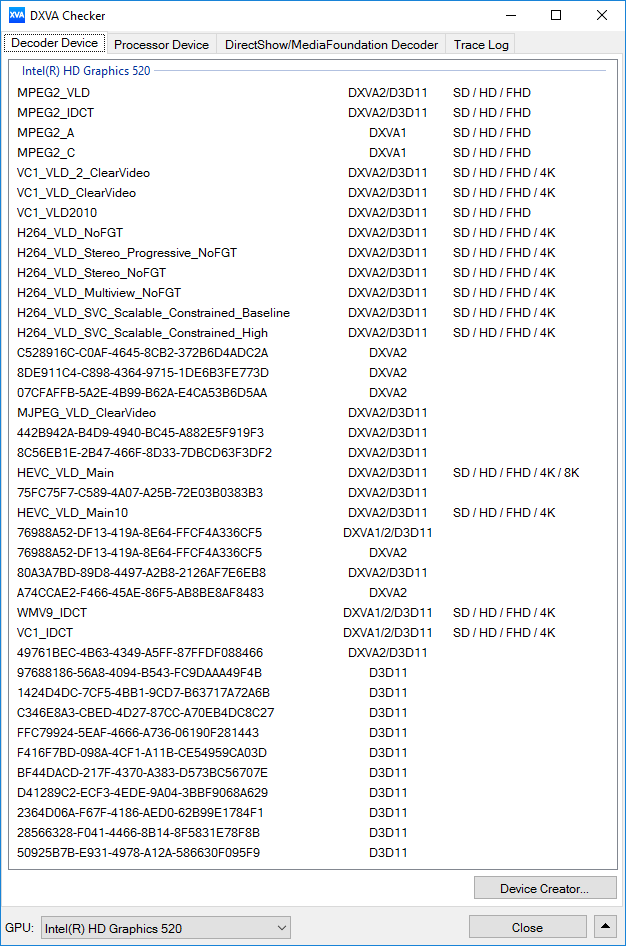
Intel has already disclosed that the HEVC_VLD_Main10 10b decoding support in Skylake is hybrid in nature. If decoding such streams is a primary use-case, then, it is suggested that a more powerful PC be utilized. For most common 1080p use-cases, the ZBOX CI523 nano is more than sufficient. However, it must be noted that the Skylake-U ZBOX C-Series doesn't have HDMI 2.0 / HDCP 2.2 / 4Kp60 capabilities, and, as such, this lineup is not meant for entertainment use-cases involving modern 4K home theater equipment.
Power Consumption and Thermal Performance
The power consumption at the wall was measured with a 1080p display being driven through the HDMI port. In the graphs below, we compare the idle and load power of the ZOTAC ZBOX CI523 nano with other low power PCs evaluated before. For load power consumption, we ran the AIDA64 System Stability Test with various stress components, as well as our custom Prime95 + Furmark stress test, and noted the maximum sustained power consumption at the wall.
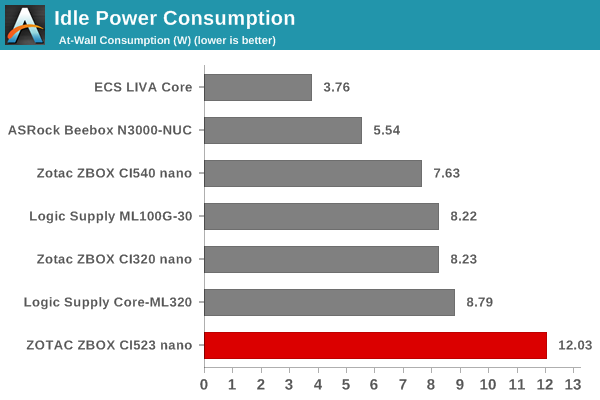
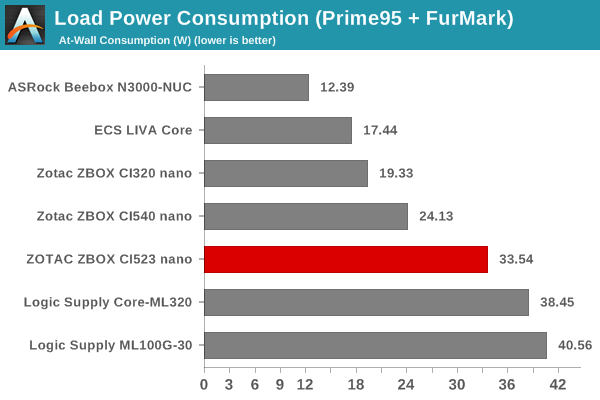
As we saw earlier in the HTPC Credentials section, the CI523 nano configuration being evaluated is not the most power-efficient. Idle power is the worst amongst all considered system, possibly due to BIOS defaults not allowing the system to move into a low-power state. A part of the blame might also lie in our choice of components for the build (high-performance RAM and SSD).
We adopt two different thermal stress testing routines - one involving the AIDA64 System Stability Test (SST), and the other custom one using a combination of Prime95 and Furmark. The AIDA64 SST routine starts with the system at idle, followed by four stages of different system loading profiles (each of 30 minutes duration). In the first stage, we stress the CPU, caches and RAM. In the second stage, we add the GPU to the above list. In the third stage, we stress the GPU standalone. In the final stage, we stress all the system components (including the disks). Beyond this, we leave the unit idle in order to determine how quickly the various temperatures in the system can come back to normal idling range. The second routine (custom stress testing) loads up Prime 95 for 30 minutes, followed by Furmark for 30 minutes. The Prime 95 load is then removed, allowing just the GPU alone to be stressed for 30 minutes. The system is then left idle.
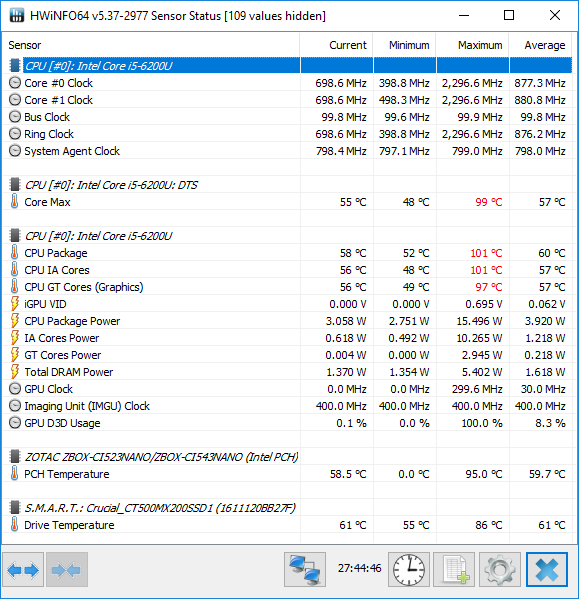
In order to set the stage for a discussion of the thermal stress testing results, a recount of our experience with the review unit out-of-the-box is necessary. The sample shipped with BIOS Version 2K160613 and we did our first round of testing with that BIOS. In the middle of our stress tests, the Wi-Fi connection dropped out and our remote monitoring script couldn't keep track of the various internal parameters. Fortunately, the at-wall power consumption measurement was still active, and HWiNFO had a record of the maximum values of the internal parameters during the course of the stress test. It showed that the CPU package temperature reached as high as 101C, and the unit had thermally throttled.
Zotac ZBOX CI523 nano - Custom Stress Test Results with BIOS Version 2K160613
Zotac indicated that the issue had been resolved in a BIOS update, and that our stress testing would pass with BIOS Version 2K160902 (which had changed some thermal parameters). A detailed look at the various parameters during the course of our stress tests with the new BIOS is presented further down, but, we were curious about the implications of the changed thermal parameters. To understand this, we plotted the at-wall power consumption during the course of our custom stress test with the two BIOS versions.
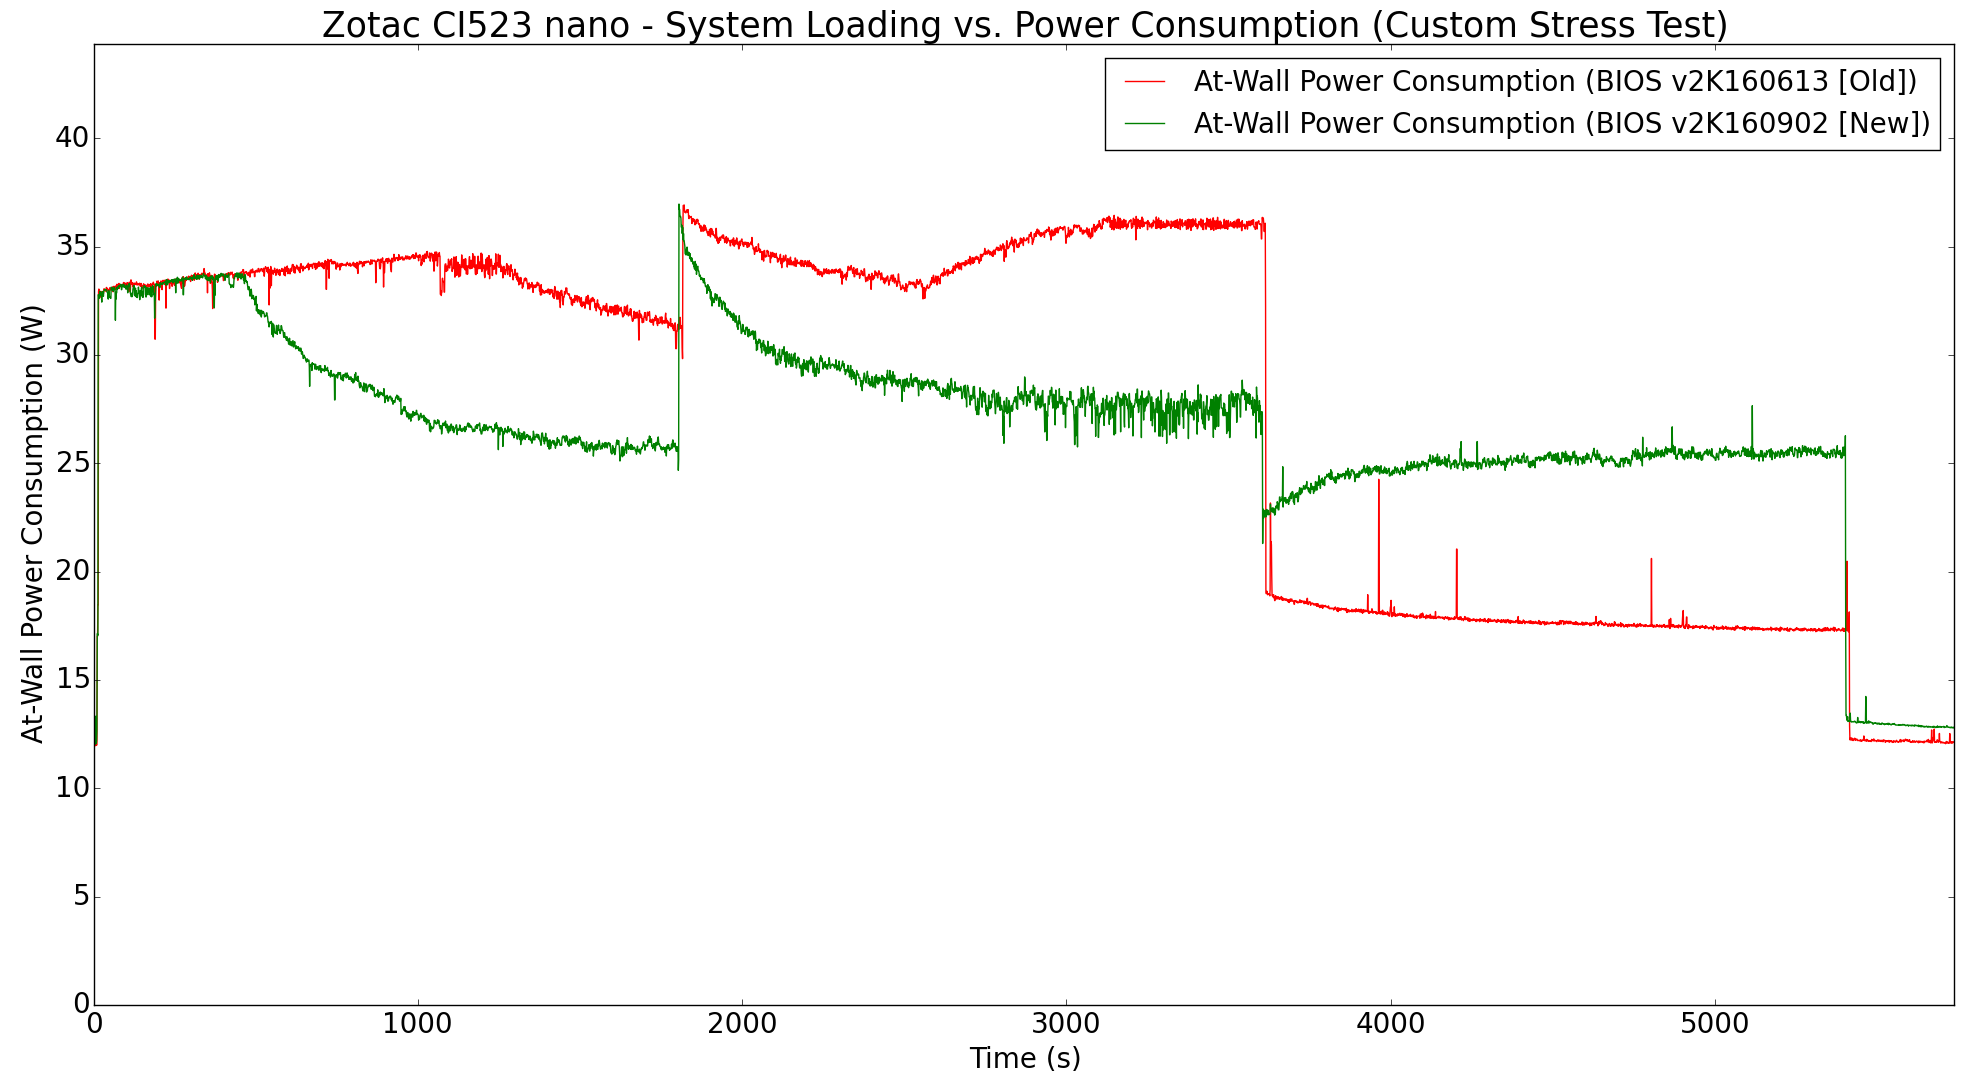
It is clear that the changed thermal parameters has an effect on the performance of the PC under sustained loading conditions. While the old BIOS had the PC sustaining more than 35W at the wall with dangerous package temperatures, the new BIOS can only sustain around 28W under the same conditions. The at-wall power numbers are directly related to the CPU package power, as we will see in the graphs below.
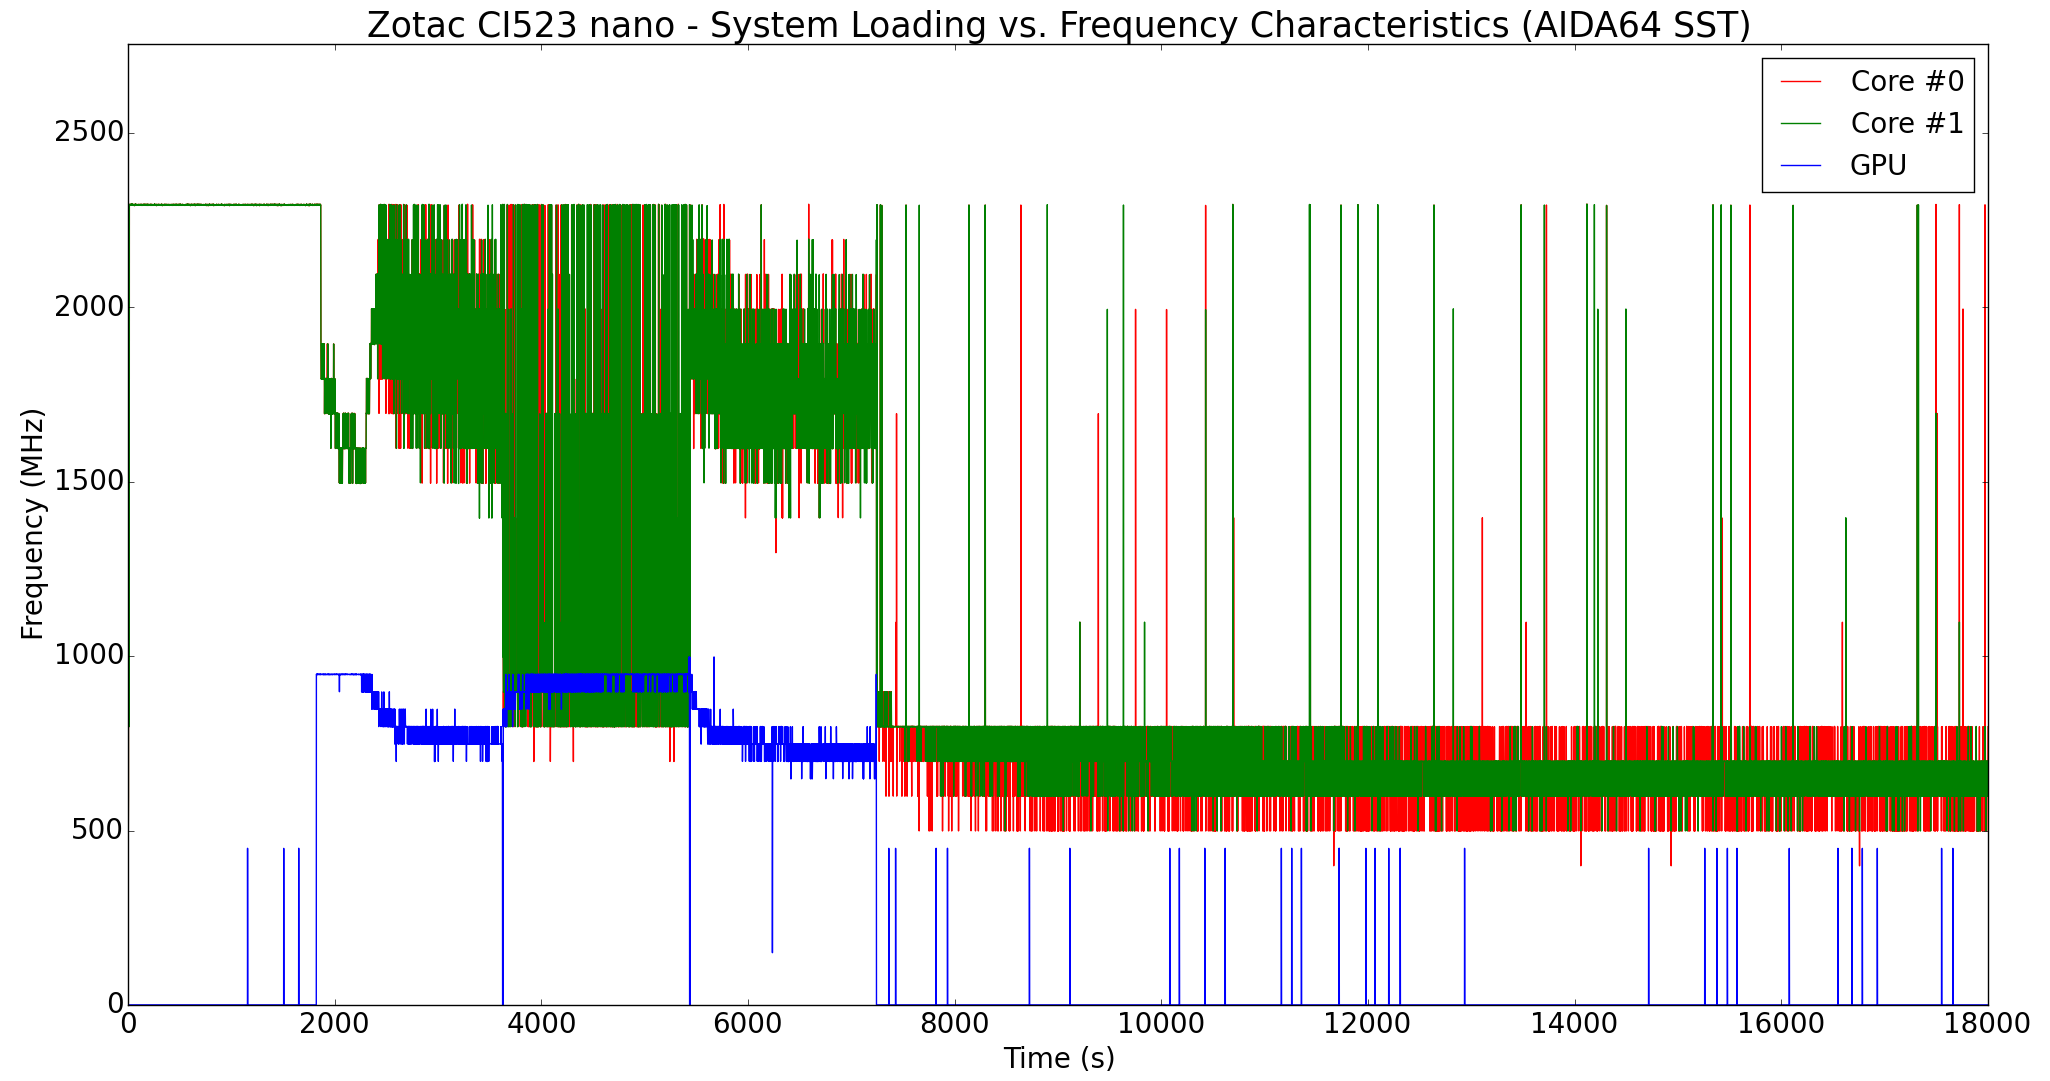
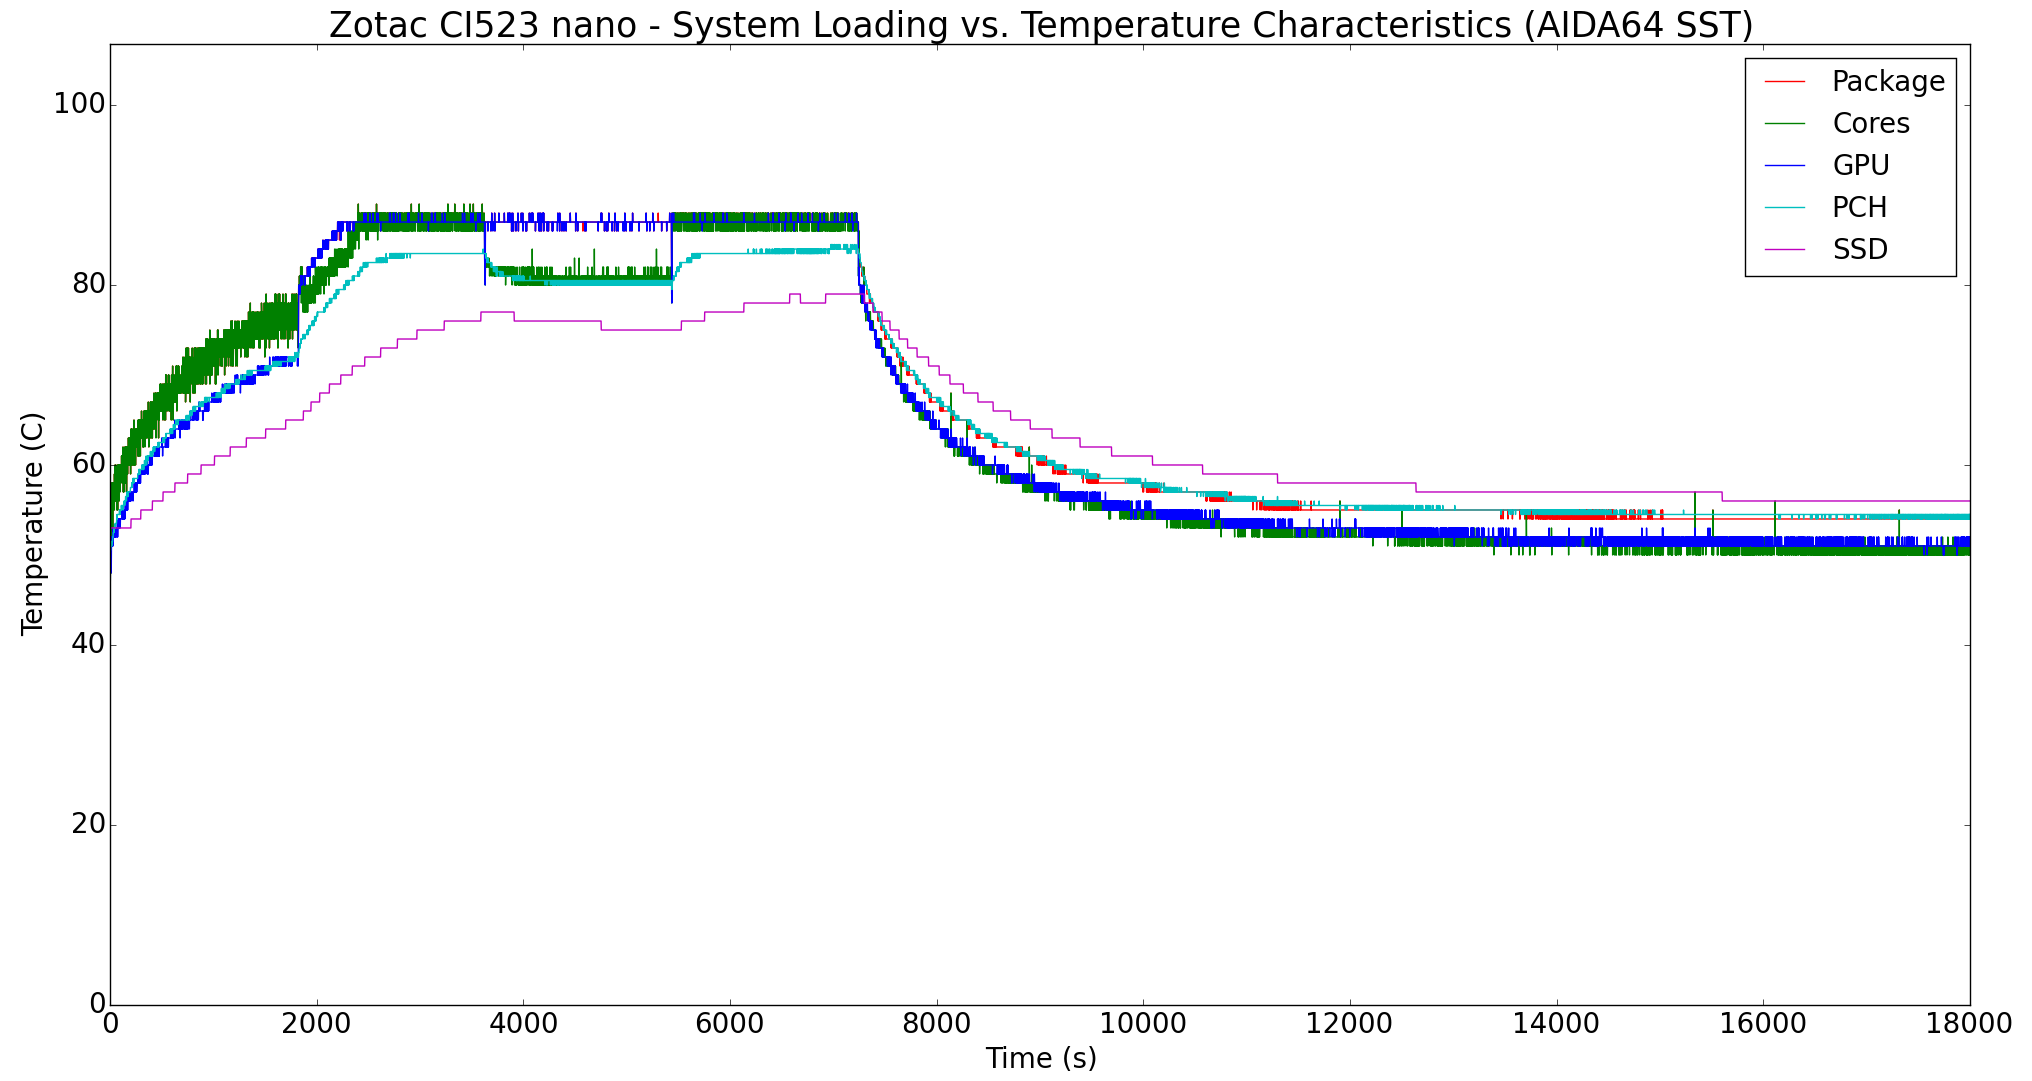
The various clocks, temperatures and power consumption numbers for the system during the AIDA64 SST routine are presented in the graphs below. The cores are able to sustain the maximum 2.3 GHz frequency over the duration of the CPU / RAM stress. Once the GPU comes into play, the cores move to around 1.6 GHz while the GPU pegs away at 900 MHz for sometime before the thermal parameters come into play. When the package temperature reaches 88 C, the GPU clock starts dropping down to around 750 MHz. In the pure GPU stress segment, the cores shift between 800 MHz and 2.6 GHz, while the GPU manages to sustain at the maximum frequency despite its temperature being close to 90 C. However, the cores cool down a little giving the package temperature a little head room. Once the disk stress is added, it is back to throttling both the CPU and GPU clocks while maintaining the package temperature close to 90 C.

The power consumption numbers for various components help in deeper analysis, as the thermal parameters in the new BIOS just ensure that the package power consumption is throttled to keep the unit operating in a safe manner. In the above graph, we can see that the 15W package power consumption can only be sustained for around 10 minutes before it needs to be throttled down to around 12W.
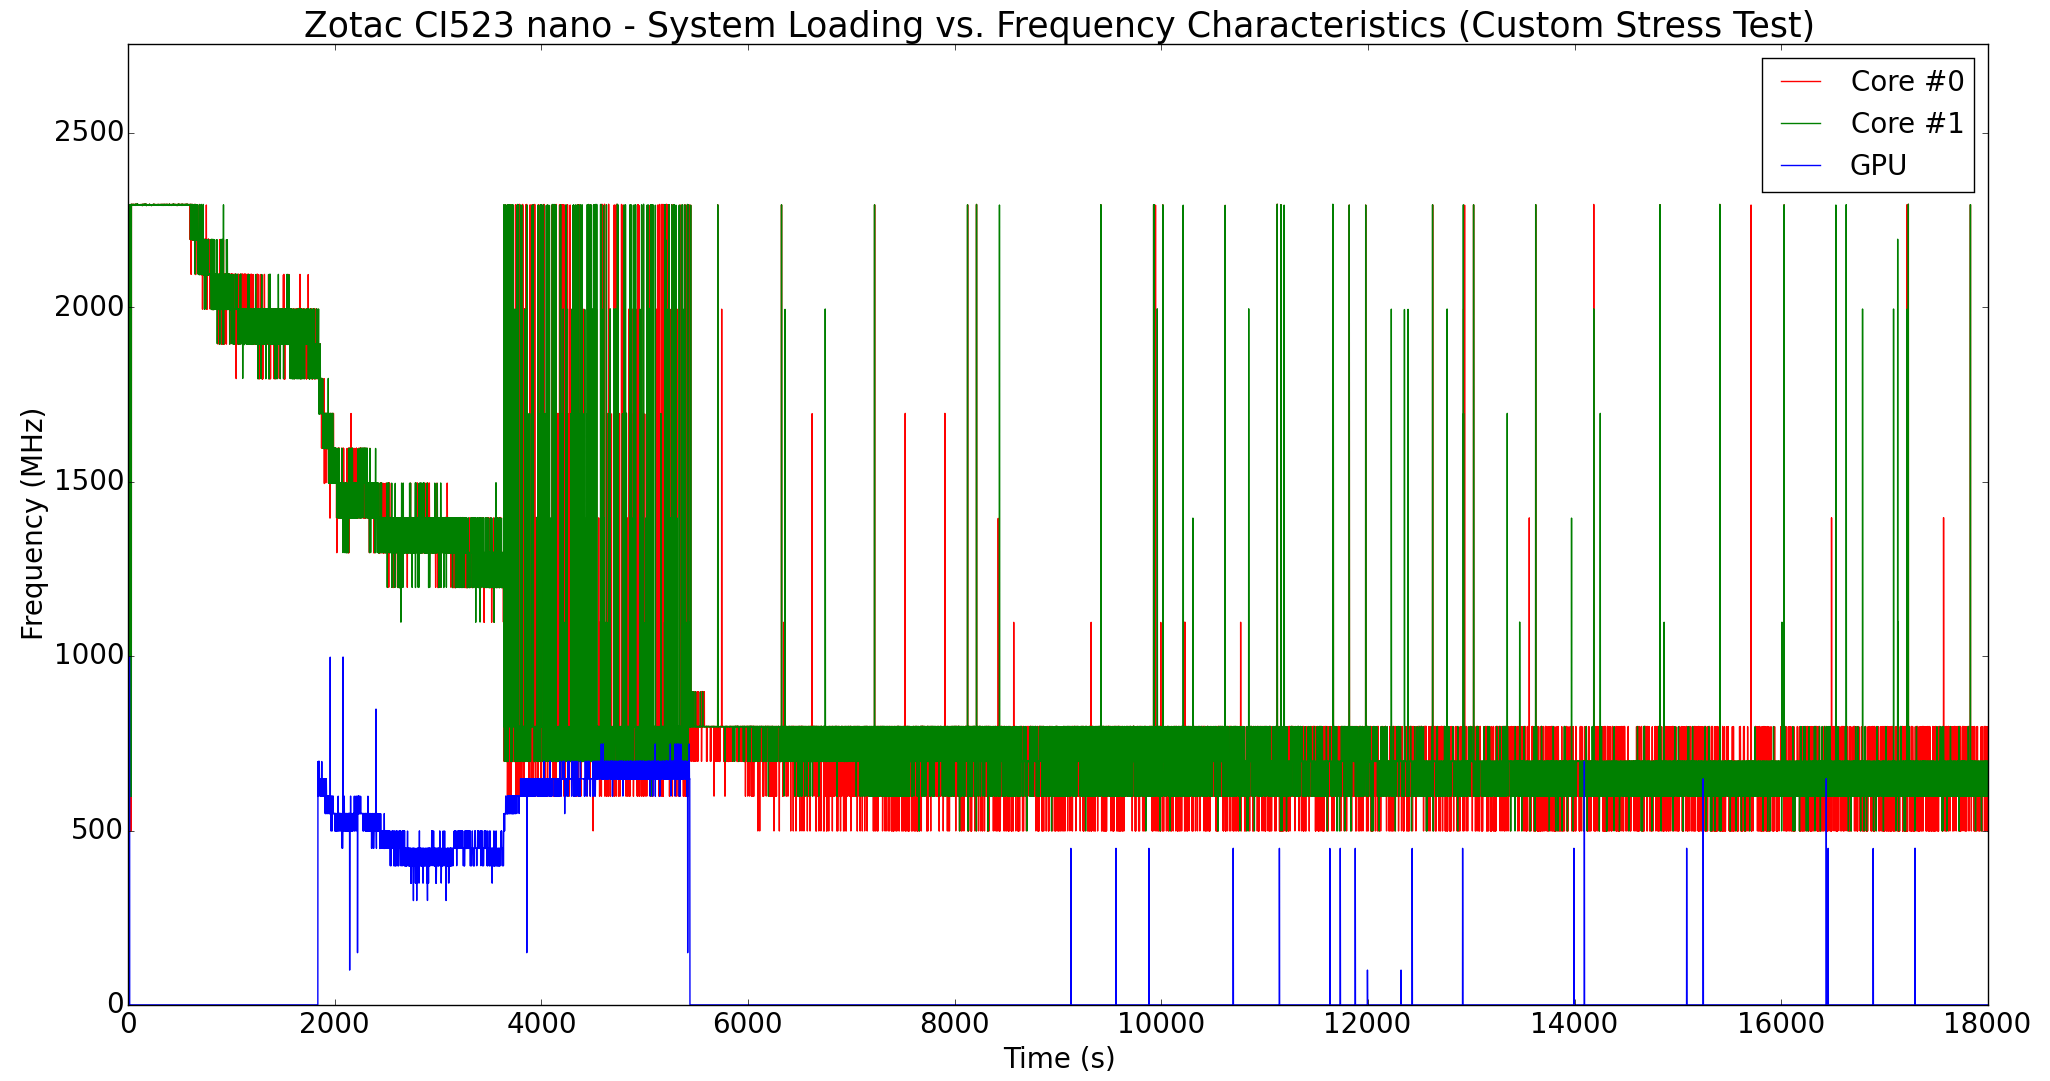
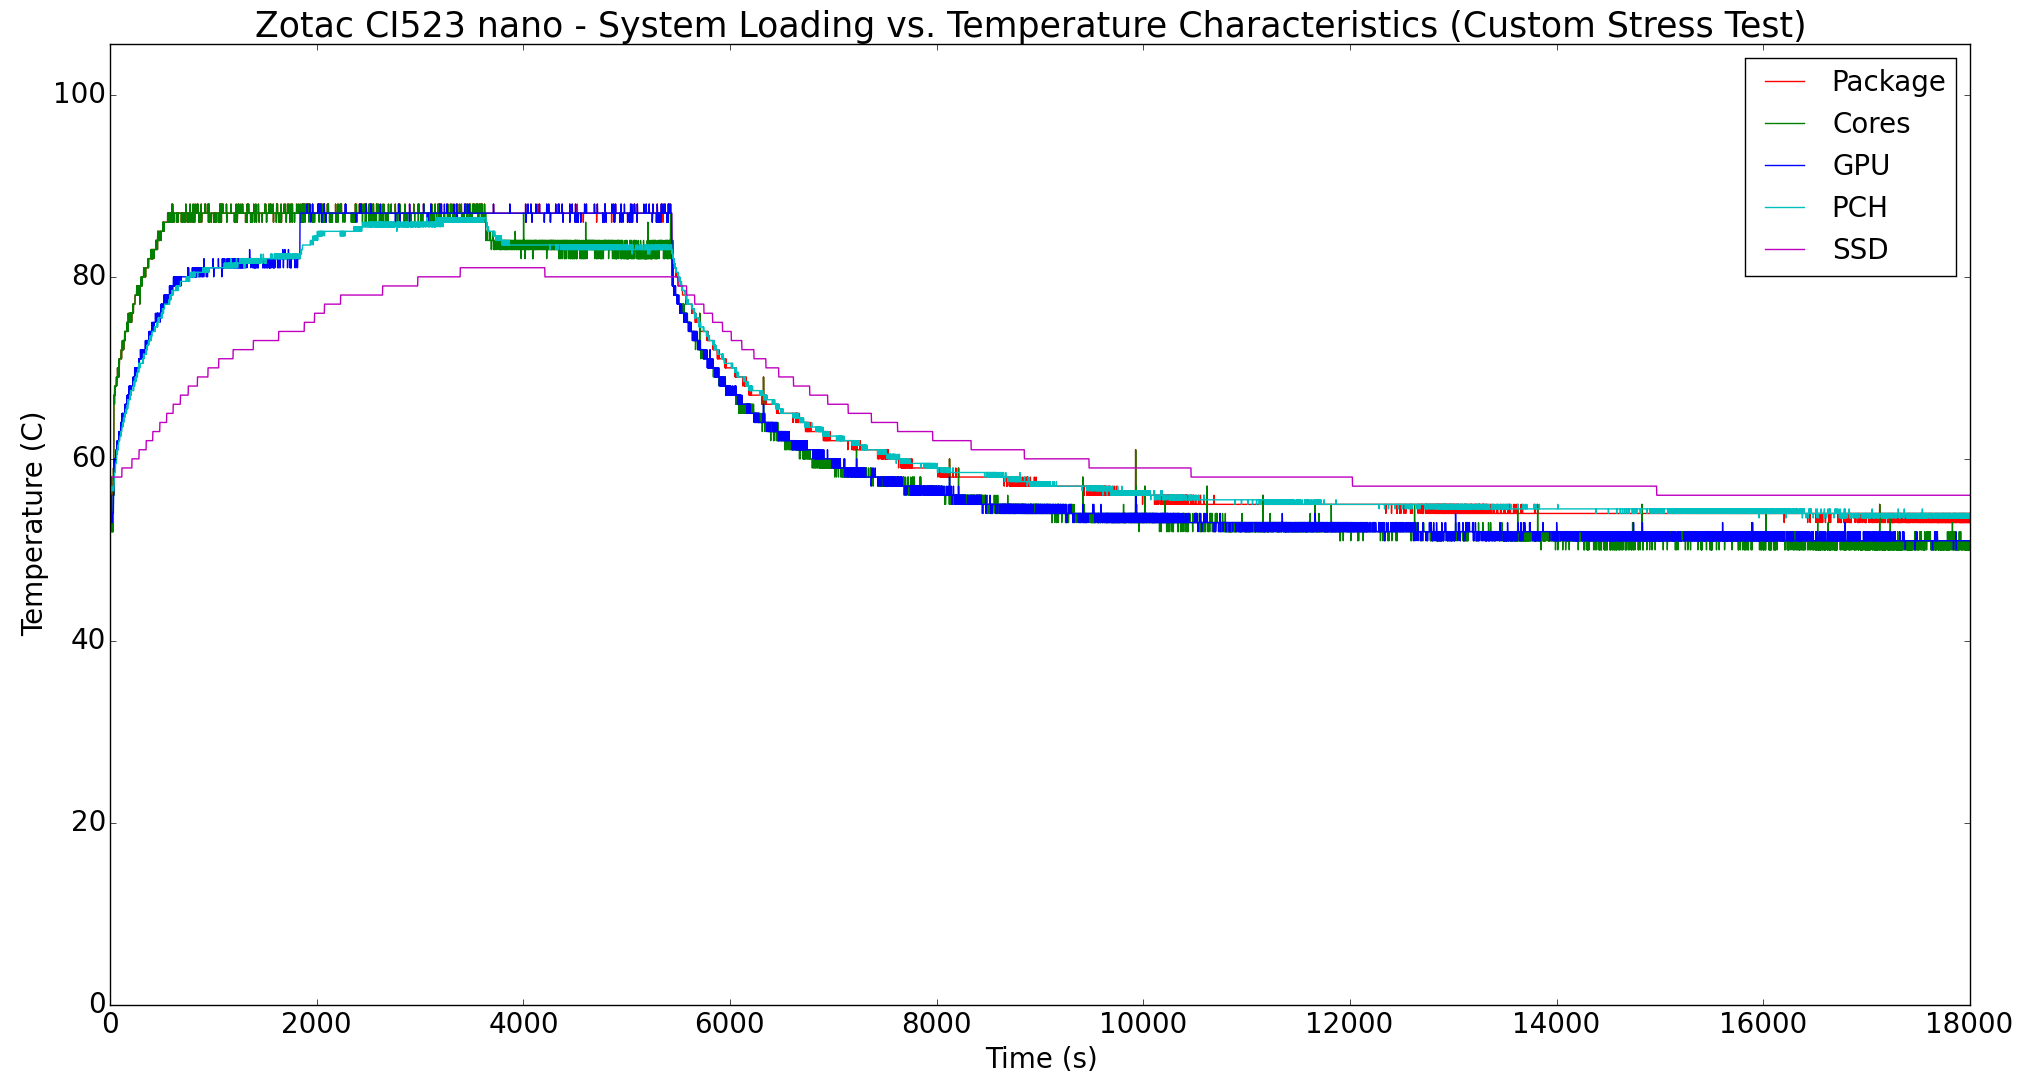
The same set of parameters were also recorded during the course of our custom stress test. Hitting the 90 C thermal parameter is faster in this routine, as it happes around 10 minutes into our CPU stress segment itself. An interesting aspect here is that the GPU stress by Furmark keeps the GPU clocks around 700 MHz, while the AIDA64 SST could keep it at 900 MHz while being within the safe temperature parameters dictated by the BIOS. One of the unfortunate aspects here is that the SSD temperature reaches as high as 80 C even when there is no disk stress routine.
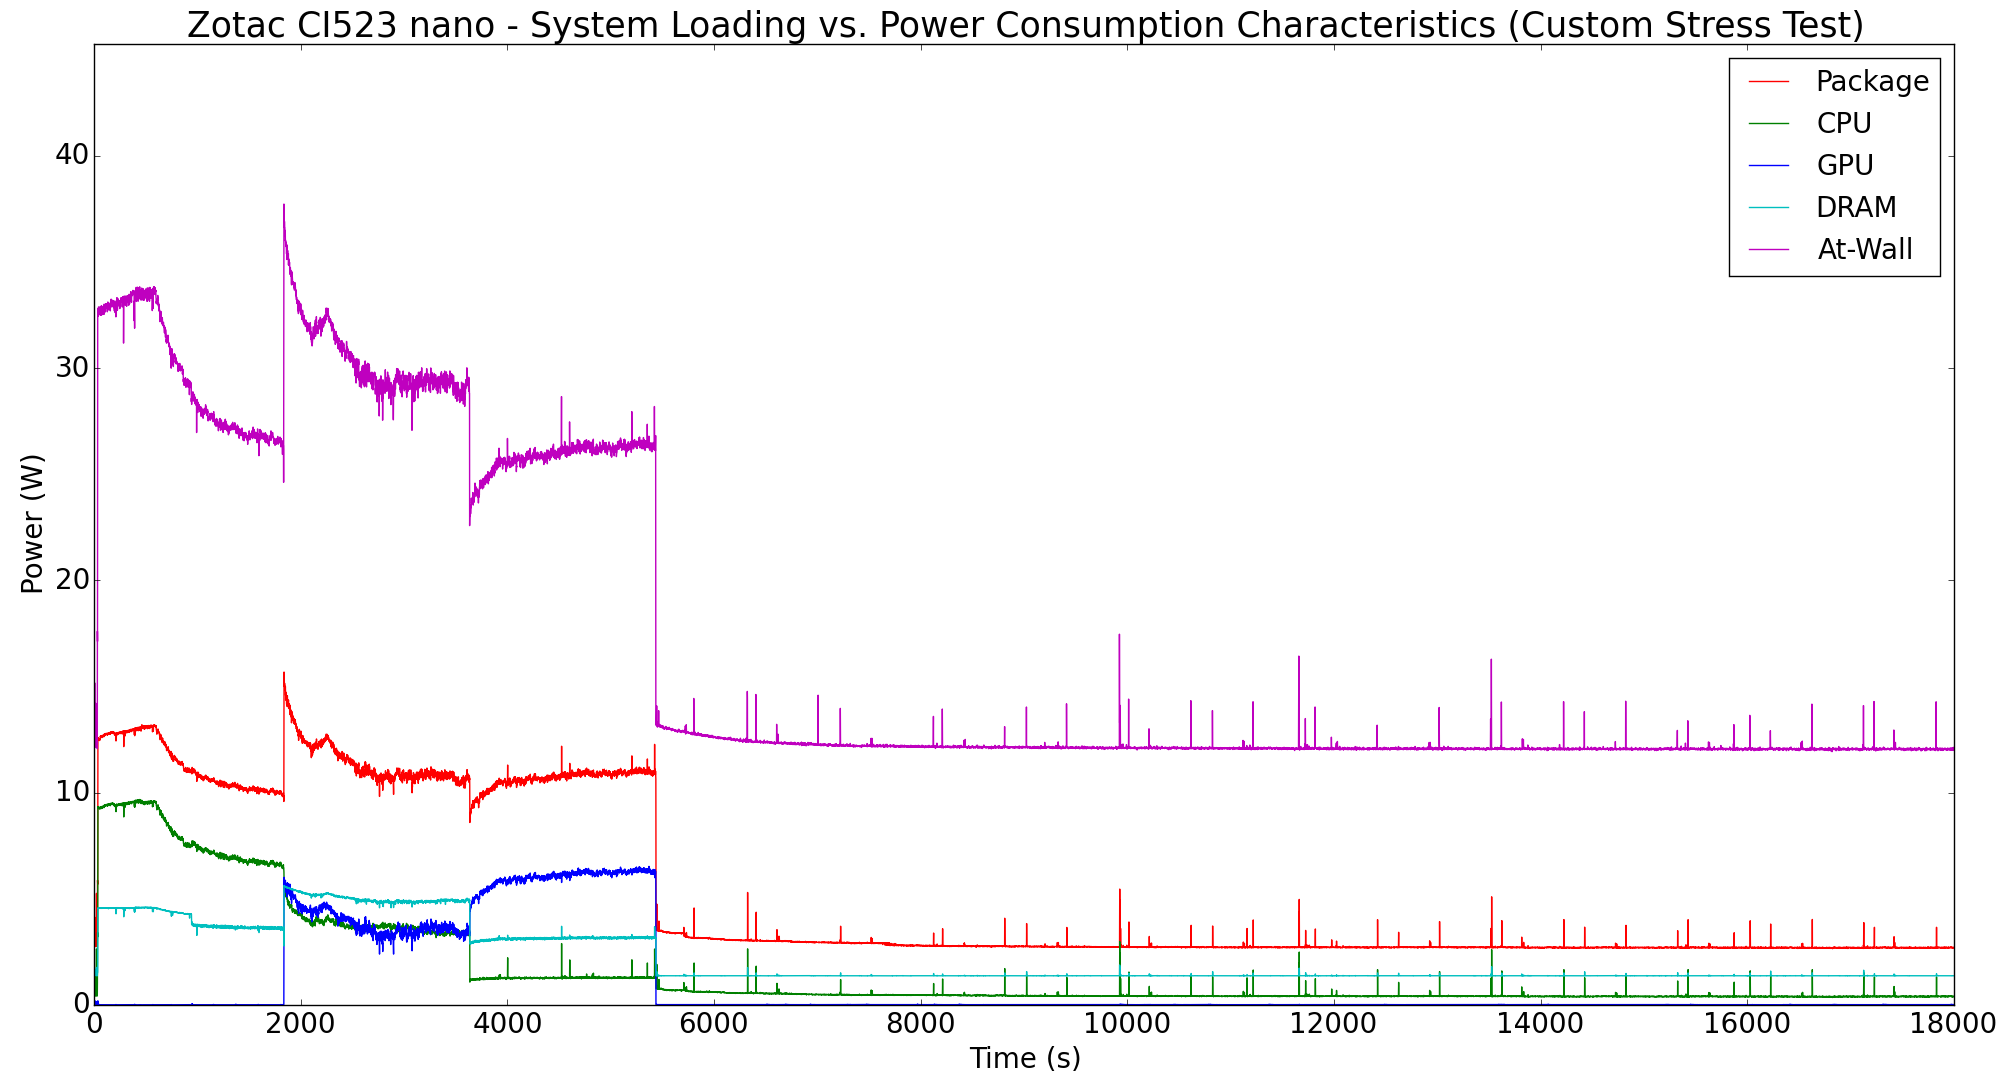
The power consumption numbers also show what we observed in the AIDA64 SST case. The thermal design of the Zotac ZBOX CI523 nano can't sustain a 15W TDP CPU for more than 10 minutes at full load. That said, it seems to be quite effective for a 12W scenario. In any case, the latest BIOS definitely resolves any overheating concerns and the CPU manages to remain below the junction temperature irrespective of the applied stress.
Another important aspect to keep note of while evaluating fanless PCs is the chassis temperature. Using the Android version of the FLIR One thermal imager, we observed the chassis temperature after the CPU package temperature reached the steady state value in the above graph.
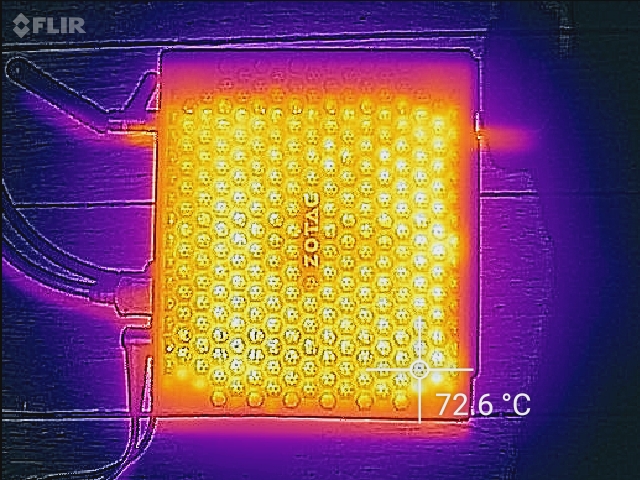
We have additional thermal images in the gallery below.


The images show that certain parts of the chassis can reach temperatures of around 73 C. This is on par with what we have seen in other passively cooled PCs subject to our thermal stress testing routines.
Miscellaneous Aspects and Concluding Remarks
System vendors have managed to find various ways to differentiate their Skylake-U mini-PCs from the reference Intel NUC design. ASRock's Skylake-U Beebox has a more compact footprint, while the GIGABYTE Skylake-U BRIX series services a wide range of use-cases with multiple models. Zotac is relying on the fanless nature of the C-series units for differentiation. Some internal system design aspects such as the combination of PCIe peripherals and the OPI link rate can also help vendors in differentiating their Skylake-U systems. The OPI link rate is not a big factor in the Zotac ZBOX CI523 nano because there is no support for PCIe NVMe SSDs that can saturate the link. However, the PCIe peripherals aspect deserves further investigation.
Compared to the standard Skylake-U Intel NUC, Zotac has two extra USB ports. These are of the USB 3.1 Gen 2 variety, and are enabled by an ASMedia ASM1142 bridge chip. It is connected to the PCH via a PCIe 3.0 x1 link. This is in contrast to the GIGABYTE GB-BSi7HAL-6500, where a x2 uplink was used. Zotac has configured the other side of the bridge chip to provide two Type-C USB 3.1 Gen 2 port in the front panel. The x1 uplink could potentially limit the simultaneous bandwidth availability. To evaluate this, we connected the Netac Z5 and the SanDisk Extreme 900 to the system at the same time. In the first pass, we ran the sequential read and writes (queue depth of 1) one after the other. In the second pass, we triggered the QD32 sequential tests on both units at the same time.
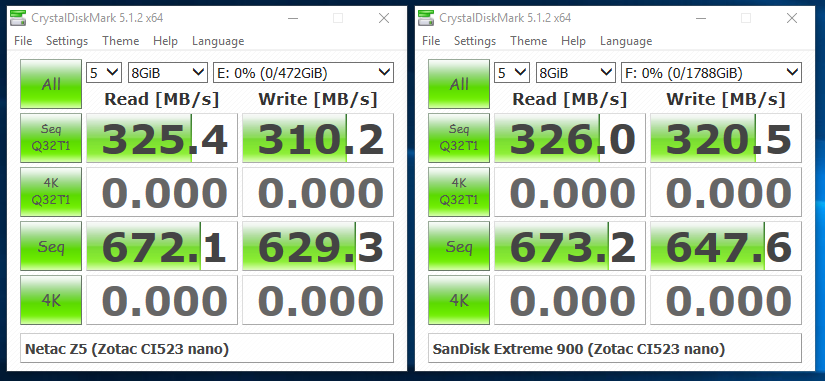
Compared to the x2 uplink that could support more than 800 MBps of traffic in the GIGABYTE BRIX, we see that the ZBOX is able to support only around 650 MBps.
In terms of scope for improvement, the uplink configuration for the ASM1142 bridge chip definitely needs to be revisited. It is not clear why a x1 link was chosen when there is no paucity of HSIO lanes from the PCH. Additionally, we would have liked a 1x Type-A + 1x Type-C configuration in the front panel for the two USB 3.1 Gen 2 ports, instead of the 2x Type-C that has been implemented by Zotac. On the topic of 'external features', a compact wall-wart adapter (similar to the one supplied with the Skylake-U NUCs) would be a better option compared to the power brick that is currently supplied with the unit.
On the memory and storage side, we are not going to complain about the DDR3L-only and 2.5" SATA drive-only restriction. The ZBOX CI523 nano is not meant to be a performance powerhouse like, say, the MAGNUS EN980 gaming PC. The restriction of the memory and storage choices to 'legacy' components ensures that the build can turn out to be an affordable one.
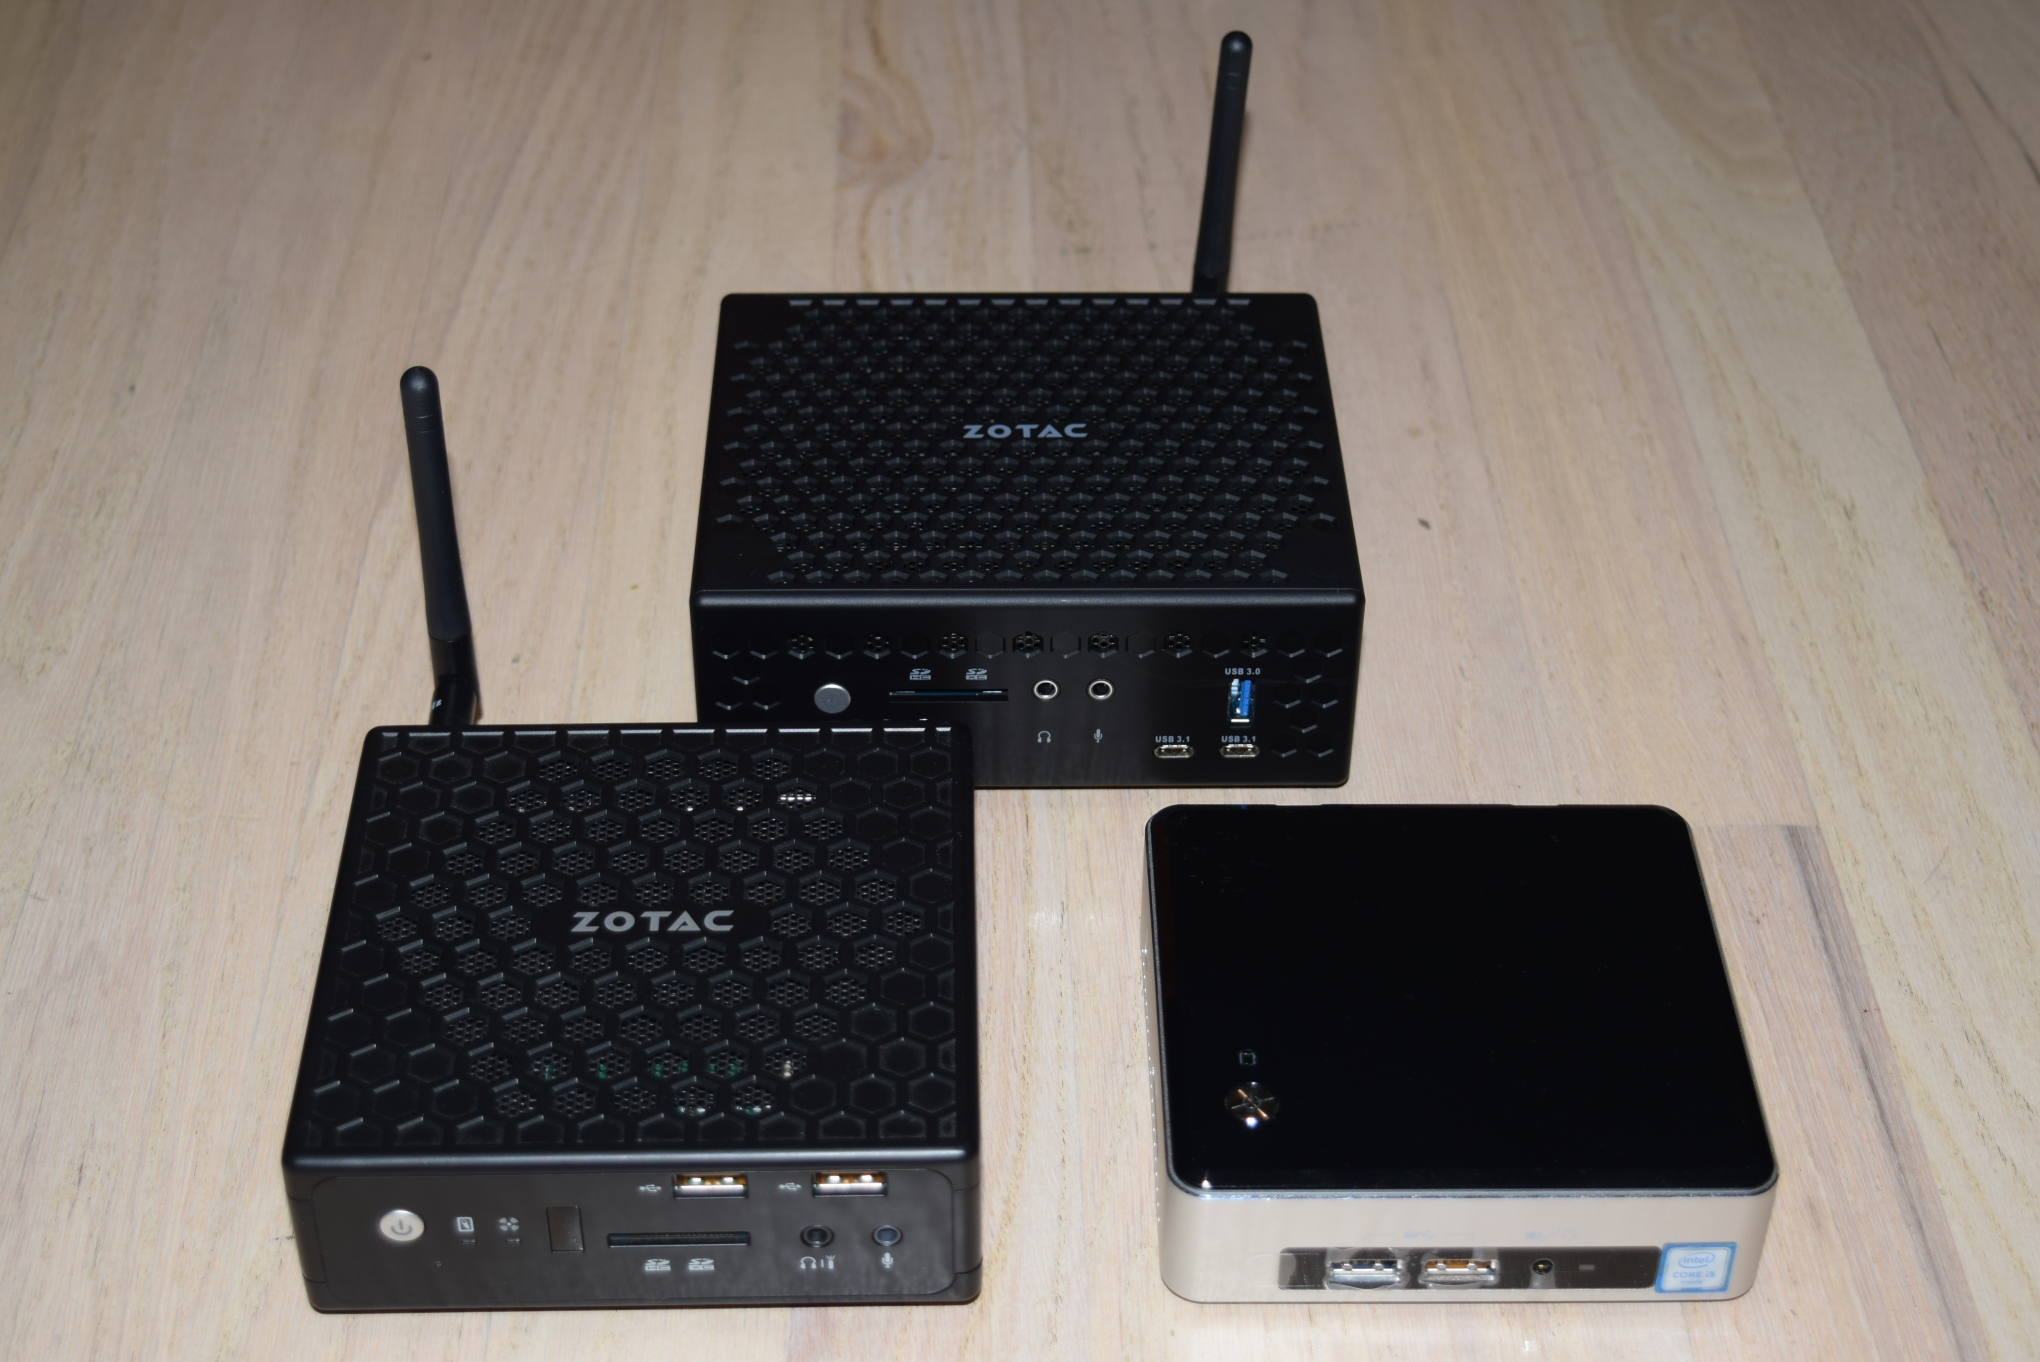
Zotac ZBOX CI523 nano (top) - Size comparison against the first-generation ZBOX C-series (bottom left) and the NUC6i5SYK (M.2 SSD only) (bottom right)
Zotac should also have a better and more user-friendly way to update the BIOS similar to Intel's method for the NUCs (a Windows executable can handle everything). Failing that, it could at least offer the ability to update the BIOS directly from the BIOS interface (by placing the BIOS update in a USB key and booting into the BIOS). Their current scheme involves using a DOS boot disk with the update loaded into it. This method is acceptable for power users, but not for Zotac's target market with the C-series PCs.
The Achilles heel of the ZBOX CI523 nano is its thermal design. Taken standalone, the various components - the honeycomb mesh chassis, the substantial heat sink, the metal plate and thermal pads for the user-replaceable RAM and 2.5" drive - make a very good set of building blocks for an effective fanless PC. Unfortunately, the whole turns out to be lesser than the sum of the parts. The full configuration is able to sustain a 15W load for only 10 minutes. The sustained load capacity of around 12W is lesser than the TDP of the Core i3-6100U used in the system. The presence of a metal plate at the bottom of the chassis is not really conducive for convective heat dissipation. In fact, it gets quite hot - more than 65C - even without significant loading on the components attached to it. The 2.5" drive heats up more than one would like because of this. The heat sink on top of the SiP covers the whole motherboard, but, there is no airflow from the bottom to the top to aid in the cool-down process. Fortunately, we at least have the mesh on top of the heatsink and lots of ventilation on at either side of it to alleviate the issues to a small extent. Zotac needs to definitely tweak the thermal design in order to be able to support sustained loading of a 15W TDP CPU in the system. We hope the next iteration / generation can fix this aspect.
The final aspect of discussion is the pricing - $320 on Amazon currently. Given the premium associated with fanless computing systems, it is not surprising to see the Zotac ZBOX CI523 nano priced $40 more than the corresponding Intel NUC6i3SYH. The price to performance ratio for the CI523 nano is praiseworthy when compared against other passively cooled PCs that we have evaluated over the last few years. The ZBOX is also able to provide two additional USB 3.1 Gen 2 Type-C ports, but loses out on the benefits from DDR4 and M.2 SSD support. These would appear to be fair trade-offs, but, we are a bit peeved that the Core i3-6100U in the CI523 nano can't operate at its maximum possible performance under sustained loading conditions. Given this drawback, achieving price parity with the NUC6i3SYH could be a reasonable way for Zotac to make the ZBOX CI523 nano more attractive to the consumers.


