Original Link: https://www.anandtech.com/show/12625/amd-second-generation-ryzen-7-2700x-2700-ryzen-5-2600x-2600
The AMD 2nd Gen Ryzen Deep Dive: The 2700X, 2700, 2600X, and 2600 Tested
by Ian Cutress on April 19, 2018 9:00 AM EST
With 2017 finished, and Ryzen being very successful for AMD, the inevitable question was due: what happens next? Early in 2018, the plans were laid bare: a second generation Ryzen processor was set to come in mid-year, followed by a second generation Threadripper, using GlobalFoundries’ 12nm process. This is not AMD’s next big microarchitecture, which we know is called Zen 2 on 7nm, but an opportunity to launch a wave of components with minor improvements and take advantage of a manufacturing process that gives more frequency and more performance. Today AMD is launching four CPUs, and we have tested them all.
Updates
- (4/21) Some of our results, initially thought due to Spectre/Meltdown patches, were not in line with others. Testing audit was started.
- (4/25) Our extensive internal audit showed reasons for the differences, as documented in detail in this follow-up article. In short, an issue with a non-standard use timers on Windows was causing the performance of both AMD and Intel processors to dip, particularly impacting the latter.
- (5/2) Benchmark results have been updated.
- (5/22) X470 Motherboard. StoreMI, and Power Analysis pages updated.
- (5/26) Conclusion Updated, Performance Per Dollar graphs added.
Straight To The Scene: The New CPUs
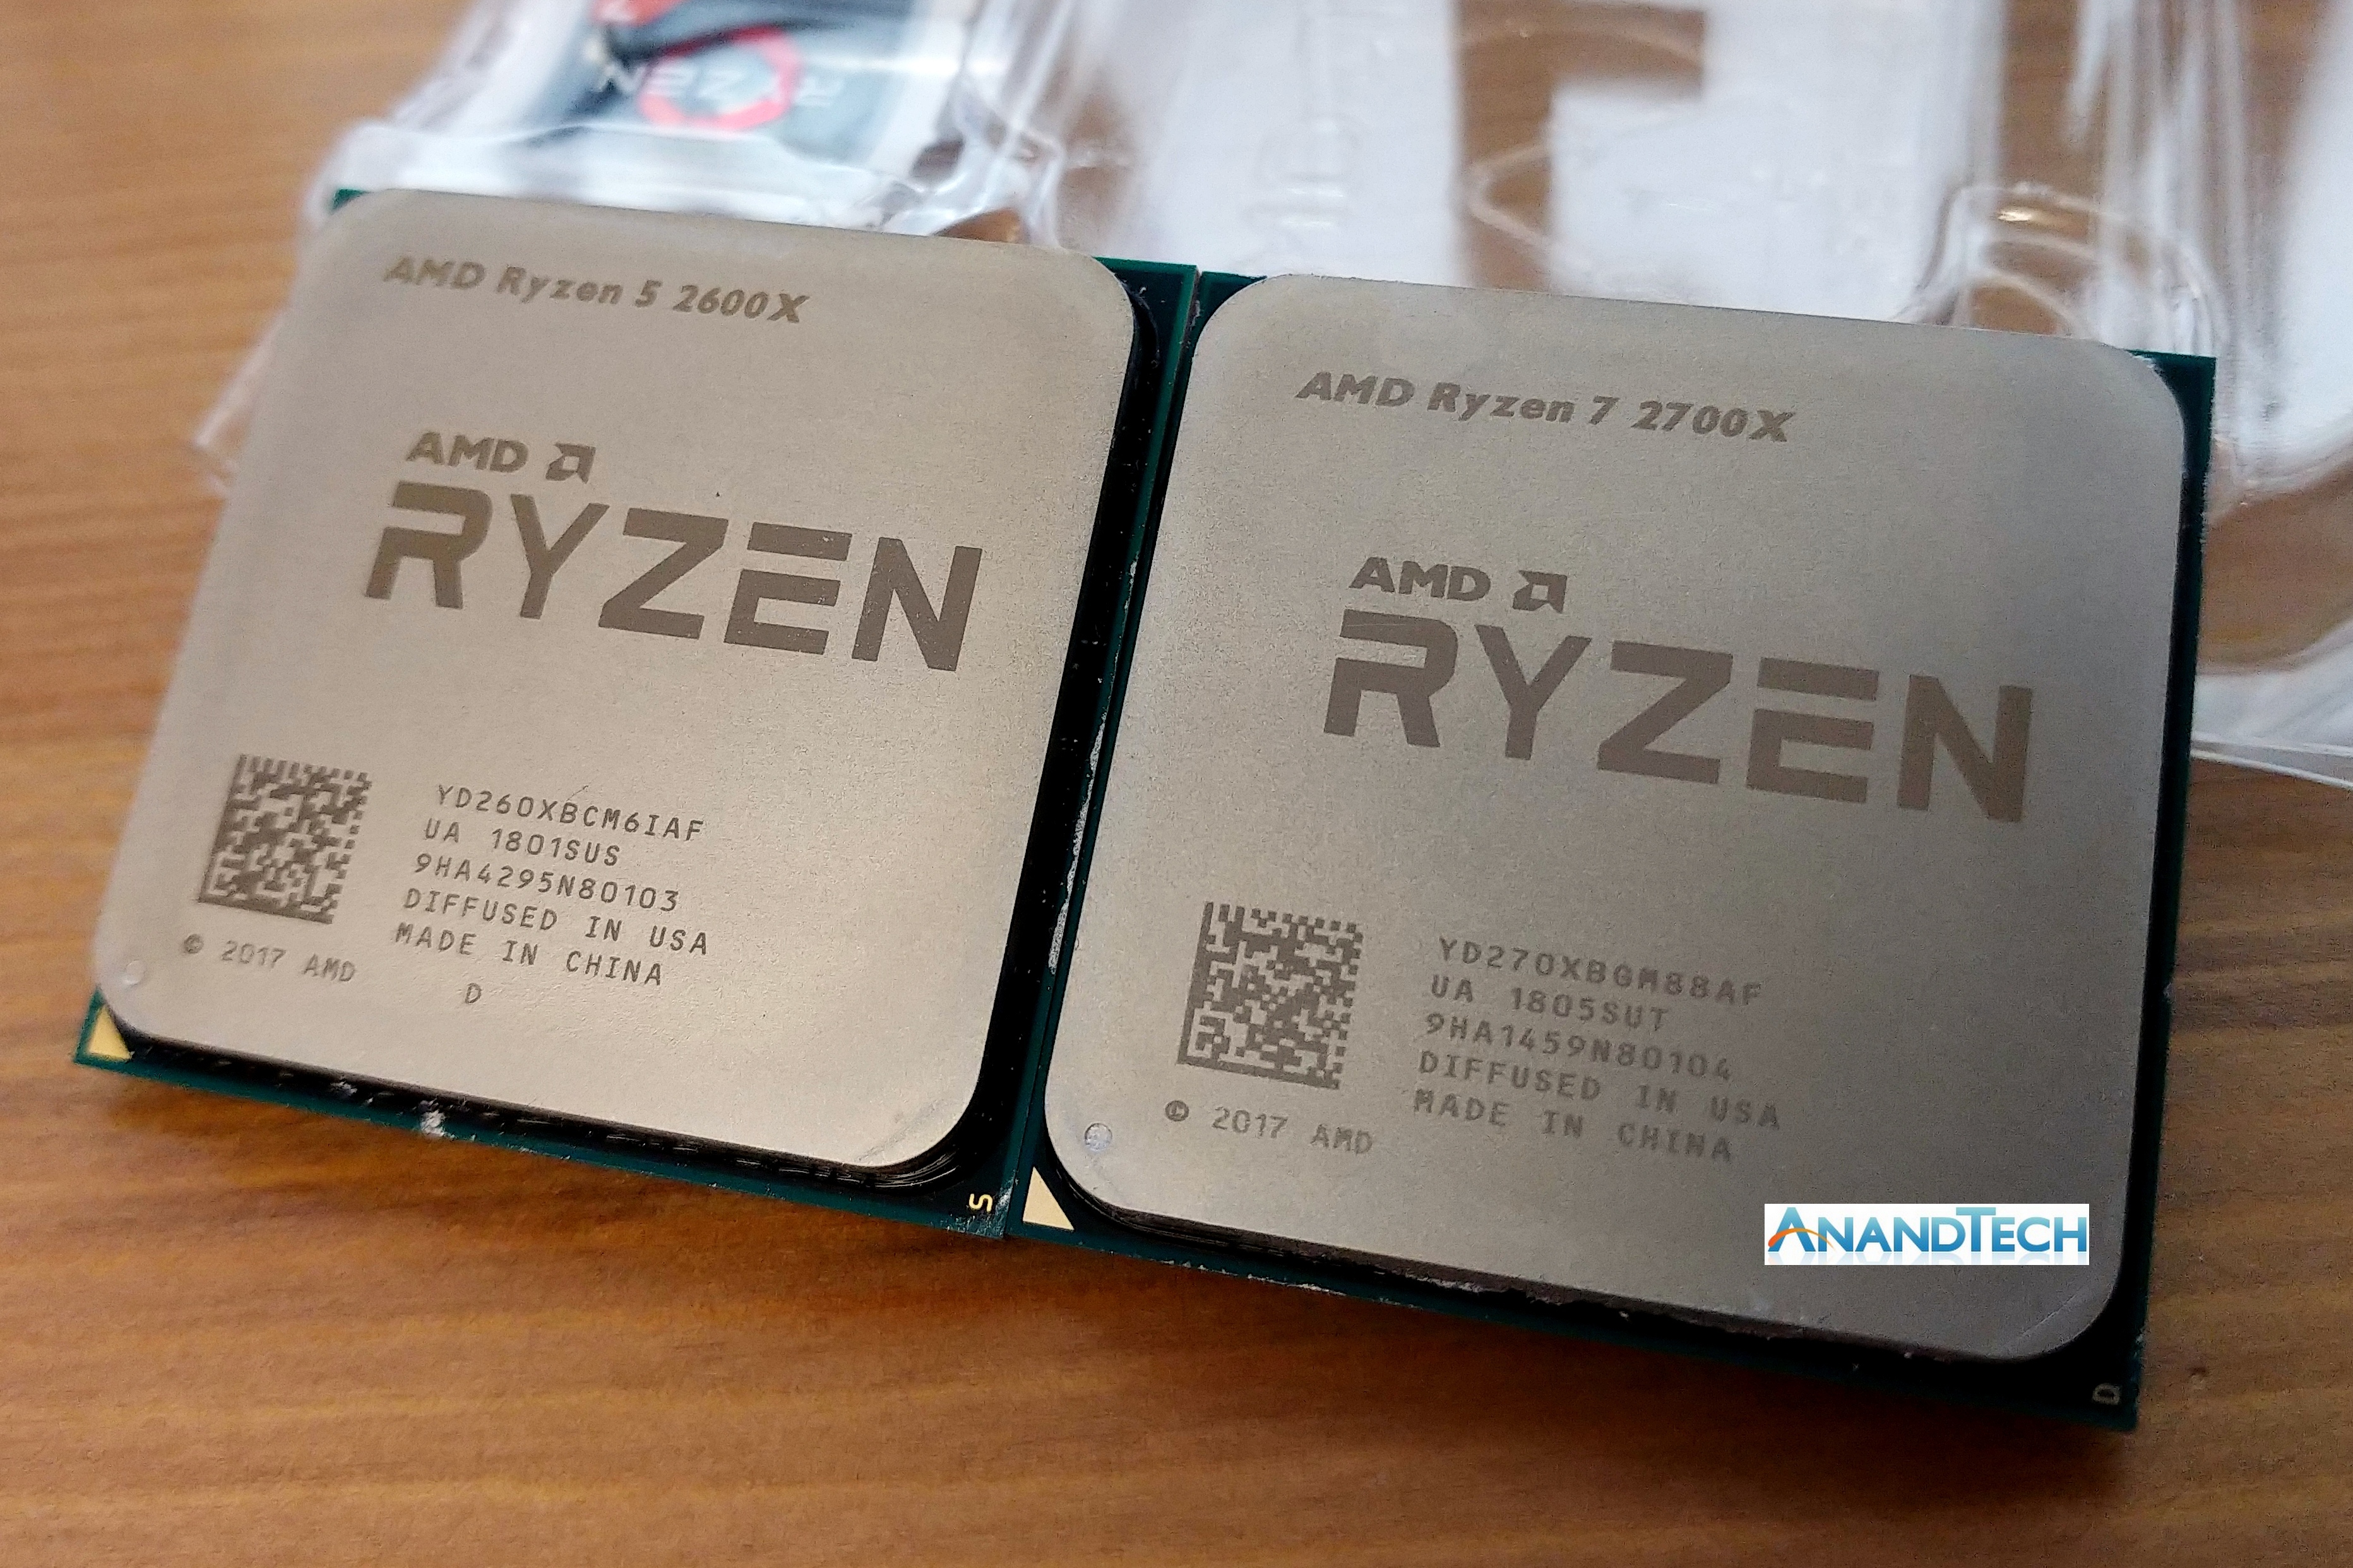
For readers that only want one piece of information, this is it: AMD is launching the Ryzen 7 2700X, the Ryzen 7 2700, the Ryzen 5 2600X, and the Ryzen 5 2600.
| AMD Ryzen 2000-Series CPUss | ||||
| Ryzen 7 2700X | Ryzen 7 2700 | Ryzen 5 2600X | Ryzen 5 2600 | |
| CPU Cores/Threads | 8 / 16 | 8 / 16 | 6 / 12 | 6 / 12 |
| Base CPU Frequency | 3.7 GHz | 3.2 GHz | 3.6 GHz | 3.4 GHz |
| Turbo CPU Frequency | 4.3 GHz | 4.1 GHz | 4.2 GHz | 3.9 GHz |
| TDP @ Base Frequency | 105 W | 65 W | 95 W | 65 W |
| L1 Cache | I: 64K. D: 32K | I: 64K. D: 32K | I: 64K. D: 32K | I: 64K. D: 32K |
| L2 Cache | 512 KB/core | 512 KB/core | 512 KB/core | 512 KB/core |
| L3 Cache | 16 MB | 16 MB | 16 MB | 16 MB |
| DRAM Support | DDR4-2933 Dual Channel |
DDR4-2933 Dual Channel |
DDR4-2933 Dual Channel |
DDR4-2933 Dual Channel |
| PCIe Lanes (CPU) | 16 Free + 4 NVMe | 16 Free + 4 NVMe | 16 Free + 4 NVMe | 16 Free + 4 NVMe |
| Price | $329 | $299 | $229 | $199 |
| Bundled Cooler | AMD Prism RGB | AMD Spire RGB | AMD Spire | AMD Stealth |
The Ryzen 7 2700X takes over the top spot from the Ryzen 7 1800X, and for an extra 10 W in TDP will provide a base frequency of 3.7 GHz and a turbo frequency of 4.3 GHz on its eight cores, with simultaneous multi-threading. This is an extra +100 MHz and +300 MHz respectively, going above the average limits of the 1800X when overclocked.
The 2700X also reduces the top cost for the best AM4 Ryzen processor: when launched, the 1800X was set at $499, without a bundled cooler, and was recently dropped to $349 as a price-competitor to Intel’s most powerful mainstream processor. The 2700X undercuts both, by being listed at a suggested e-tail price of $329, and is bundled with the best stock cooler in the business: AMD’s Wraith Prism RGB. AMD is attempting to hit all the targets: aggressive pricing, top performance, and best value, all in one go.
The Ryzen 5 2600X is the six-core option, also with an aggressive frequency strategy: 3.6 GHz base and 4.2 GHz turbo. At a 95W TDP and a suggested retail price of $229, it comes bundled with AMD’s Wraith Spire cooler, which again is an impressive stock cooler.
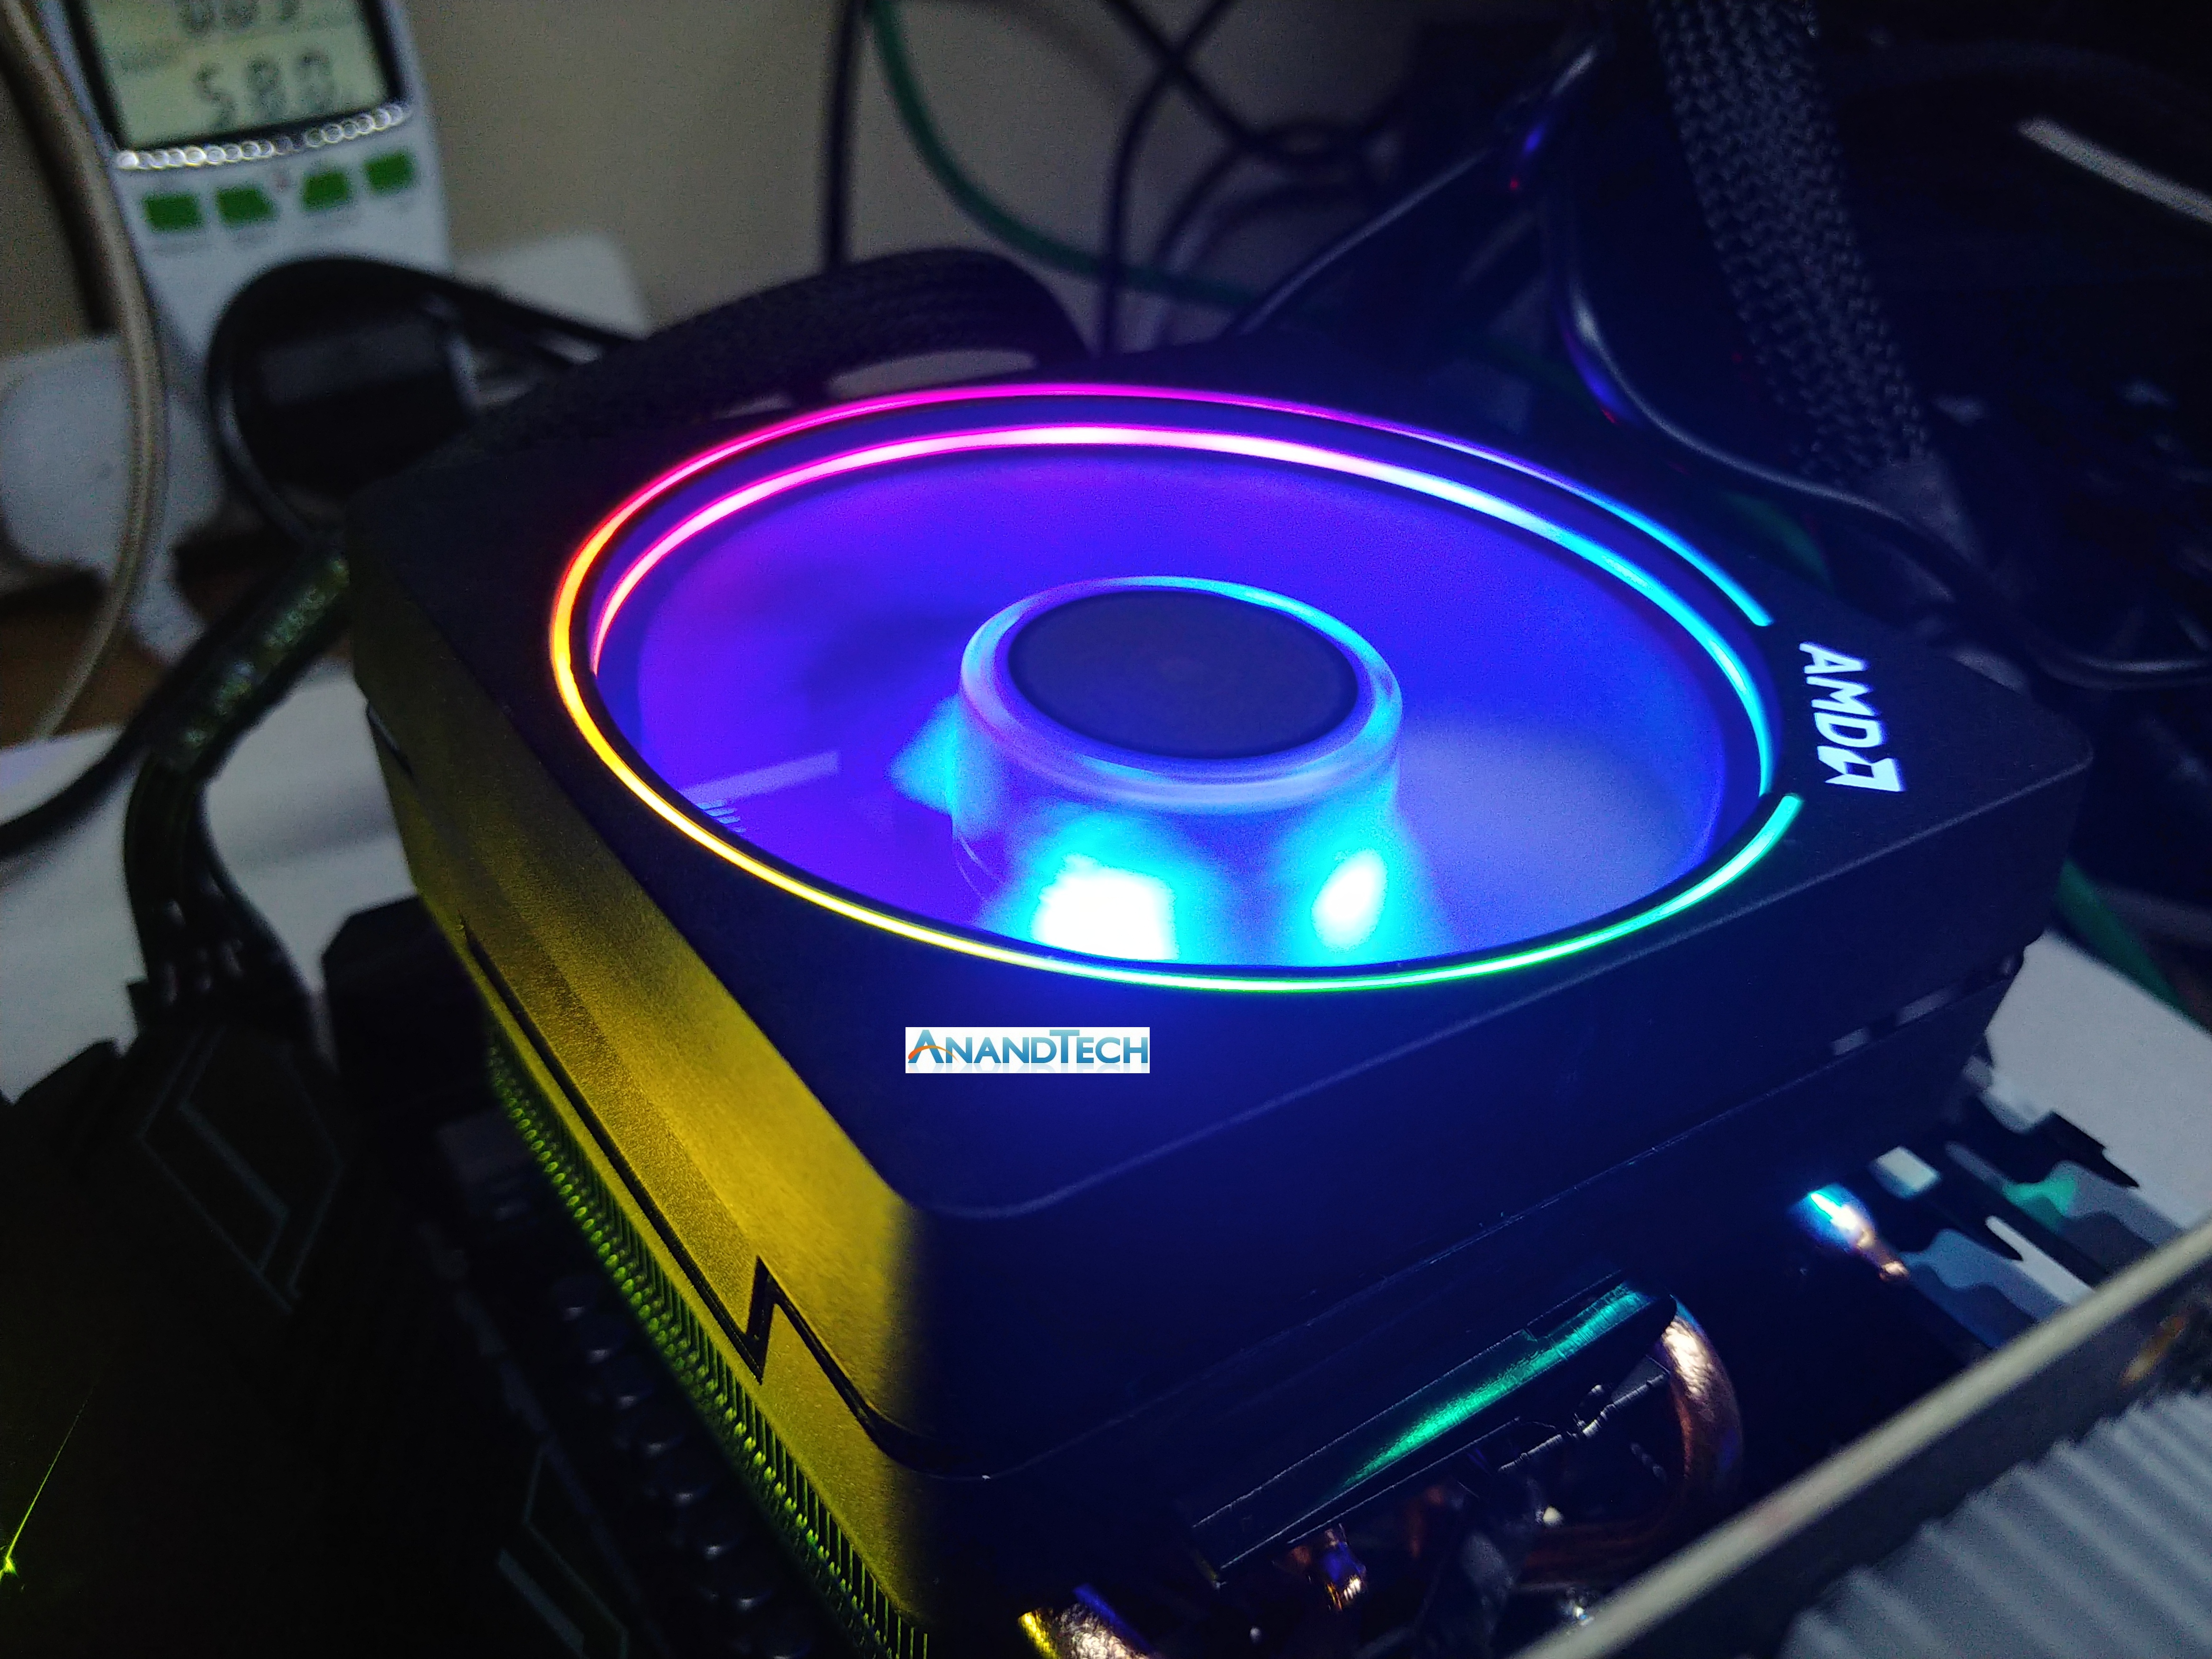
The Ryzen 7 2700 and Ryzen 5 2600 are the 65W versions of the X counterparts, offering near-similar frequencies for $30 less. All the CPUs will support dual-channel DDR4-2933 memory, up from the DDR4-2666 memory support of the 2017 Ryzen processors. One of the big changes is that now every processor comes with a bundled stock cooler, ranging from the Silent 65W Stealth models up to the big Prism RGB, all of which are easily sufficient for good turbo performance.
AMD’s intended AM4 Ryzen product line is now going to look like this:
| AMD Ryzen Product Stacks & Launch Prices | |||
| Ryzen 1000 (2017) | Ryzen 2000 (2018) | ||
| Ryzen 7 1800X | $499 | Ryzen 7 2700X | $329 |
| Ryzen 7 1700X | $399 | ||
| Ryzen 7 1700 | $329 | Ryzen 7 2700 | $299 |
| Ryzen 5 1600X | $249 | Ryzen 5 2600X | $229 |
| Ryzen 5 1600 | $219 | Ryzen 5 2600 | $199 |
| Ryzen 5 1500X | $189 | Ryzen 5 1500X | $159 |
| Ryzen 5 1400 | $169 | Ryzen 5 2400G | $169 |
| Ryzen 3 1300X | $129 | Ryzen 3 1300X | $114 |
| Ryzen 3 1200 | $109 | Ryzen 3 2200G | $99 |
At the top, the 2700X takes over from both the 1700X and 1800X. Rather than having three Ryzen 7 CPUs in the market for this generation, AMD examined its product line and opted on two, perhaps based on sales figures. As seen in this review, the 2700X is already pushing the silicon process to the limit, so there is not much headroom to go above this product for a new model in the future.
The full list ends up being a mix of Ryzen 2000-series CPUs (the new ones), Ryzen 2000-series APUs, and a pair of Ryzen 1000-series. We already examined the APUs in great detail in the past few weeks, showing that they directly replaced some of the original first-generation parts very easily. So far the four new 2000-series will sit at the top of the pile, however AMD’s strategy is often to drip feed its new parts, so we might see some more 2000-series as time goes on.
The Other Information From Today’s Launch
No launch is complete without talking about the features. AMD is using GlobalFoundries’ 12nm manufacturing process which has obvious on-paper benefits, however there are a number of internal firmware adjustments to touch upon, updated features and roles for AMD’s Precision Boost and XFR technologies that can have direct impacts on performance, a new chipset (along with 30+ motherboards) to run alongside the current offerings, and also new/renamed features such StoreMI. We also want to examine how these new products fit into AMD’s longer term plans and whether they are on track.
We’ll cover these in the next few pages, as well as the results from our testing.
- Talking 12nm: GlobalFoundries and Extra Performance
- Improvements to the Cache Hierarchy: +3% IPC and +10% Overall
- Precision Boost 2: Getting More Hertz Across The Board
- XFR2: A Dynamic Response to Cooling
- New X470 Chipset and Motherboards: A Focus on Power
- StoreMI: The Way To A Faster JBOD
- Power Analysis
- Our CPU Benchmarking Results
- Our Gaming CPU Benchmarking Results
- Conclusions
AMD’s Ryzen 2000 Competition: Intel’s Coffee Lake
As part of today’s launch, AMD went into extensive benchmarking detail about its new chips. It was abundantly clear from the data provided that these new processors are aimed squarely at Intel’s most recent mainstream processors: Coffee Lake. This is in contrast to when the Ryzen 1000-series was launched last year, when the octo-core Ryzen 7 1800X was compared against an 8-core Broadwell-E: in the interim Intel has updated its mainstream processor line to six-cores with high frequencies.
As a result, AMD is suggesting to compare the Ryzen 7 2700X against the Core i7-8700K and the Ryzen 5 2600X against the Core i5-8500K. This is significant – now both of the main x86 players in the processor market are keen to pit their most recent products against each other in a head to head battle. This hasn’t really happened like this for a number of generations. However, certain metrics will still run true as to the launch last year:
- Intel is expected to have a frequency and IPC advantage
- AMD’s counter is to come close on frequency and offer more cores at the same price
It is easy for AMD to wave the multi-threaded crown with its internal testing, however the single thread performance is still a little behind. A number of the new features with the Ryzen 2000-series are designed to help this: slightly higher IPC, higher frequencies, a higher TDP, and a better dynamic frequency boost model. We will cover these over the next few pages.
| Comparison: Ryzen 7 2700X vs Core i7-8700K | ||
| AMD Ryzen 7 2700X |
Features | Intel Core i7-8700K |
| 8 / 16 | Cores/Threads | 6 / 12 |
| 3.7 / 4.3 GHz | Base/Turbo | 3.7 / 4.7 |
| 16 (Free) + 4 (NVMe) | PCIe 3.0 Lanes | 16 (Free) |
| 512 KB/core | L2 Cache | 256 KB/core |
| 16 MB | L3 Cache | 12 MB |
| 105 W | TDP | 95 W |
| $329 | Price (List) | $349 |
Frequencies and core counts are one part of the equation, though the way that AMD and Intel have different cache models will also play a significant part. One of the things we will see in this analysis is the comparative cache metrics, as well as the tuning AMD has done to close the gap. For pricing, AMD has put the Ryzen 7 2700X below the i7-8700K, as well as bundling the Wraith Prism RGB stock cooler which easily replaces any $30-40 cooler, saving the user some money.
| Comparison: Ryzen 5 2600X vs Core i5-8600K | ||
| AMD Ryzen 5 2600X |
Features | Intel Core i5-8600K |
| 6 / 12 | Cores/Threads | 6 / 6 |
| 3.6 / 4.2 GHz | Base/Turbo | 3.6 / 4.3 |
| 16 (Free) + 4 (NVMe) | PCIe 3.0 Lanes | 16 (Free) |
| 512 KB/core | L2 Cache | 256 KB/core |
| 16 MB | L3 Cache | 9 MB |
| 95 W | TDP | 95 W |
| $229 | Price (List) | $239 |
The Ryzen 5 2600X comparison with the Core i5-8600K is much closer than the higher-end parts. These components share core counts, although the Ryzen 5 has double the threads. For any multithreaded workload that can take advantage of simultaneous multithreading is likely to pull ahead. The Core i5-8600K is slightly ahead in core frequency, and is expected to have an IPC advantage as well. Again, AMD bundles the CPU with a good stock cooler, whereas Intel’s offering is poor-to-nil.
Overall, AMD is claiming that its high-end processors will come in within 1-2% of the competition at 1440p gaming, but give +20% in ‘creative performance’. We’ve got a few ways to test this.
Talking 12nm and Zen+
One of the highlights of the Ryzen 2000-series launch is that these processors use GlobalFoundries’ 12LP manufacturing process, compared to the 14LPP process used for the first generation of Ryzen processors. Both AMD and GlobalFoundries have discussed the differences in the processes, however it is worth understanding that each company has different goals: AMD only needs to promote what helps its products, whereas GlobalFoundries is a semiconductor foundry with many clients and might promote ideal-scenario numbers. Earlier this year we were invited to GlobalFoundries Fab 8 in upstate New York to visit the clean room, and had a chance to interview Dr. Gary Patton, the CTO.

The Future of Silicon: An Exclusive Interview with Dr. Gary Patton, CTO of GlobalFoundries
In that interview, several interesting items came to light. First, that the CTO doesn’t necessarily have to care much about what certain processes are called: their customers know the performance of a given process regardless of the advertised ‘nm’ number based on the development tools given to them. Second, that 12LP is a series of minor tweaks to 14LPP, relating to performance bumps and improvements that come from a partial optical shrink and a slight change in manufacturing rules in the middle-line and back-end of the manufacturing process. In the past this might not have been so news worthy, however GF’s customers want to take advantage of the improved process.
Overall, GlobalFoundries has stated that its 12LP process offers a 10% performance improvement and a 15% circuit density improvement over 14LPP.
This has been interpreted in many ways, such as an extra 10% frequency at the same power, or lower power for the same frequency, and an opportunity to build smaller chips.
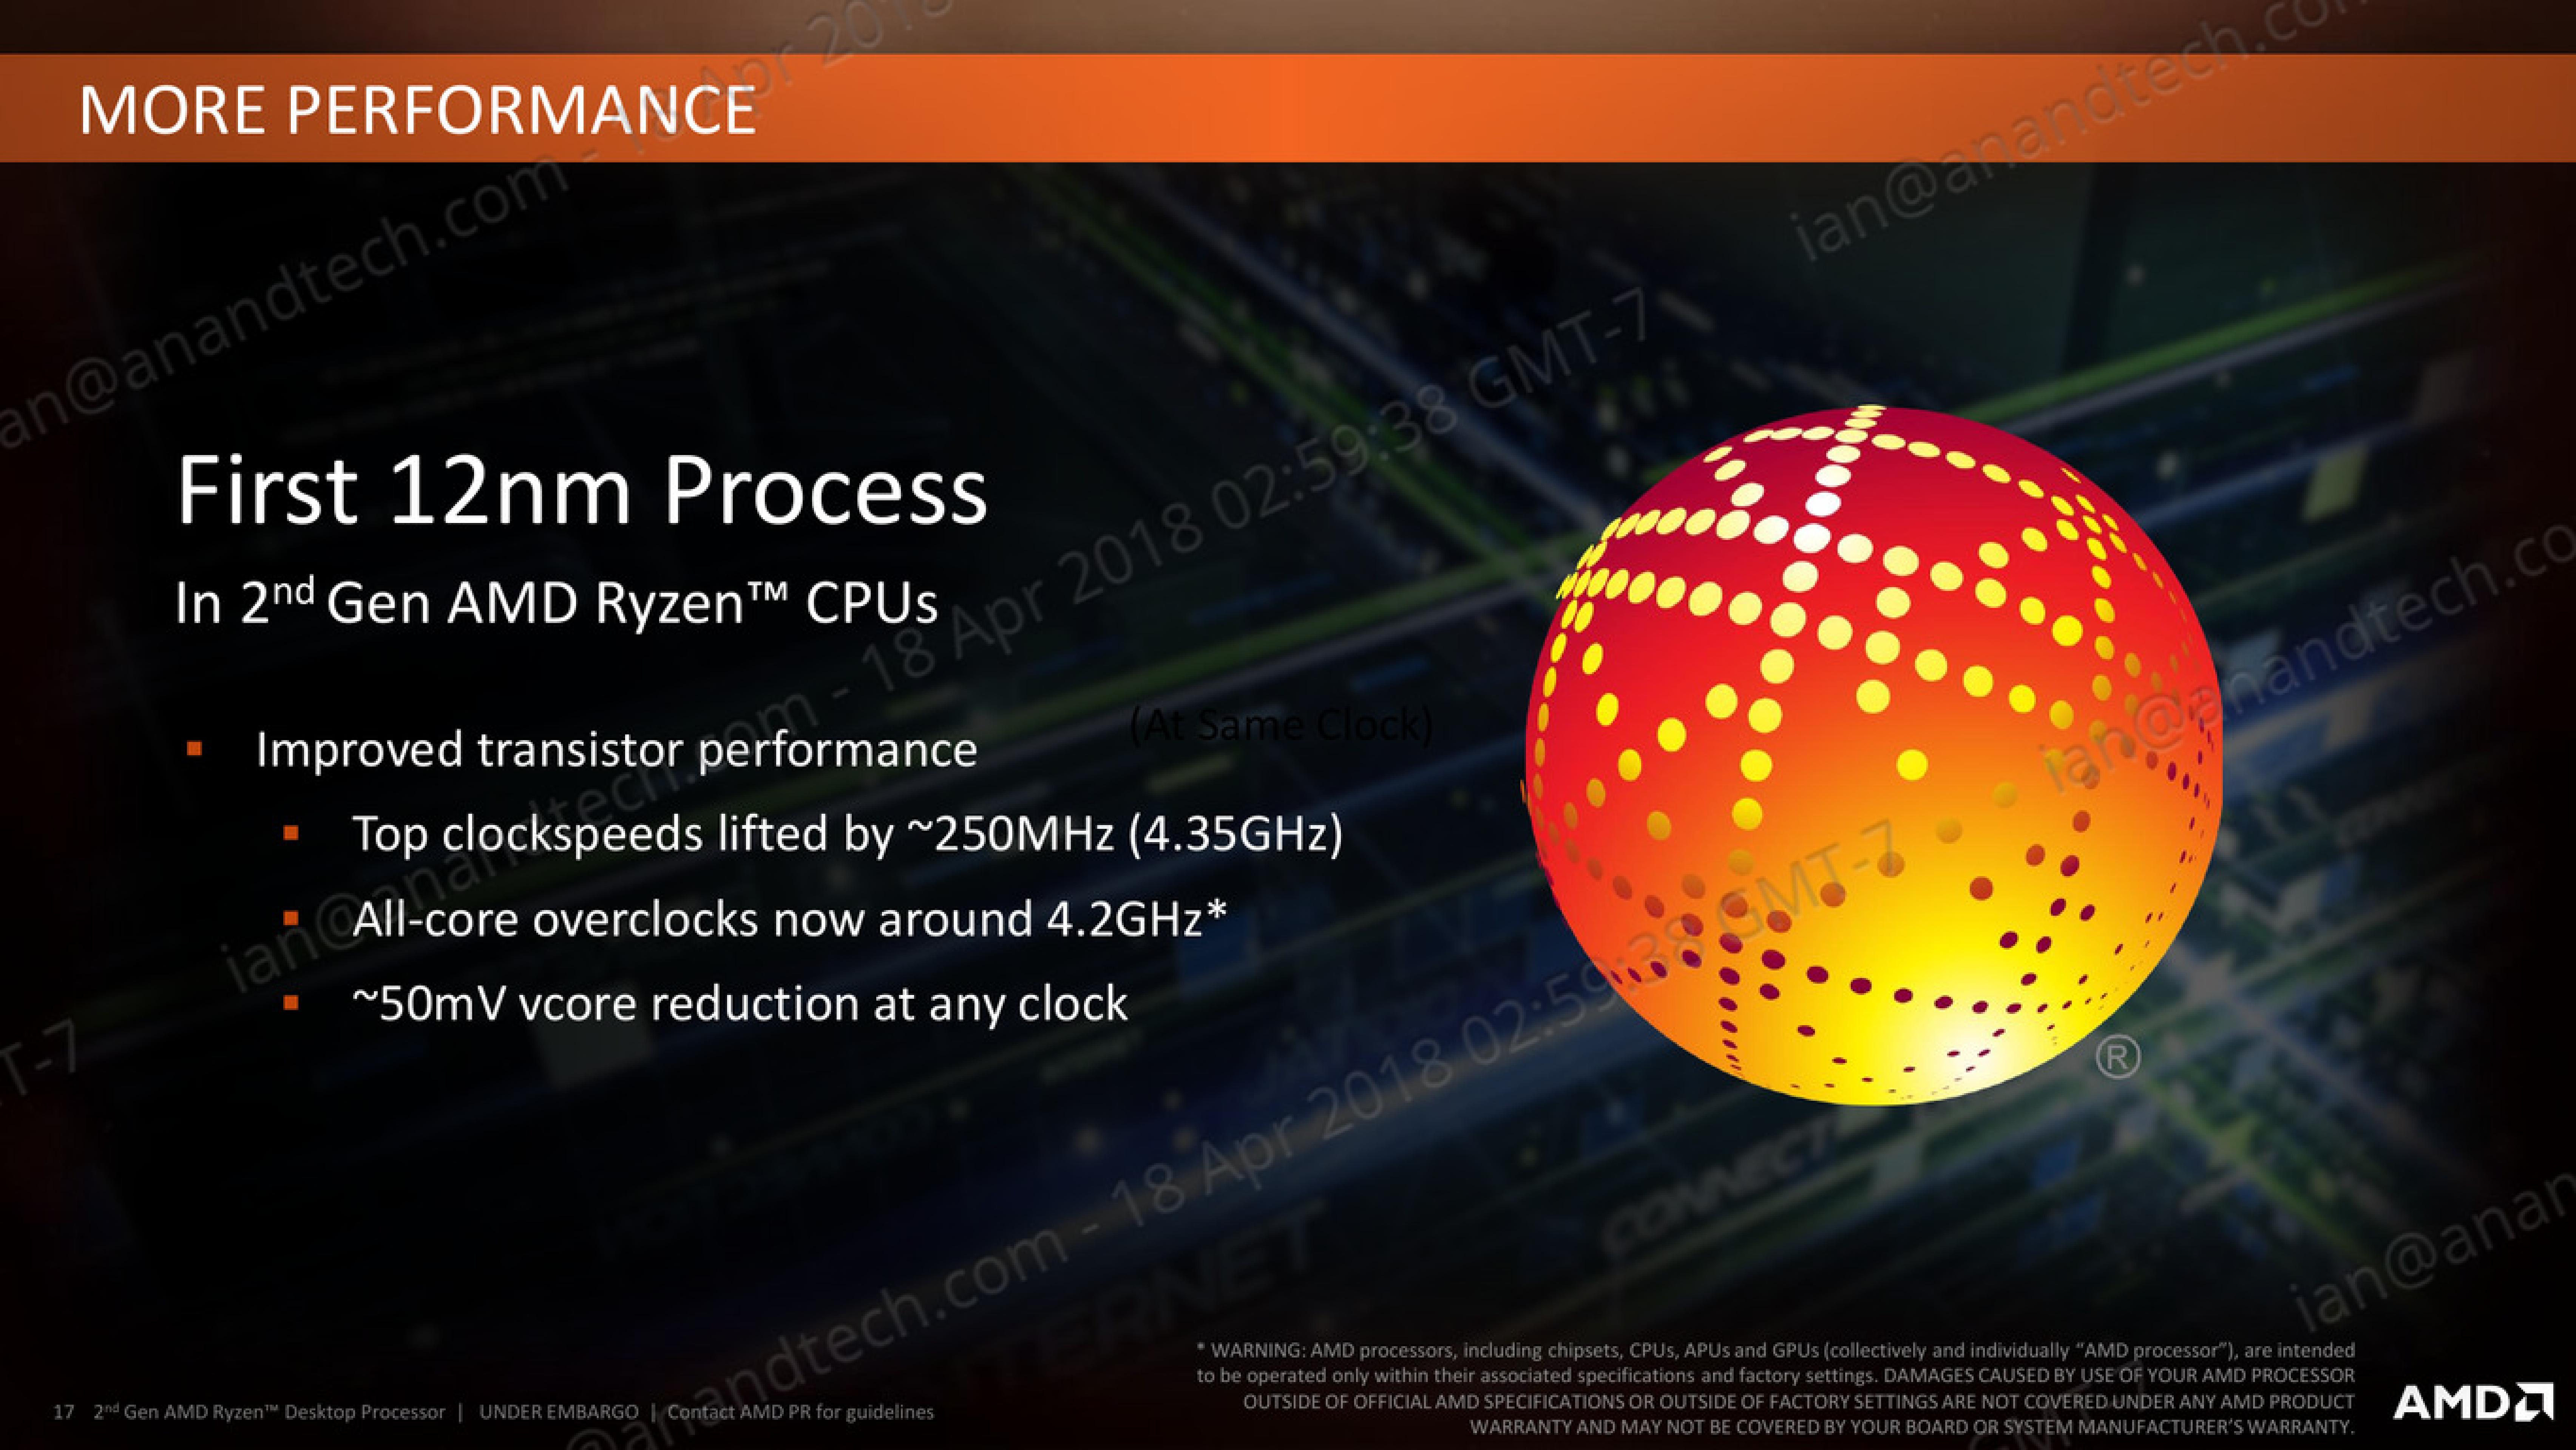
As part of today’s launch, AMD has clarified what the move to 12LP has meant for the Ryzen 2000-series:
- Top Clock Speeds lifted by ~250 MHz (~6%)
- All-core overclocks around 4.2 GHz
- ~50 mV core voltage reduction
AMD goes on to explain that at the same frequency, its new Ryzen 2000-series processors draw around 11% less power than the Ryzen 1000-series. The claims also state that this translates to +16% performance at the same power. These claims are a little muddled, as AMD has other new technologies in the 2000-series which will affect performance as well.
One interesting element is that although GF claims that there is a 15% density improvement, AMD is stating that these processors have the same die size and transistor count as the previous generation. Ultimately this seems in opposition to common sense – surely AMD would want to use smaller dies to get more chips per wafer?
Ultimately, the new processors are almost carbon copies of the old ones, both in terms of design and microarchitecture. AMD is calling the design of the cores as ‘Zen+’ to differentiate them to the previous generation ‘Zen’ design, and it mostly comes down to how the microarchitecture features are laid out on the silicon. When discussing with AMD, the best way to explain it is that some of the design of the key features has not moved – they just take up less area, leaving more dark silicon between other features.
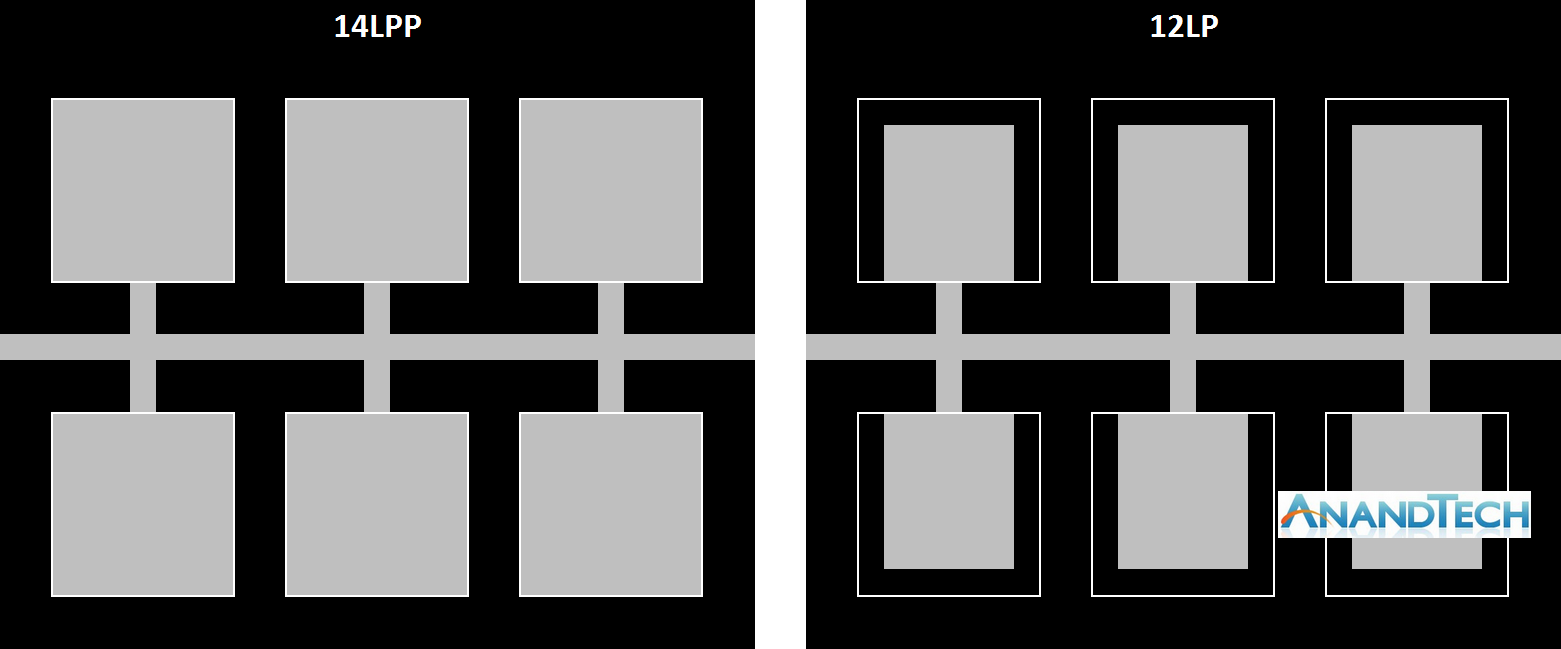
Here is a very crude representation of features attached to a data path. On the left is the 14LPP design, and each of the six features has a specific size and connects to the bus. Between each of the features is the dark silicon – unused silicon that is either seen as useless, or can be used as a thermal buffer between high-energy parts. On the right is the representation of the 12LP design – each of the features have been reduced in size, putting more dark silicon between themselves (the white boxes show the original size of the feature). In this context, the number of transistors is the same, and the die size is the same. But if anything in the design was thermally limited by the close proximity of two features, there is now more distance between them such that they should interfere with each other less.
For reference, AMD lists the die-size of these new parts as 213mm2, containing 4.8 billion transistors, identical to the first generation silicon design. AMD confirmed that they are using 9T transistor libraries, also the same as the previous generation, although GlobalFoundries offers a 7.5T design as well.
So is Zen+ a New Microarchitecture, or Process Node Change?
Ultimately, nothing about most of the Zen+ physical design layout is new. Aside from the manufacturing process node change and likely minor adjustments, the rest of the adjustments are in firmware and support:
- Cache latency adjustments leading to +3% IPC
- Increased DRAM Frequency Support to DDR4-2933
- Better voltage/frequency curves, leading to +10% performance overall
- Better Boost Performance with Precision Boost 2
- Better Thermal Response with XFR2
Improvements to the Cache Hierarchy
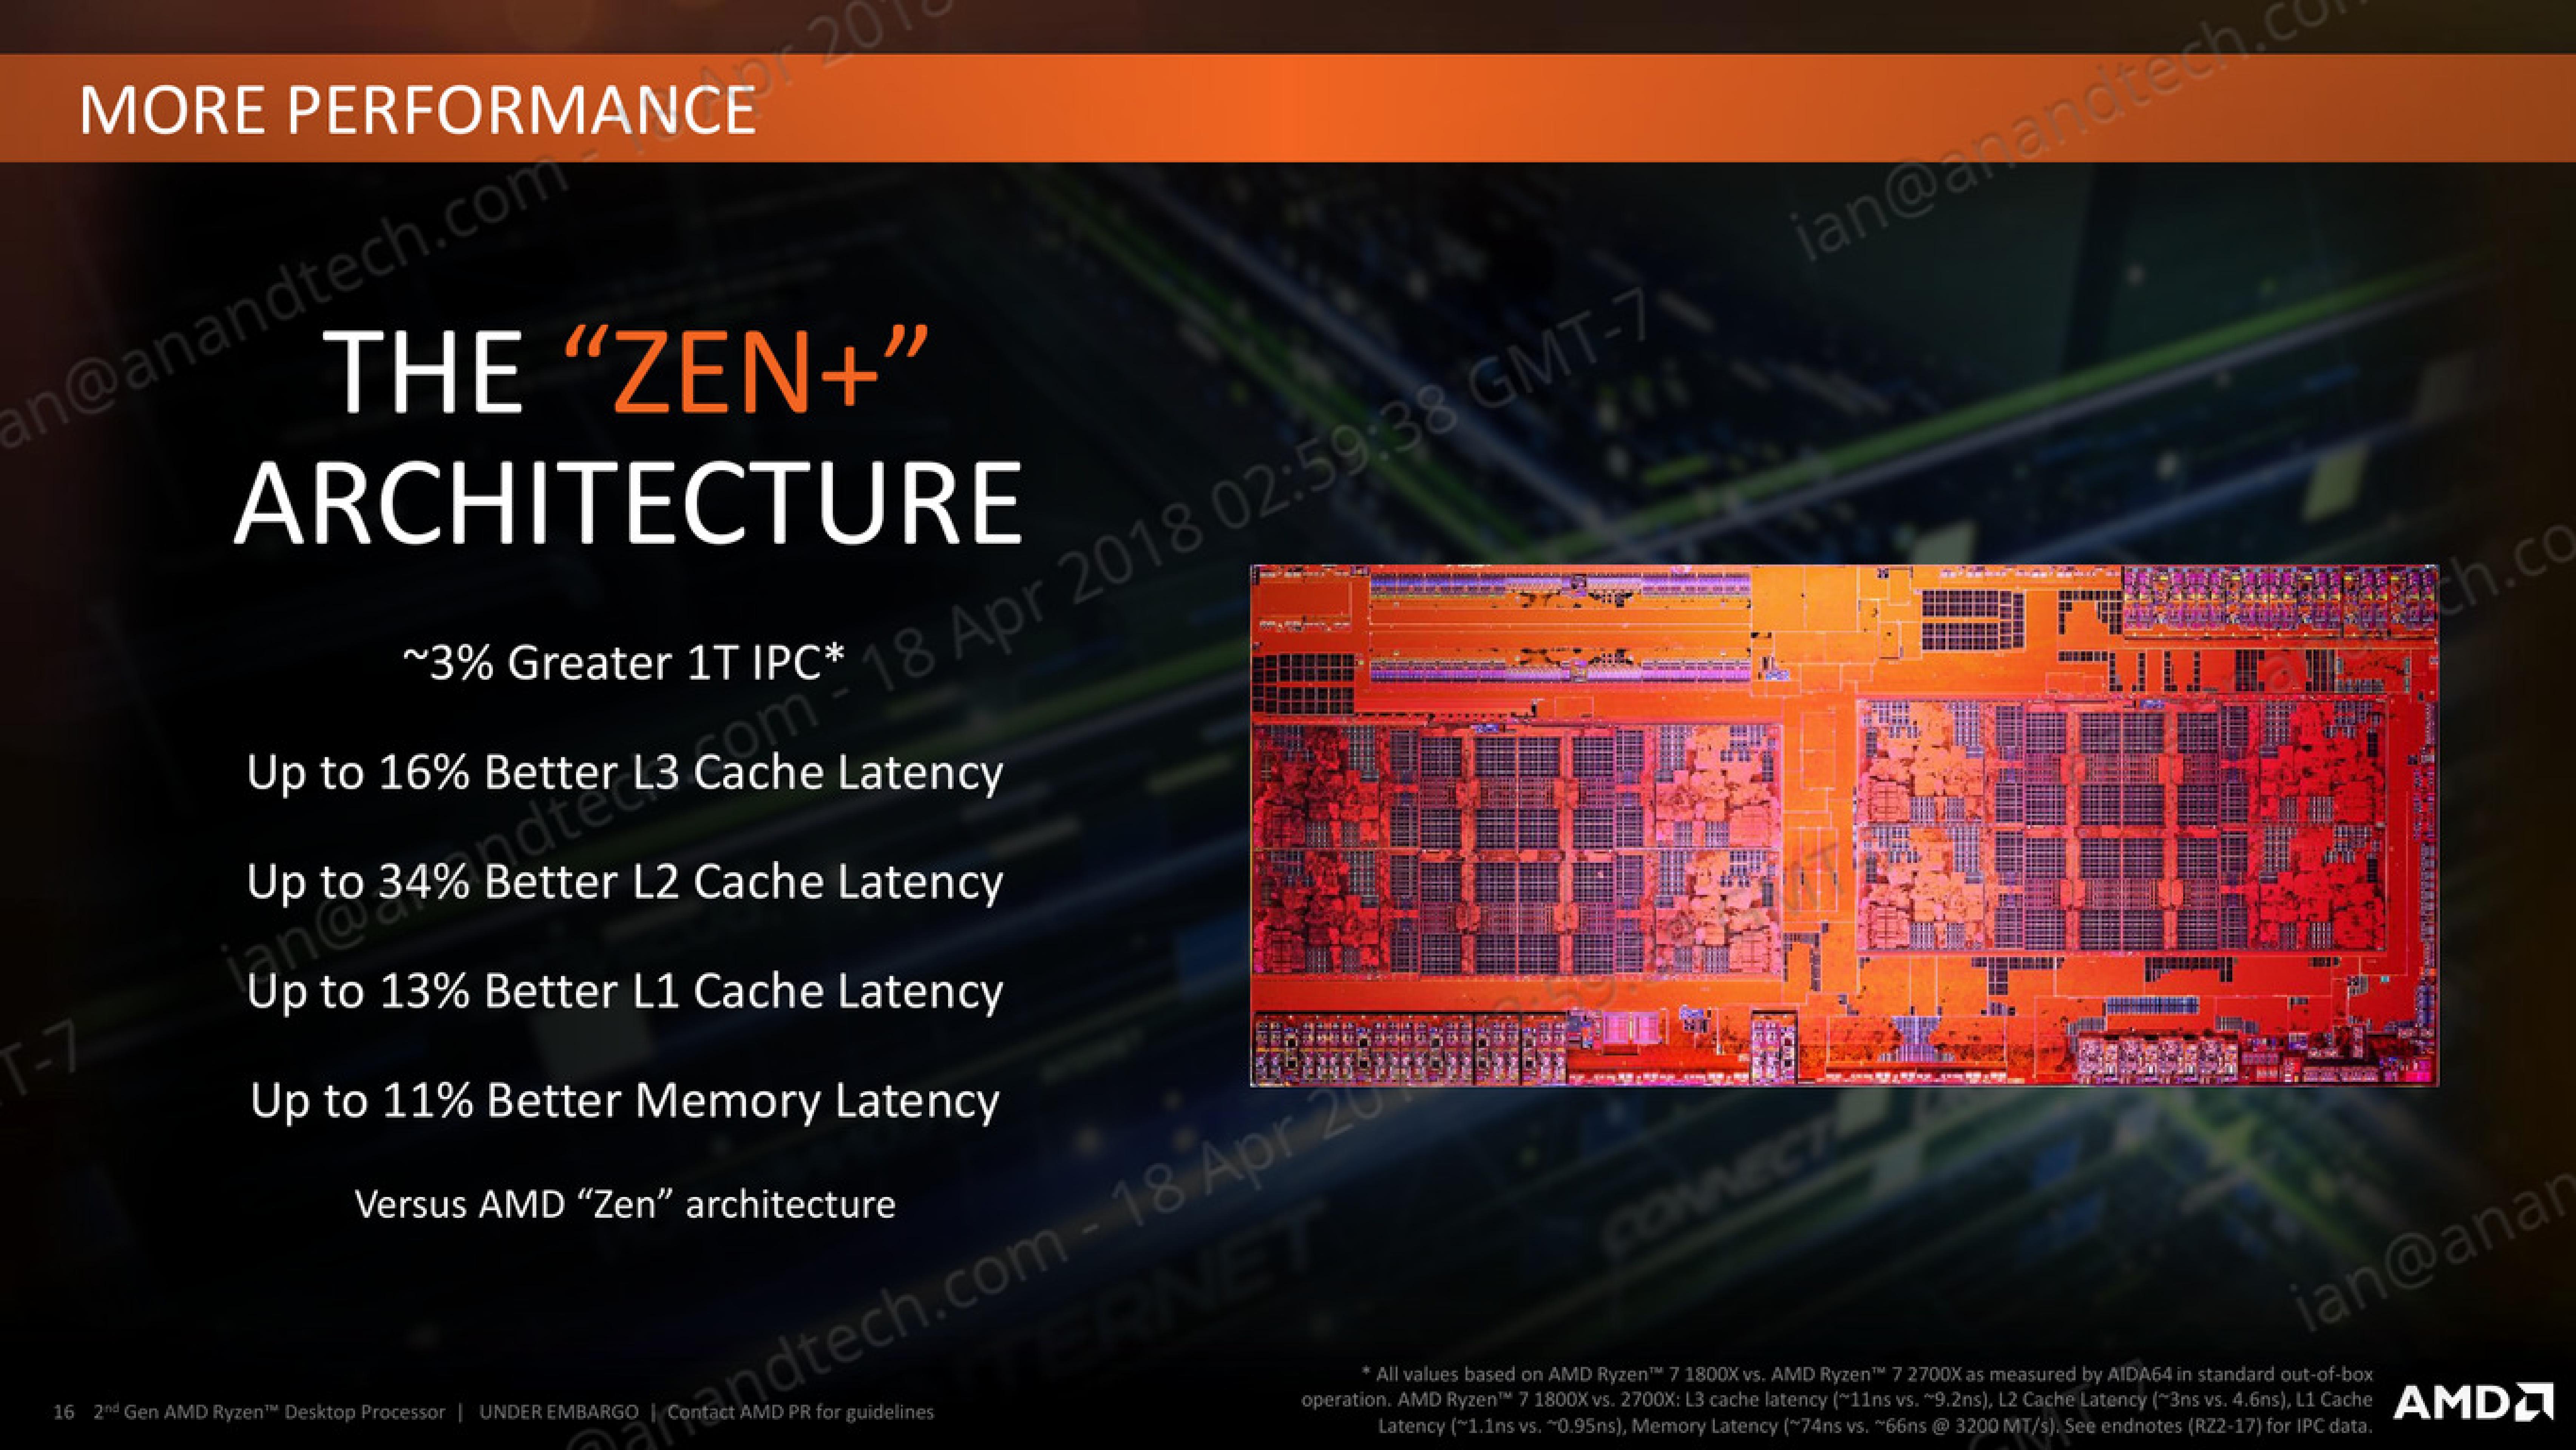
The biggest under-the-hood change for the Ryzen 2000-series processors is in the cache latency. AMD is claiming that they were able to knock one-cycle from L1 and L2 caches, several cycles from L3, and better DRAM performance. Because pure core IPC is intimately intertwined with the caches (the size, the latency, the bandwidth), these new numbers are leading AMD to claim that these new processors can offer a +3% IPC gain over the previous generation.
The numbers AMD gives are:
- 13% Better L1 Latency (1.10ns vs 0.95ns)
- 34% Better L2 Latency (4.6ns vs 3.0ns)
- 16% Better L3 Latency (11.0ns vs 9.2ns)
- 11% Better Memory Latency (74ns vs 66ns at DDR4-3200)
- Increased DRAM Frequency Support (DDR4-2666 vs DDR4-2933)
It is interesting that in the official slide deck AMD quotes latency measured as time, although in private conversations in our briefing it was discussed in terms of clock cycles. Ultimately latency measured as time can take advantage of other internal enhancements; however a pure engineer prefers to discuss clock cycles.
Naturally we went ahead to test the two aspects of this equation: are the cache metrics actually lower, and do we get an IPC uplift?
Cache Me Ousside, How Bow Dah?
For our testing, we use a memory latency checker over the stride range of the cache hierarchy of a single core. For this test we used the following:
- Ryzen 7 2700X (Zen+)
- Ryzen 5 2400G (Zen APU)
- Ryzen 7 1800X (Zen)
- Intel Core i7-8700K (Coffee Lake)
- Intel Core i7-7700K (Kaby Lake)
The most obvious comparison is between the AMD processors. Here we have the Ryzen 7 1800X from the initial launch, the Ryzen 5 2400G APU that pairs Zen cores with Vega graphics, and the new Ryzen 7 2700X processor.
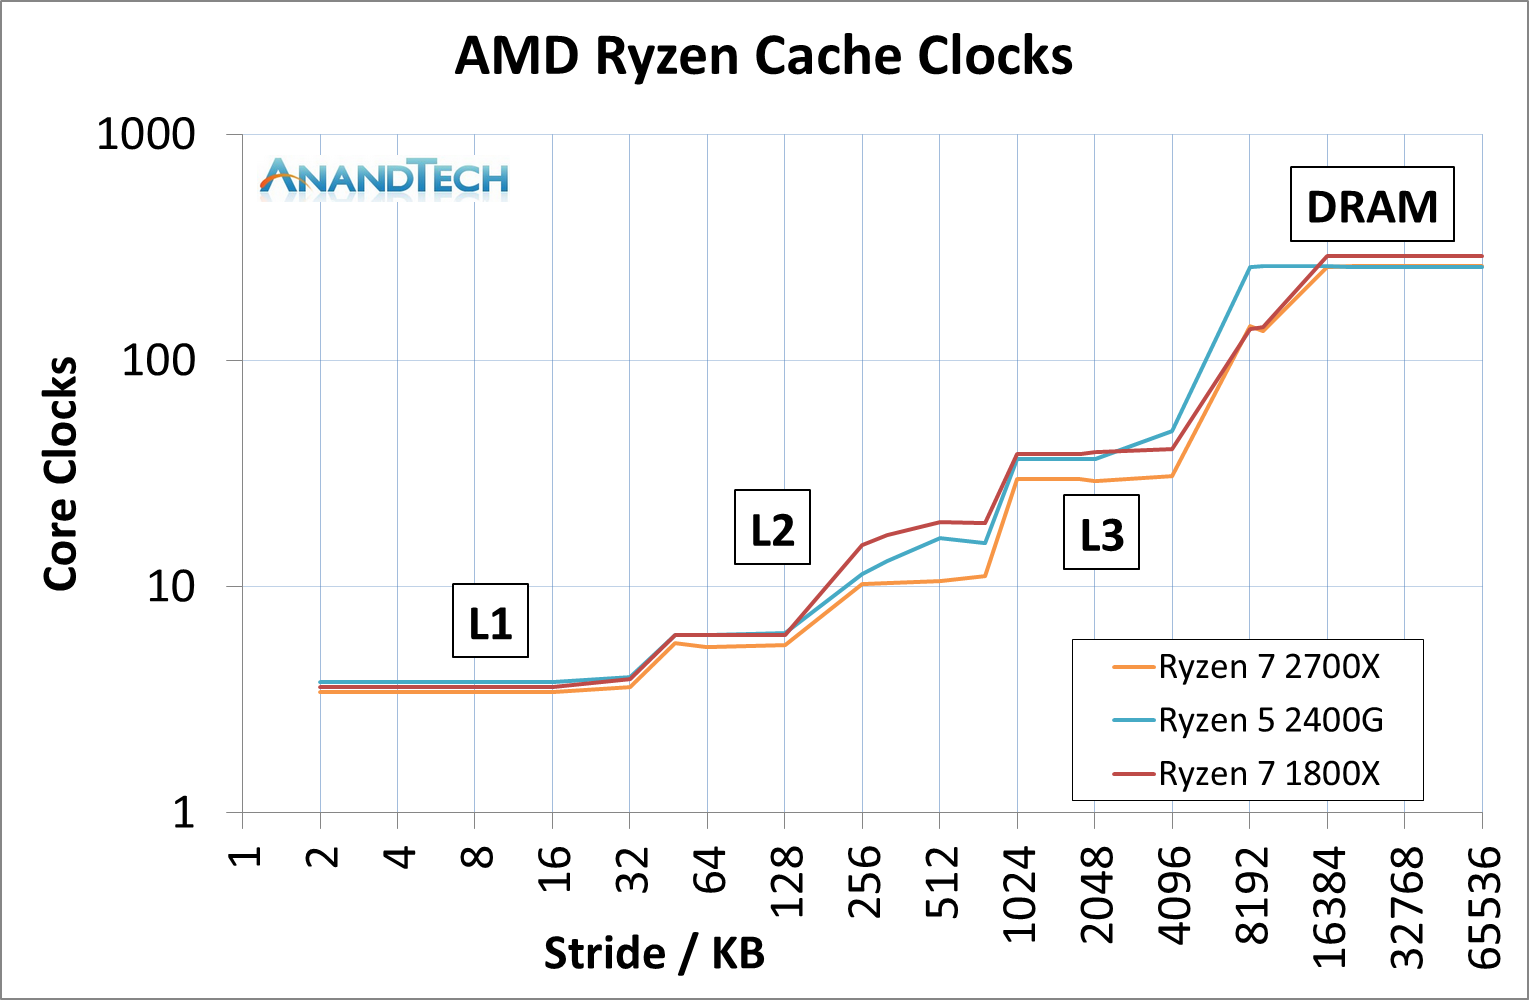
This graph is logarithmic in both axes.
This graph shows that in every phase of the cache design, the newest Ryzen 7 2700X requires fewer core clocks. The biggest difference is on the L2 cache latency, but L3 has a sizeable gain as well. The reason that the L2 gain is so large, especially between the 1800X and 2700X, is an interesting story.
When AMD first launched the Ryzen 7 1800X, the L2 latency was tested and listed at 17 clocks. This was a little high – it turns out that the engineers had intended for the L2 latency to be 12 clocks initially, but run out of time to tune the firmware and layout before sending the design off to be manufactured, leaving 17 cycles as the best compromise based on what the design was capable of and did not cause issues. With Threadripper and the Ryzen APUs, AMD tweaked the design enough to hit an L2 latency of 12 cycles, which was not specifically promoted at the time despite the benefits it provides. Now with the Ryzen 2000-series, AMD has reduced it down further to 11 cycles. We were told that this was due to both the new manufacturing process but also additional tweaks made to ensure signal coherency. In our testing, we actually saw an average L2 latency of 10.4 cycles, down from 16.9 cycles in on the Ryzen 7 1800X.
The L3 difference is a little unexpected: AMD stated a 16% better latency: 11.0 ns to 9.2 ns. We saw a change from 10.7 ns to 8.1 ns, which was a drop from 39 cycles to 30 cycles.
Of course, we could not go without comparing AMD to Intel. This is where it got very interesting. Now the cache configurations between the Ryzen 7 2700X and Core i7-8700K are different:
| CPU Cache uArch Comparison | ||
| AMD Zen (Ryzen 1000) Zen+ (Ryzen 2000) |
Intel Kaby Lake (Core 7000) Coffee Lake (Core 8000) |
|
| L1-I Size | 64 KB/core | 32 KB/core |
| L1-I Assoc | 4-way | 8-way |
| L1-D Size | 32 KB/core | 32 KB/core |
| L1-D Assoc | 8-way | 8-way |
| L2 Size | 512 KB/core | 256 KB/core |
| L2 Assoc | 8-way | 4-way |
| L3 Size | 8 MB/CCX (2 MB/core) |
2 MB/core |
| L3 Assoc | 16-way | 16-way |
| L3 Type | Victim | Write-back |
AMD has a larger L2 cache, however the AMD L3 cache is a non-inclusive victim cache, which means it cannot be pre-fetched into unlike the Intel L3 cache.
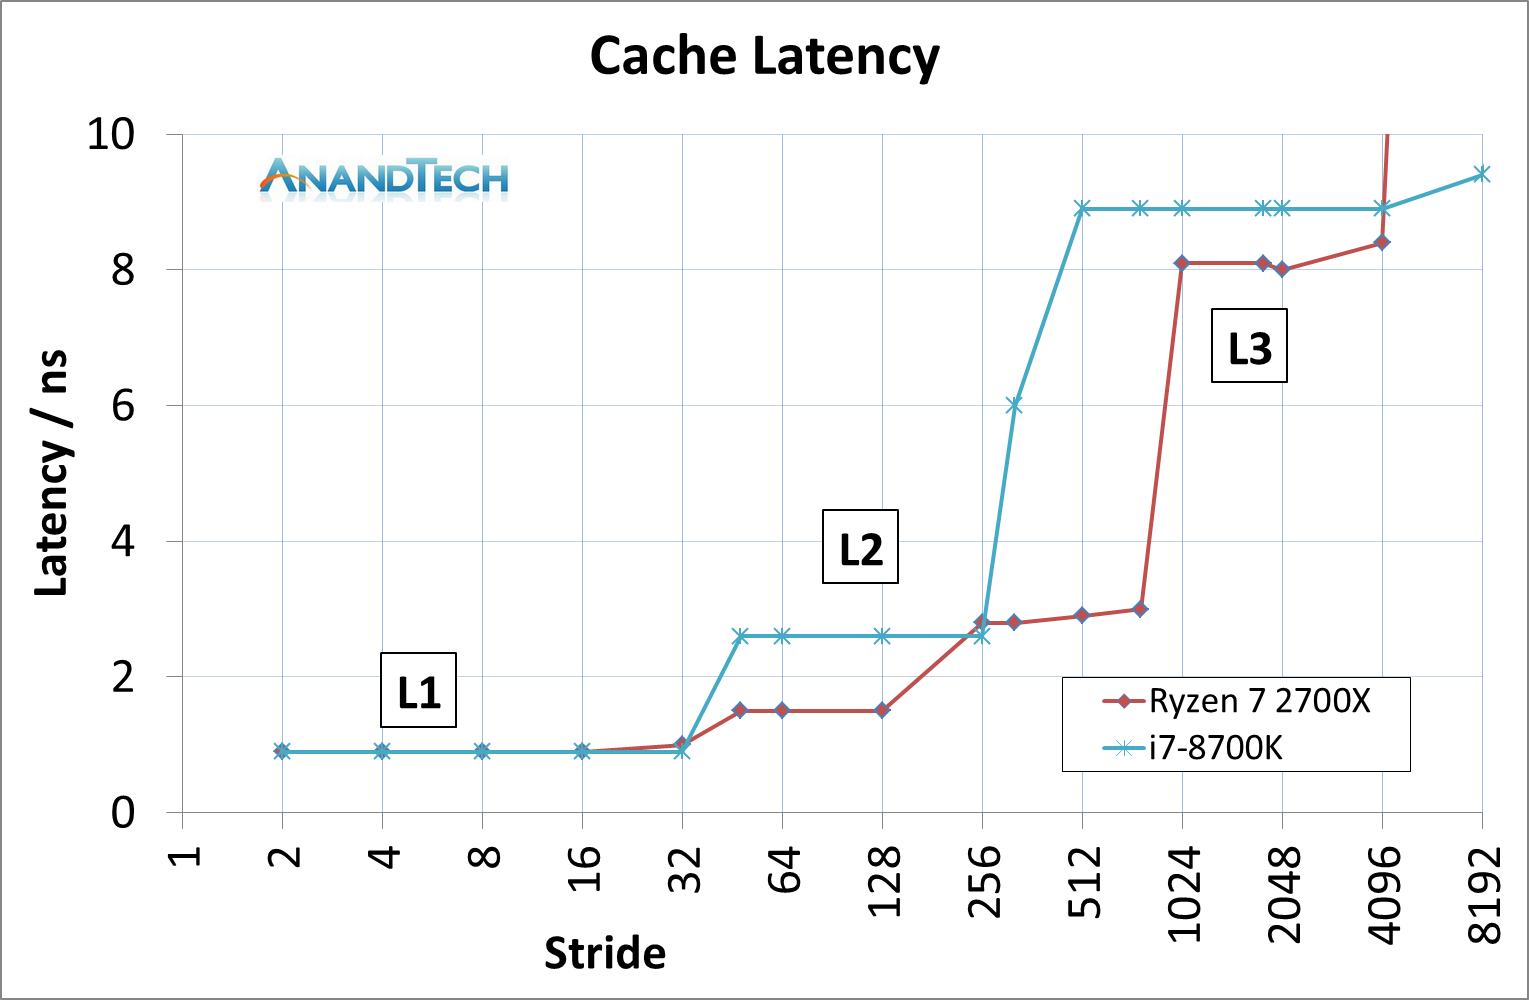
This was an unexpected result, but we can see clearly that AMD has a latency timing advantage across the L2 and L3 caches. There is a sizable difference in DRAM, however the core performance metrics are here in the lower caches.
We can expand this out to include the three AMD chips, as well as Intel’s Coffee Lake and Kaby Lake cores.

This is a graph using cycles rather than timing latency: Intel has a small L1 advantage, however the larger L2 caches in AMD’s Zen designs mean that Intel has to hit the higher latency L3 earlier. Intel makes quick work of DRAM cycle latency however.
Translating to IPC: All This for 3%?
Contrary to popular belief, increasing IPC is difficult. Attempt to ensure that each execution port is fed every cycle requires having wide decoders, large out-of-order queues, fast caches, and the right execution port configuration. It might sound easy to pile it all on, however both physics and economics get in the way: the chip still has to be thermally efficient and it has to make money for the company. Every generational design update will go for what is called the ‘low-hanging fruit’: the identified changes that give the most gain for the smallest effort. Usually reducing cache latency is not always the easiest task, and for non-semiconductor engineers (myself included), it sounds like a lot of work for a small gain.
For our IPC testing, we use the following rules. Each CPU is allocated four cores, without extra threading, and power modes are disabled such that the cores run at a specific frequency only. The DRAM is set to what the processor supports, so in the case of the new CPUs, that is DDR4-2933, and the previous generation at DDR4-2666. I have recently seen threads which dispute if this is fair: this is an IPC test, not an instruction efficiency test. The DRAM official support is part of the hardware specifications, just as much as the size of the caches or the number of execution ports. Running the two CPUs at the same DRAM frequency gives an unfair advantage to one of them: either a bigger overclock/underclock, and deviates from the intended design.
So in our test, we take the new Ryzen 7 2700X, the first generation Ryzen 7 1800X, and the pre-Zen Bristol Ridge based A12-9800, which is based on the AM4 platform and uses DDR4. We set each processors at four cores, no multi-threading, and 3.0 GHz, then ran through some of our tests.
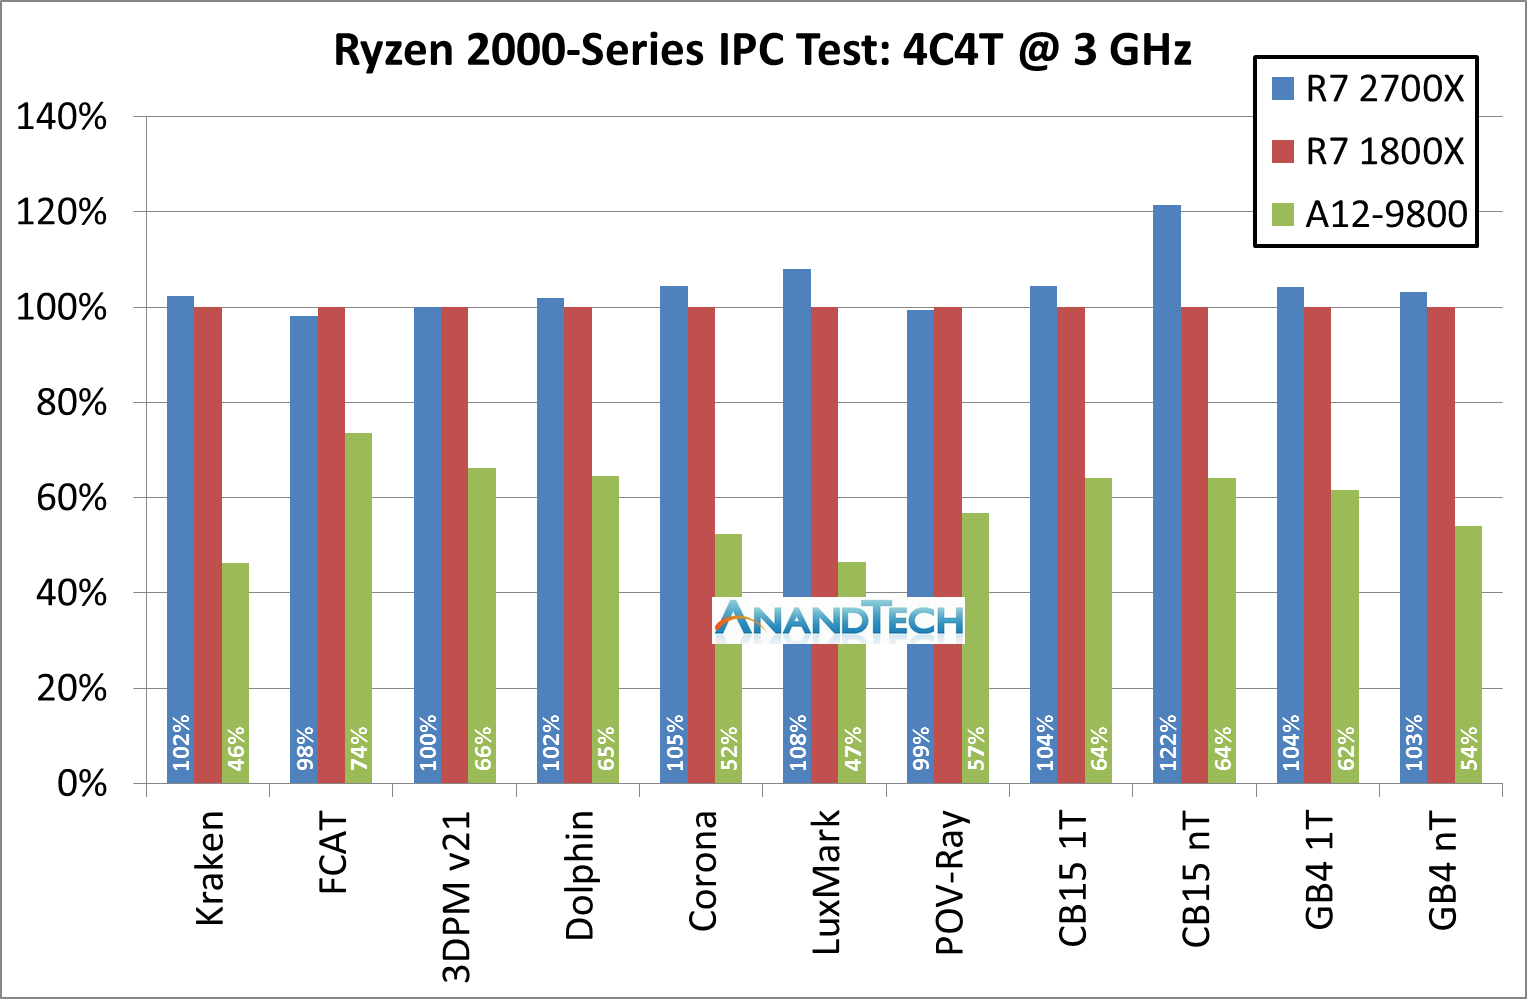
For this graph we have rooted the first generation Ryzen 7 1800X as our 100% marker, with the blue columns as the Ryzen 7 2700X. The problem with trying to identify a 3% IPC increase is that 3% could easily fall within the noise of a benchmark run: if the cache is not fully set before the run, it could encounter different performance. Shown above, a good number of tests fall in that +/- 2% range.
However, for compute heavy tasks, there are 3-4% benefits: Corona, LuxMark, CineBench and GeekBench are the ones here. We haven’t included the GeekBench sub-test results in the graph above, but most of those fall into the 2-5% category for gains.
If we take out Cinebench R15 nT result and the Geekbench memory tests, the average of all of the tests comes out to a +3.1% gain for the new Ryzen 2700X. That sounds bang on the money for what AMD stated it would do.
Cycling back to that Cinebench R15 nT result that showed a 22% gain. We also had some other IPC testing done at 3.0 GHz but with 8C/16T (which we couldn’t compare to Bristol Ridge), and a few other tests also showed 20%+ gains. This is probably a sign that AMD might have also adjusted how it manages its simultaneous multi-threading. This requires further testing.
AMD’s Overall 10% Increase
With some of the benefits of the 12LP manufacturing process, a few editors internally have questioned exactly why AMD hasn’t redesigned certain elements of the microarchitecture to take advantage. Ultimately it would appear that the ‘free’ frequency boost is worth just putting the same design in – as mentioned previously, the 12LP design is based on 14LPP with performance bump improvements. In the past it might not have been mentioned as a separate product line. So pushing through the same design is an easy win, allowing the teams to focus on the next major core redesign.
That all being said, AMD has previously already stated its intentions for the Zen+ core design – rolling back to CES at the beginning of the year, AMD stated that they wanted Zen+ and future products to go above and beyond the ‘industry standard’ of a 7-8% performance gain each year.
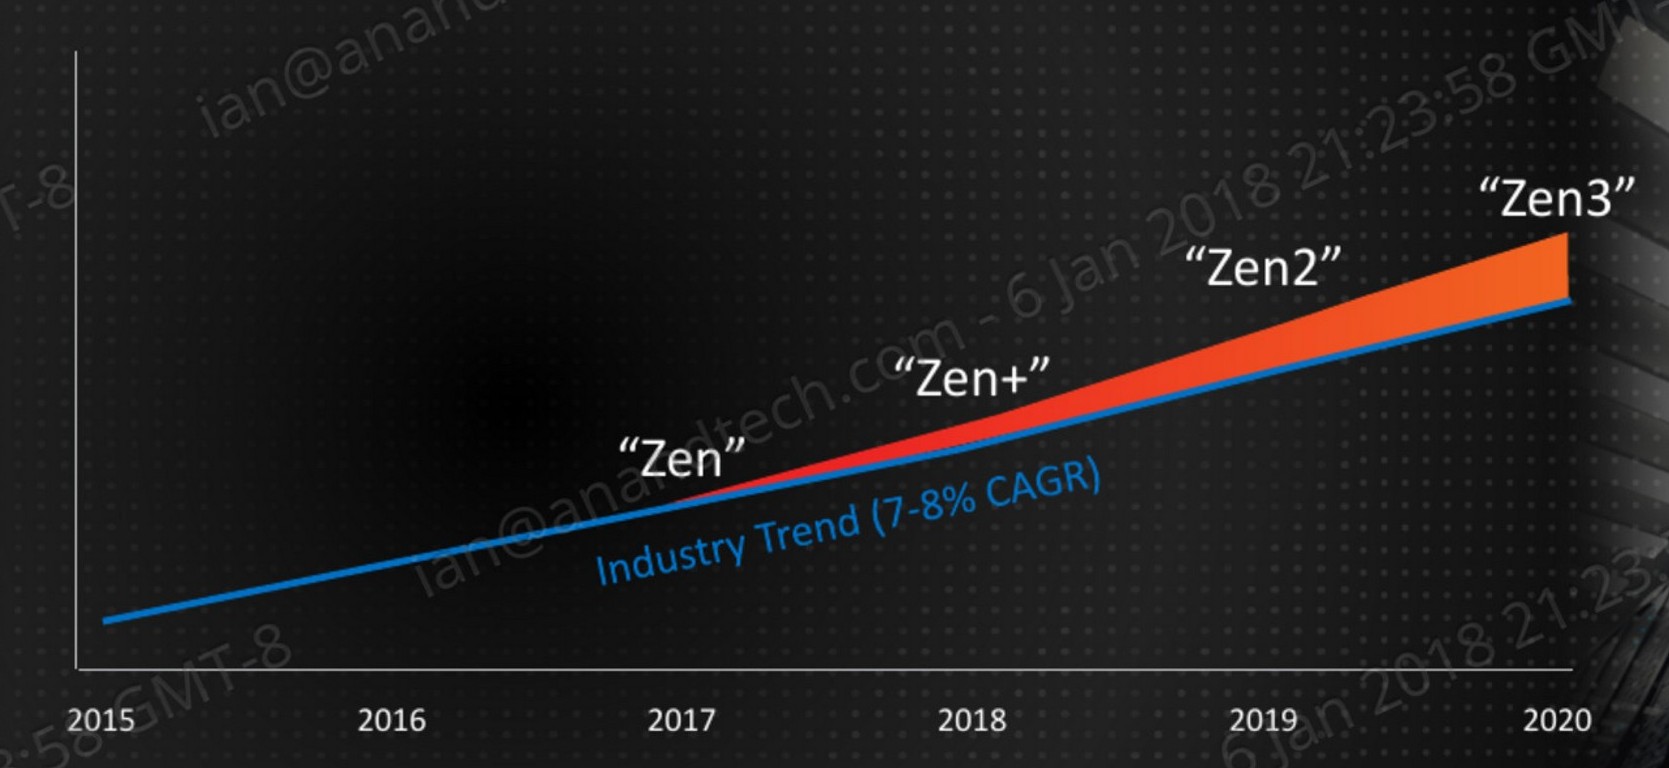
Clearly 3% IPC is not enough, so AMD is combining the performance gain with the +250 MHz increase, which is about another 6% peak frequency, with better turbo performance with Precision Boost 2 / XFR 2. This is about 10%, on paper at least. Benchmarks to follow.
Precision Boost 2 and XFR2: Ensuring It Hertz More
One of the biggest changes for the new Ryzen-2000 series is in how the processor implements its turbo. Up until this point (except the recent APU launch), processors have relied on a step function implementation: the system determines how many threads are loaded, attempts to implement a specific frequency on those cores if possible, and then follows the look-up table relating thread count to frequency. AMD’s goal in Precision Boost 2 is to make this process more dynamic.
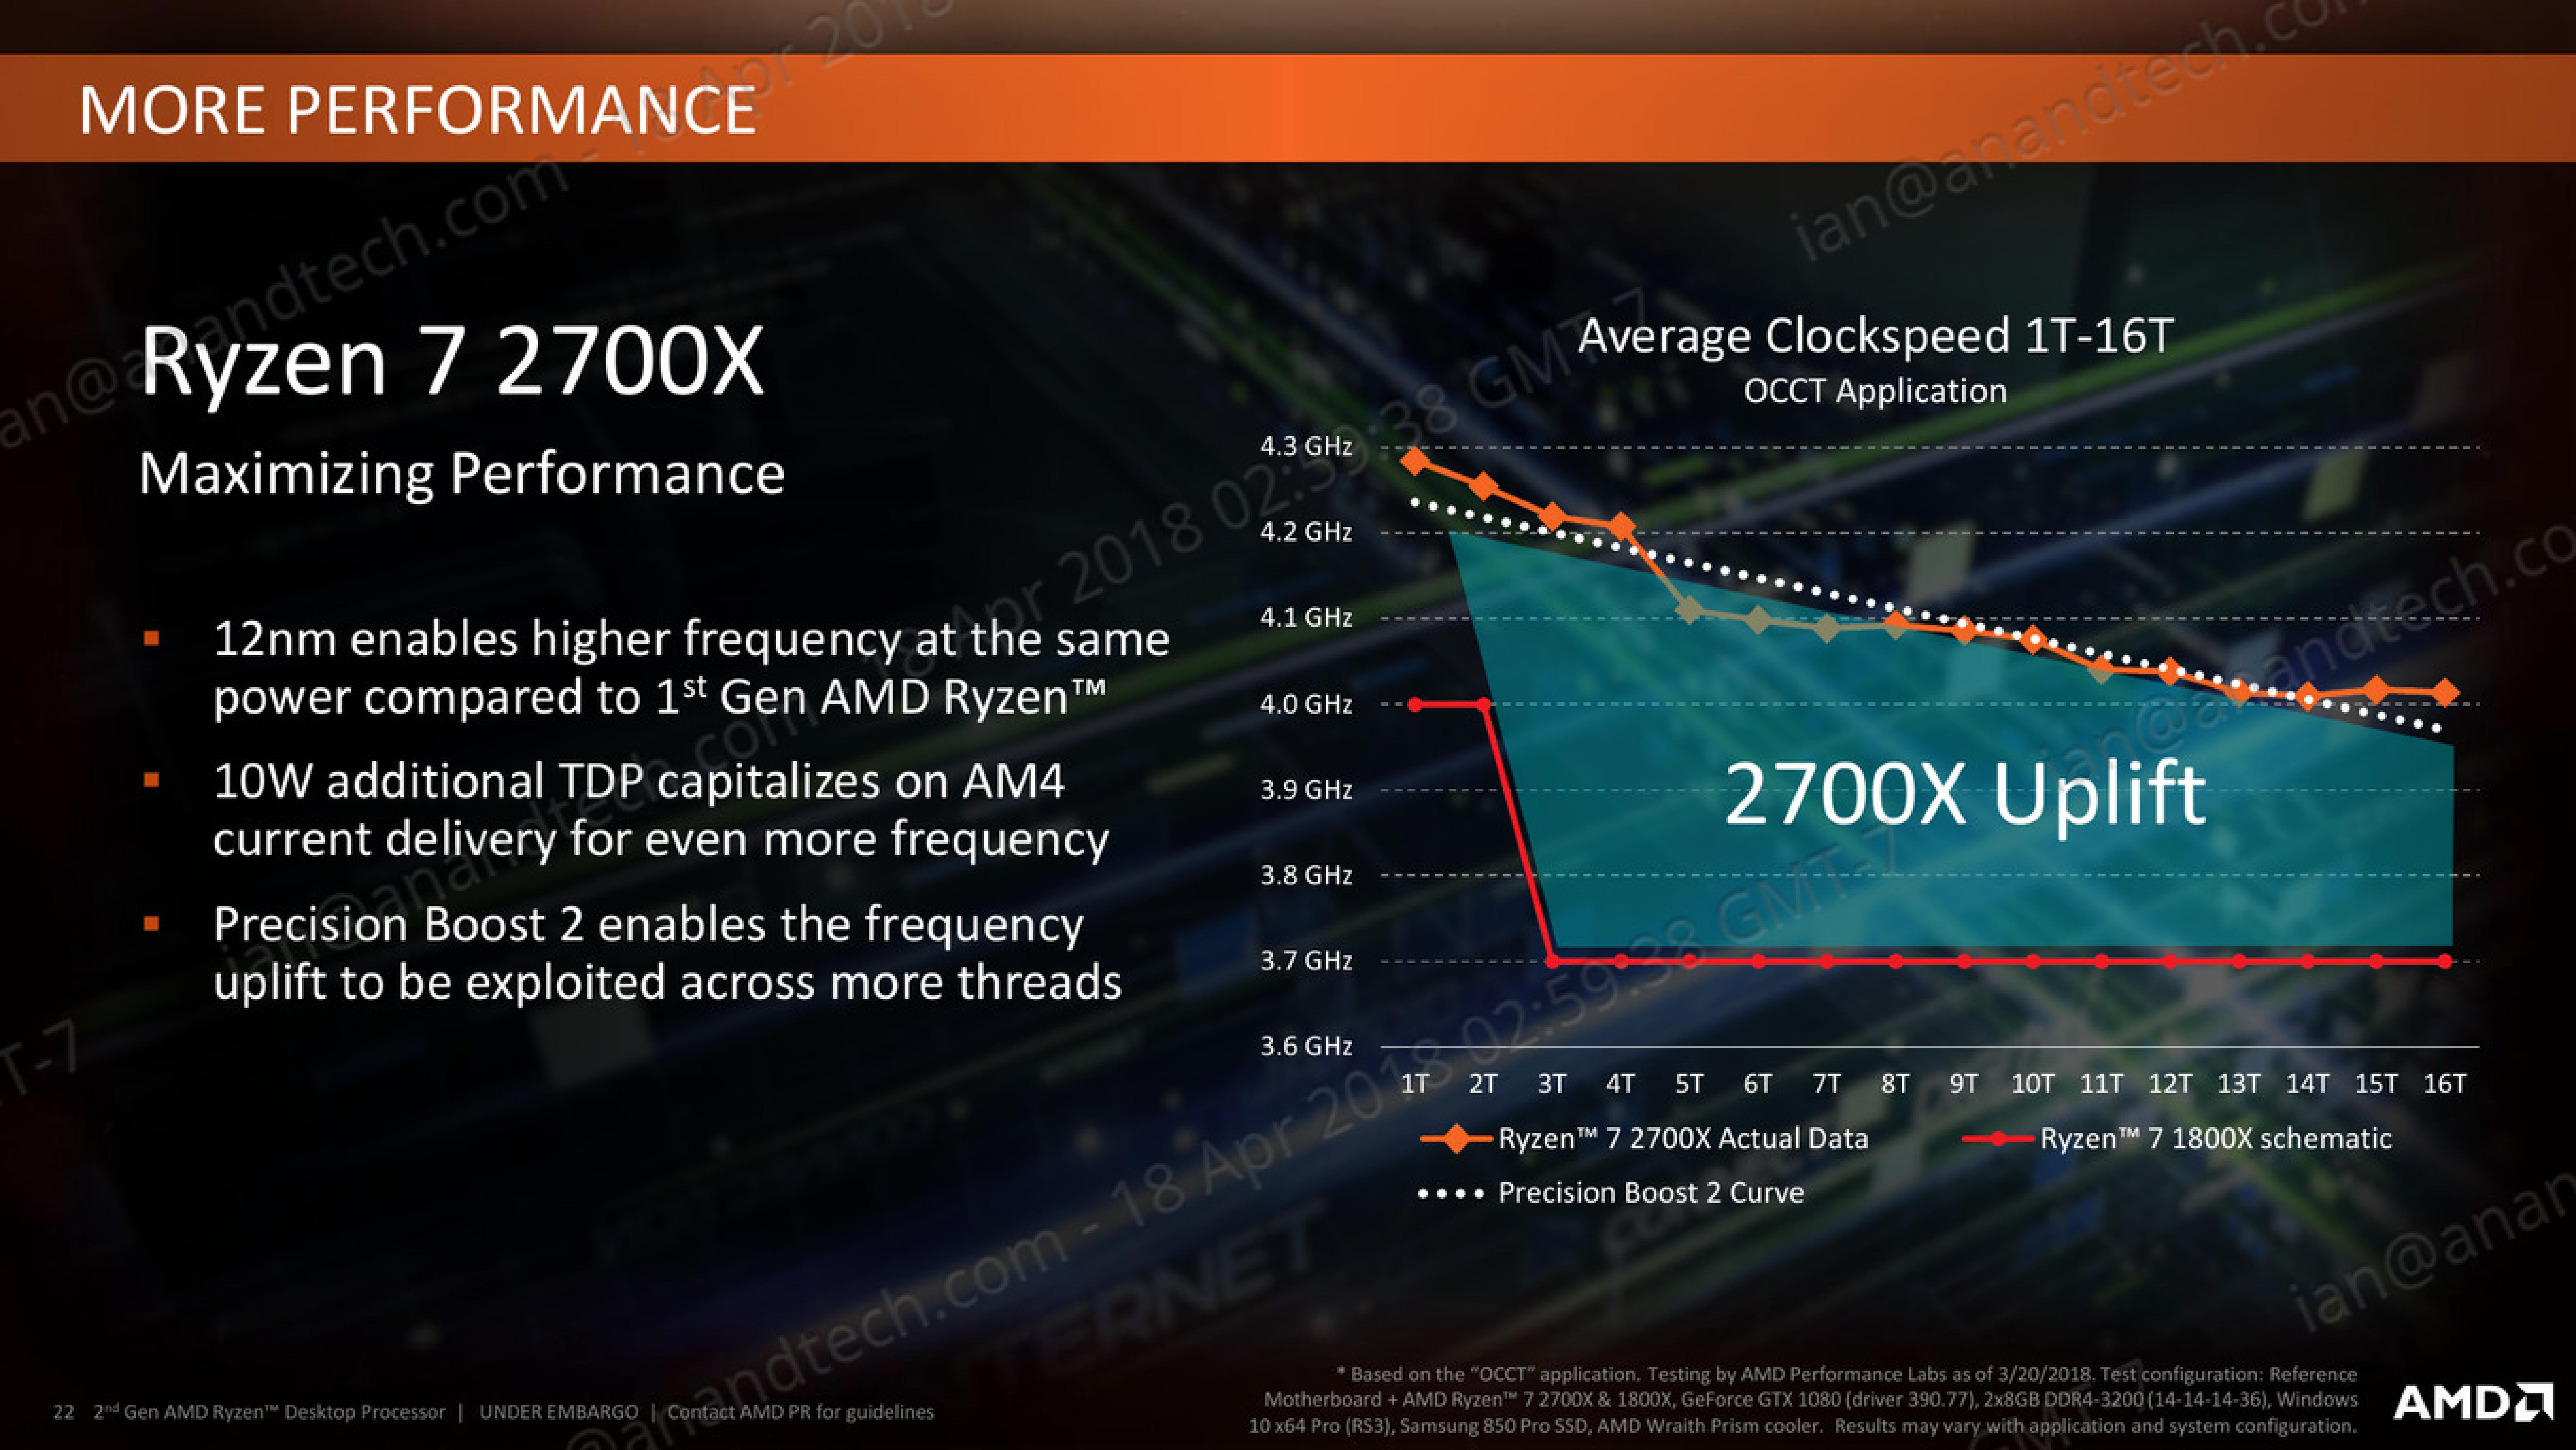
This image from AMD is how the feature is being represented: the system will determine how much of the power budget is still available, and turbo as much as possible until it hits one of the limiting factors. These factors can be any of, but not limited to, the following:
- Total chip peak power
- Individual core voltage/frequency response
- Thermal interactions between neighboring cores
- Power delivery limitations to individual cores/groups of cores
- Overall thermal performance
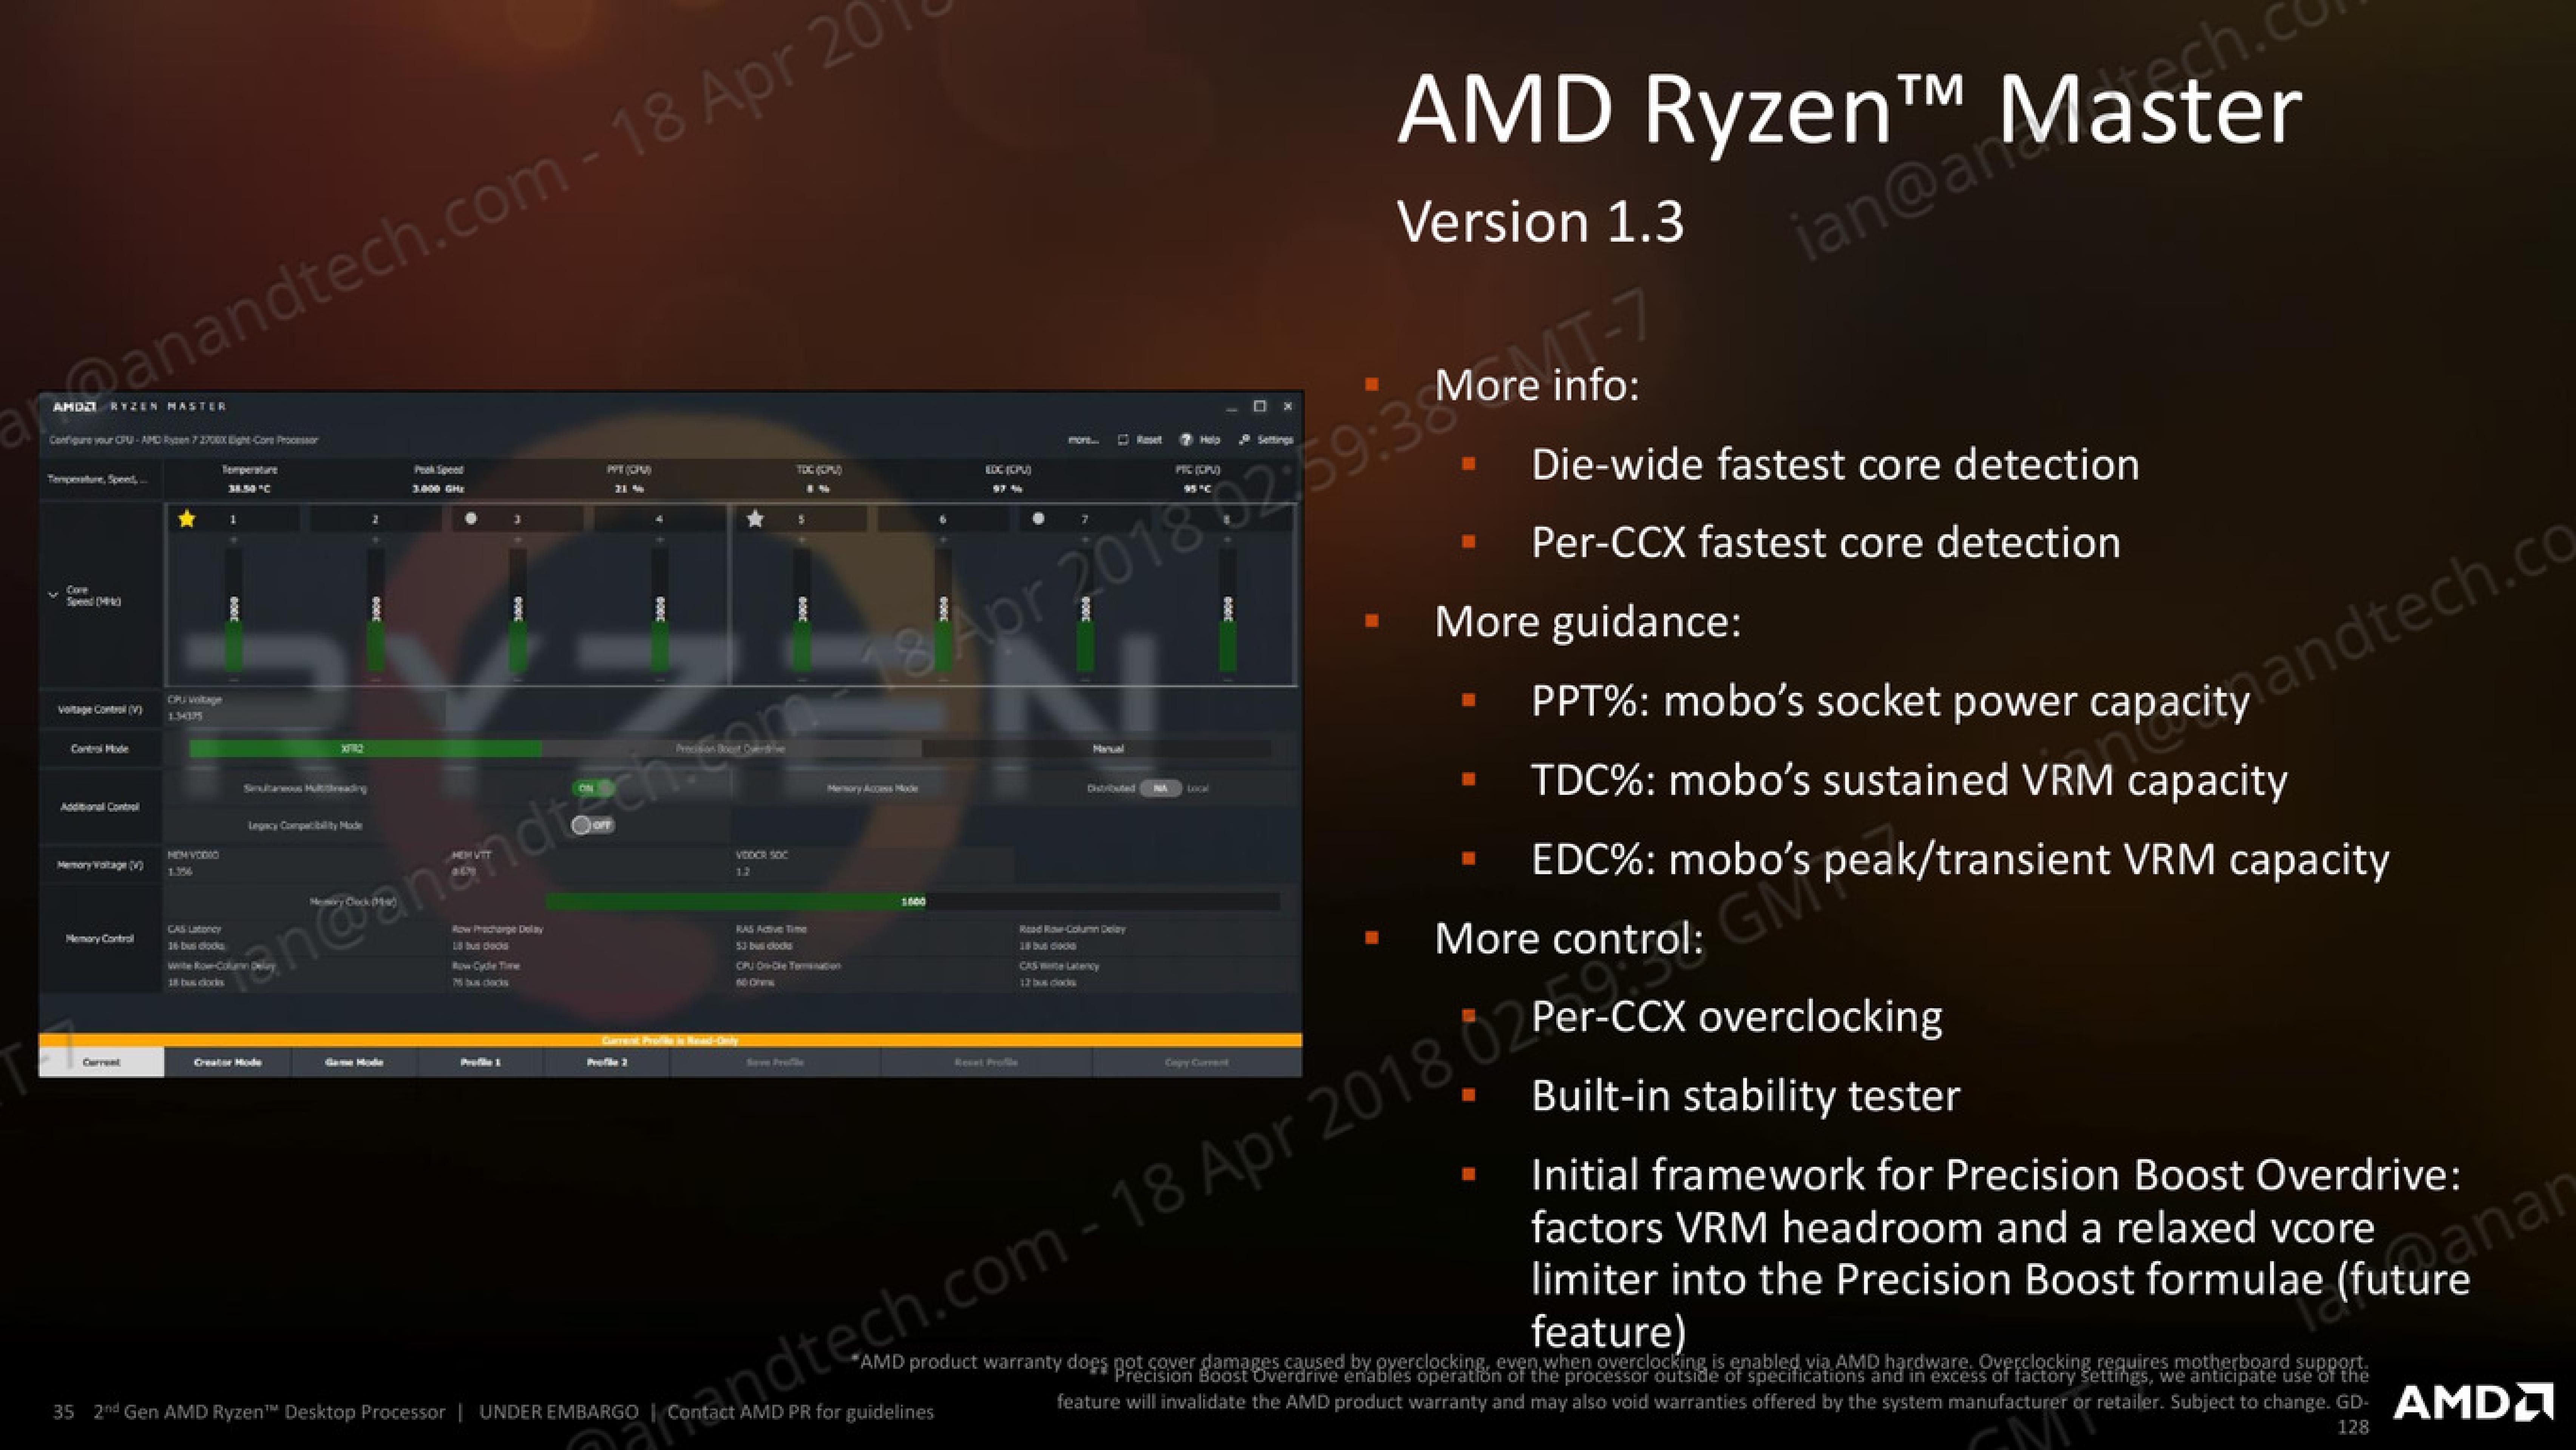
AMD’s new Ryzen Master 1.3 software, when used on a Ryzen 2000-series processor, has several indicators to determine what the limiting factors are. For the most part, the way the processor will boost and respond to the environment, will be transparent to the user.
The best way to test this in action, from my perspective, is to look at the power draw of the first generation and second generation Ryzen processors. We can examine the internal estimated power consumption of each core individually as thankfully AMD has left these registers exposed, to give the following data:
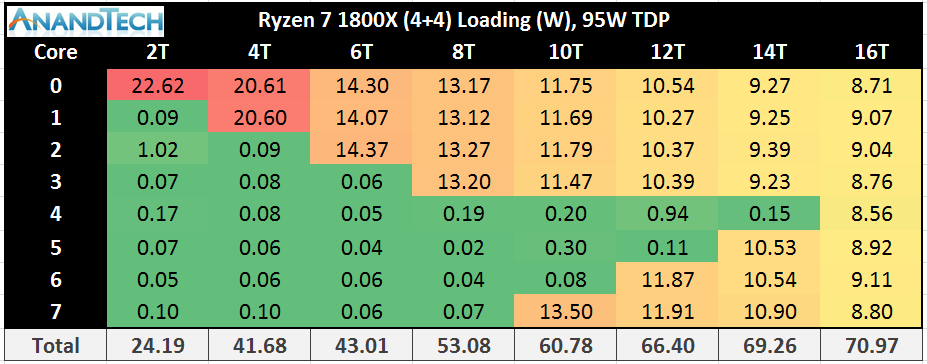
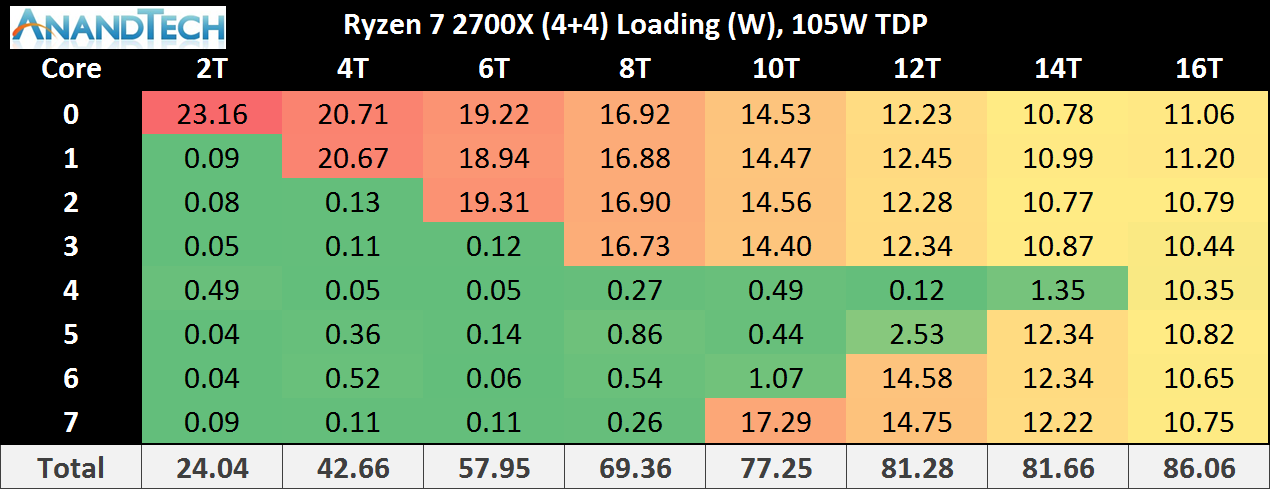
This is only the core consumption power, not the package power, which would include the DRAM controller, the Infinity Fabric, and the processor IO. This means we get numbers different to the rated TDP, but the danger here is that because the Ryzen 7 2700X has a 10W TDP higher than the Ryzen 7 1800X, where the 2700X draws more power it could seem as if that is the TDP response.
Just plotting the power consumption gives this graph:
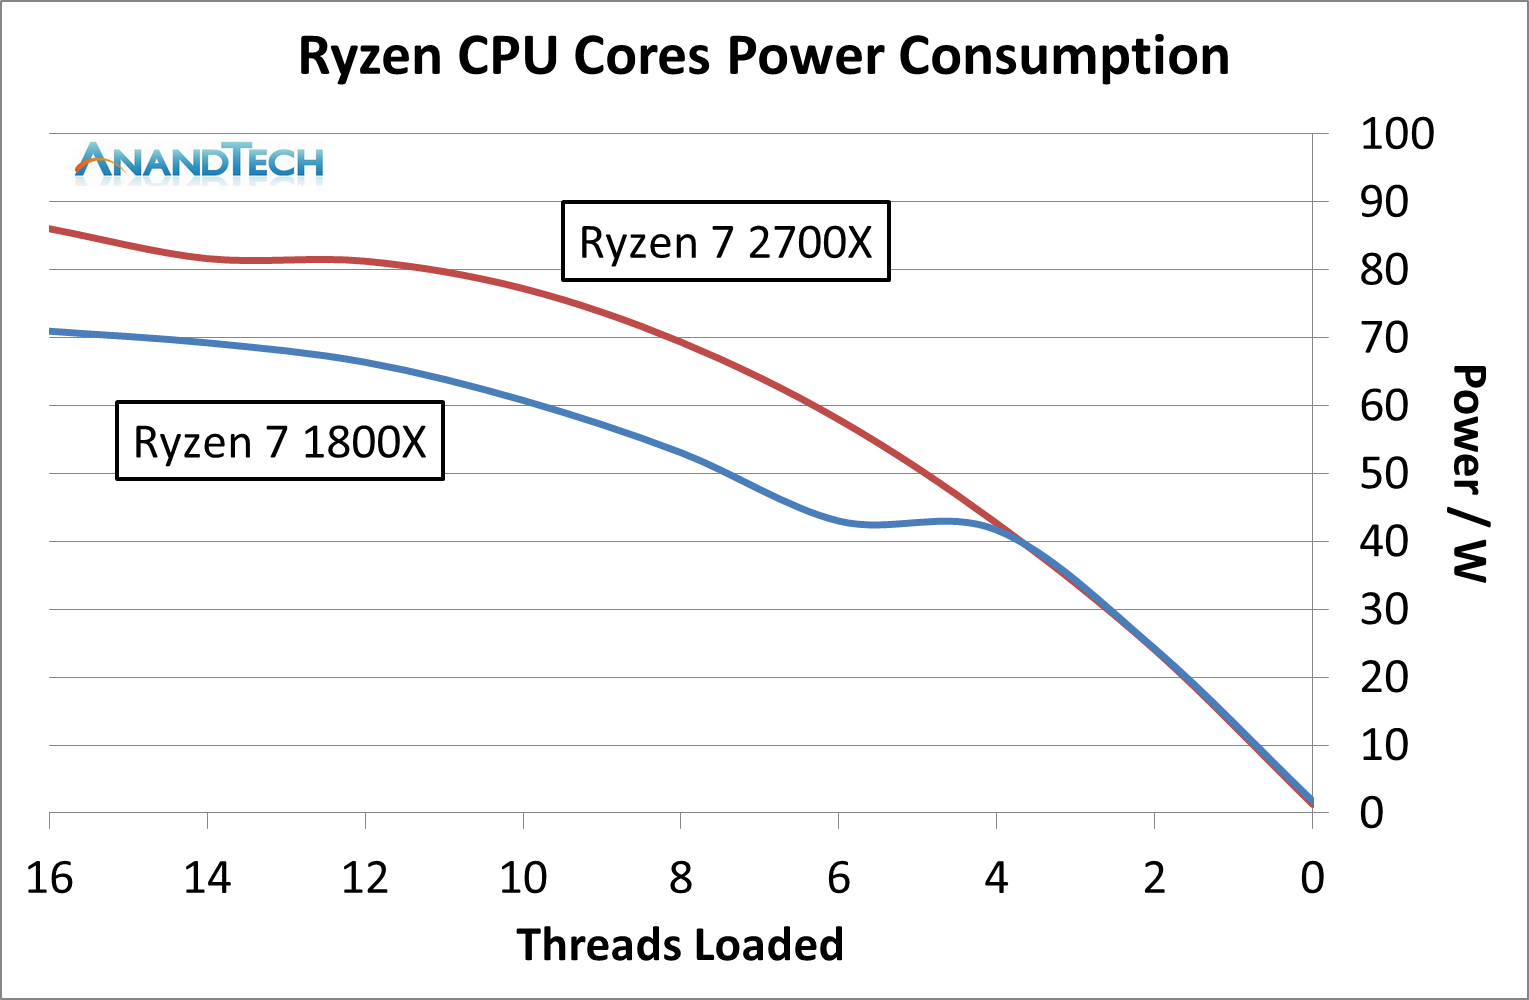
Even in this case it is clear that the Ryzen 7 2700X is drawing more power, up to 20W more, for a variable threaded load. If we change the graph to be a function of peak power:
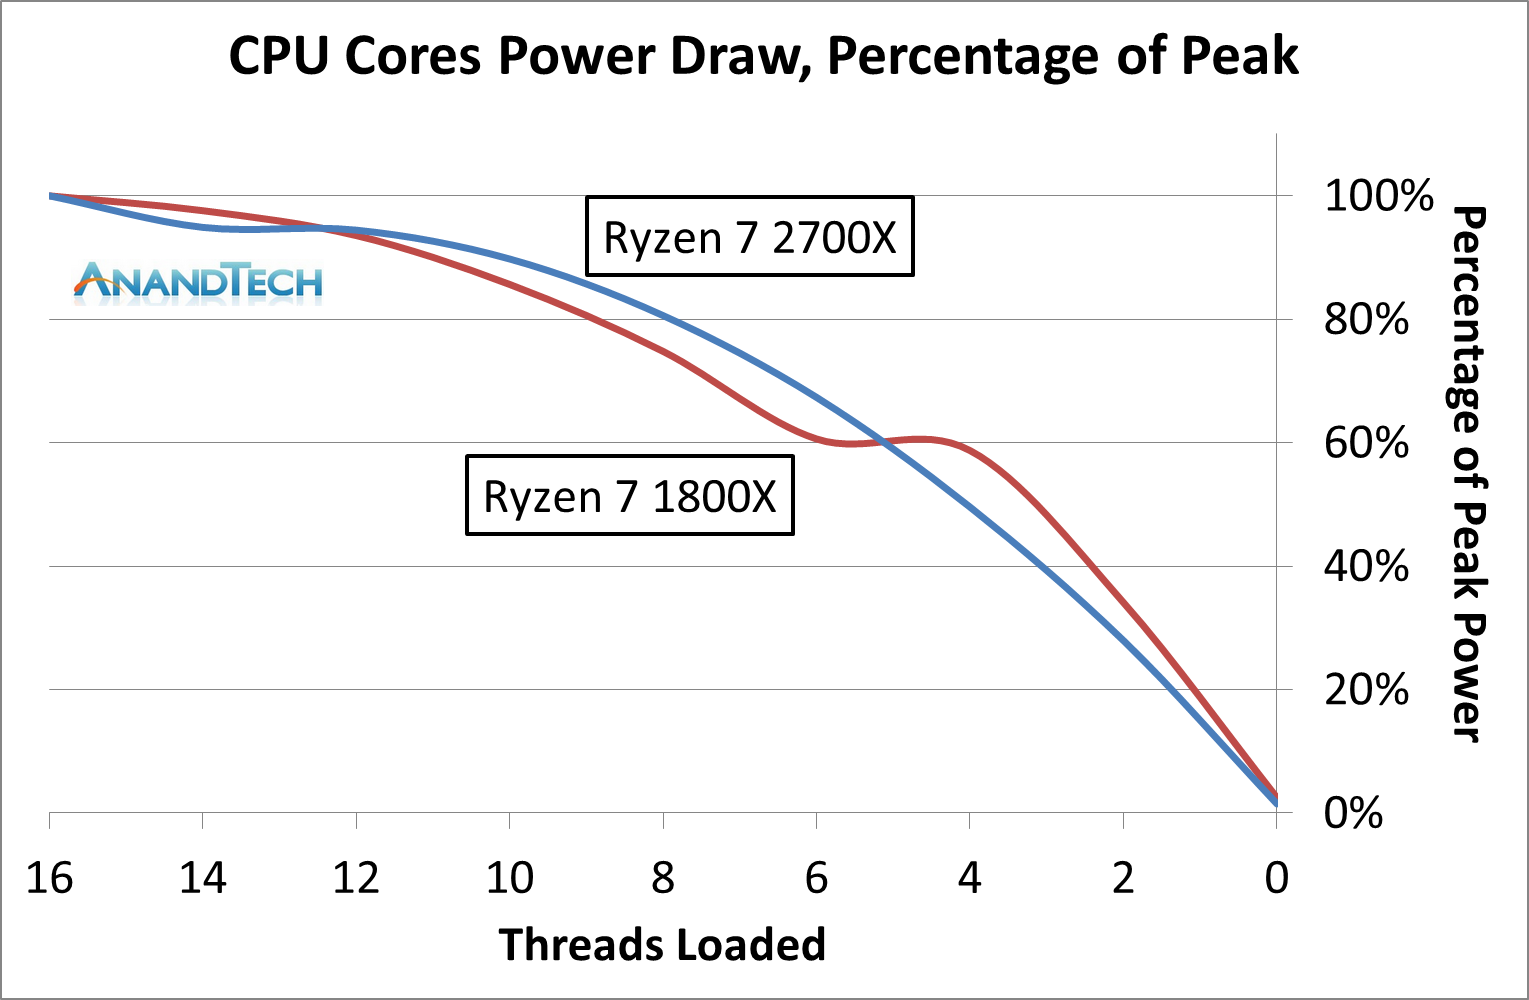
The results are not quite as clear: it would seem that the 1800X draws, as a percentage of peak power, more at low thread count, but the 2700X draws more at a middling thread count.
It is worth noting that the end result of Precision Boost 2 is two-fold: more performance, but also more power consumption. Users looking to place one of the lower powered processors into a small form factor system might look at disabling this feature and returning to a standard step-function response in order to keep the thermal capabilities in check.
A side note – despite the marketing name being called ‘Precision Boost 2’, the internal BIOS name is called ‘Core Performance Boost’. It sounds similar to Multi-Core Enhancement, which is a feature on some Intel motherboards designed to go above and beyond the turbo mechanism. However, this is just AMD’s standard PB2: disabling it will disable PB2. Initially we turned it off, thinking it was a motherboard manufacturer tool, only to throw away some testing because there is this odd disconnect between AMD’s engineers and AMD’s marketing.
Extended Frequency Range 2 (XFR2)
For the Ryzen 2000-series, AMD has changed what XFR does. In the previous generation it was applied on certain processors to allow them to boost above the maximum turbo frequency when the thermal situation was conducive to higher frequencies and higher voltage in low thread-count states. For this generation, it still relates to thermals, however the definition is applied to any core loading: if the CPU is under 60ºC, the processor can boost no matter what the loading is above its Precision Boost 2 frequency (so why not get a better PB2 implementation?). The core still has to be within a suitable voltage/frequency window to retain stability, however.
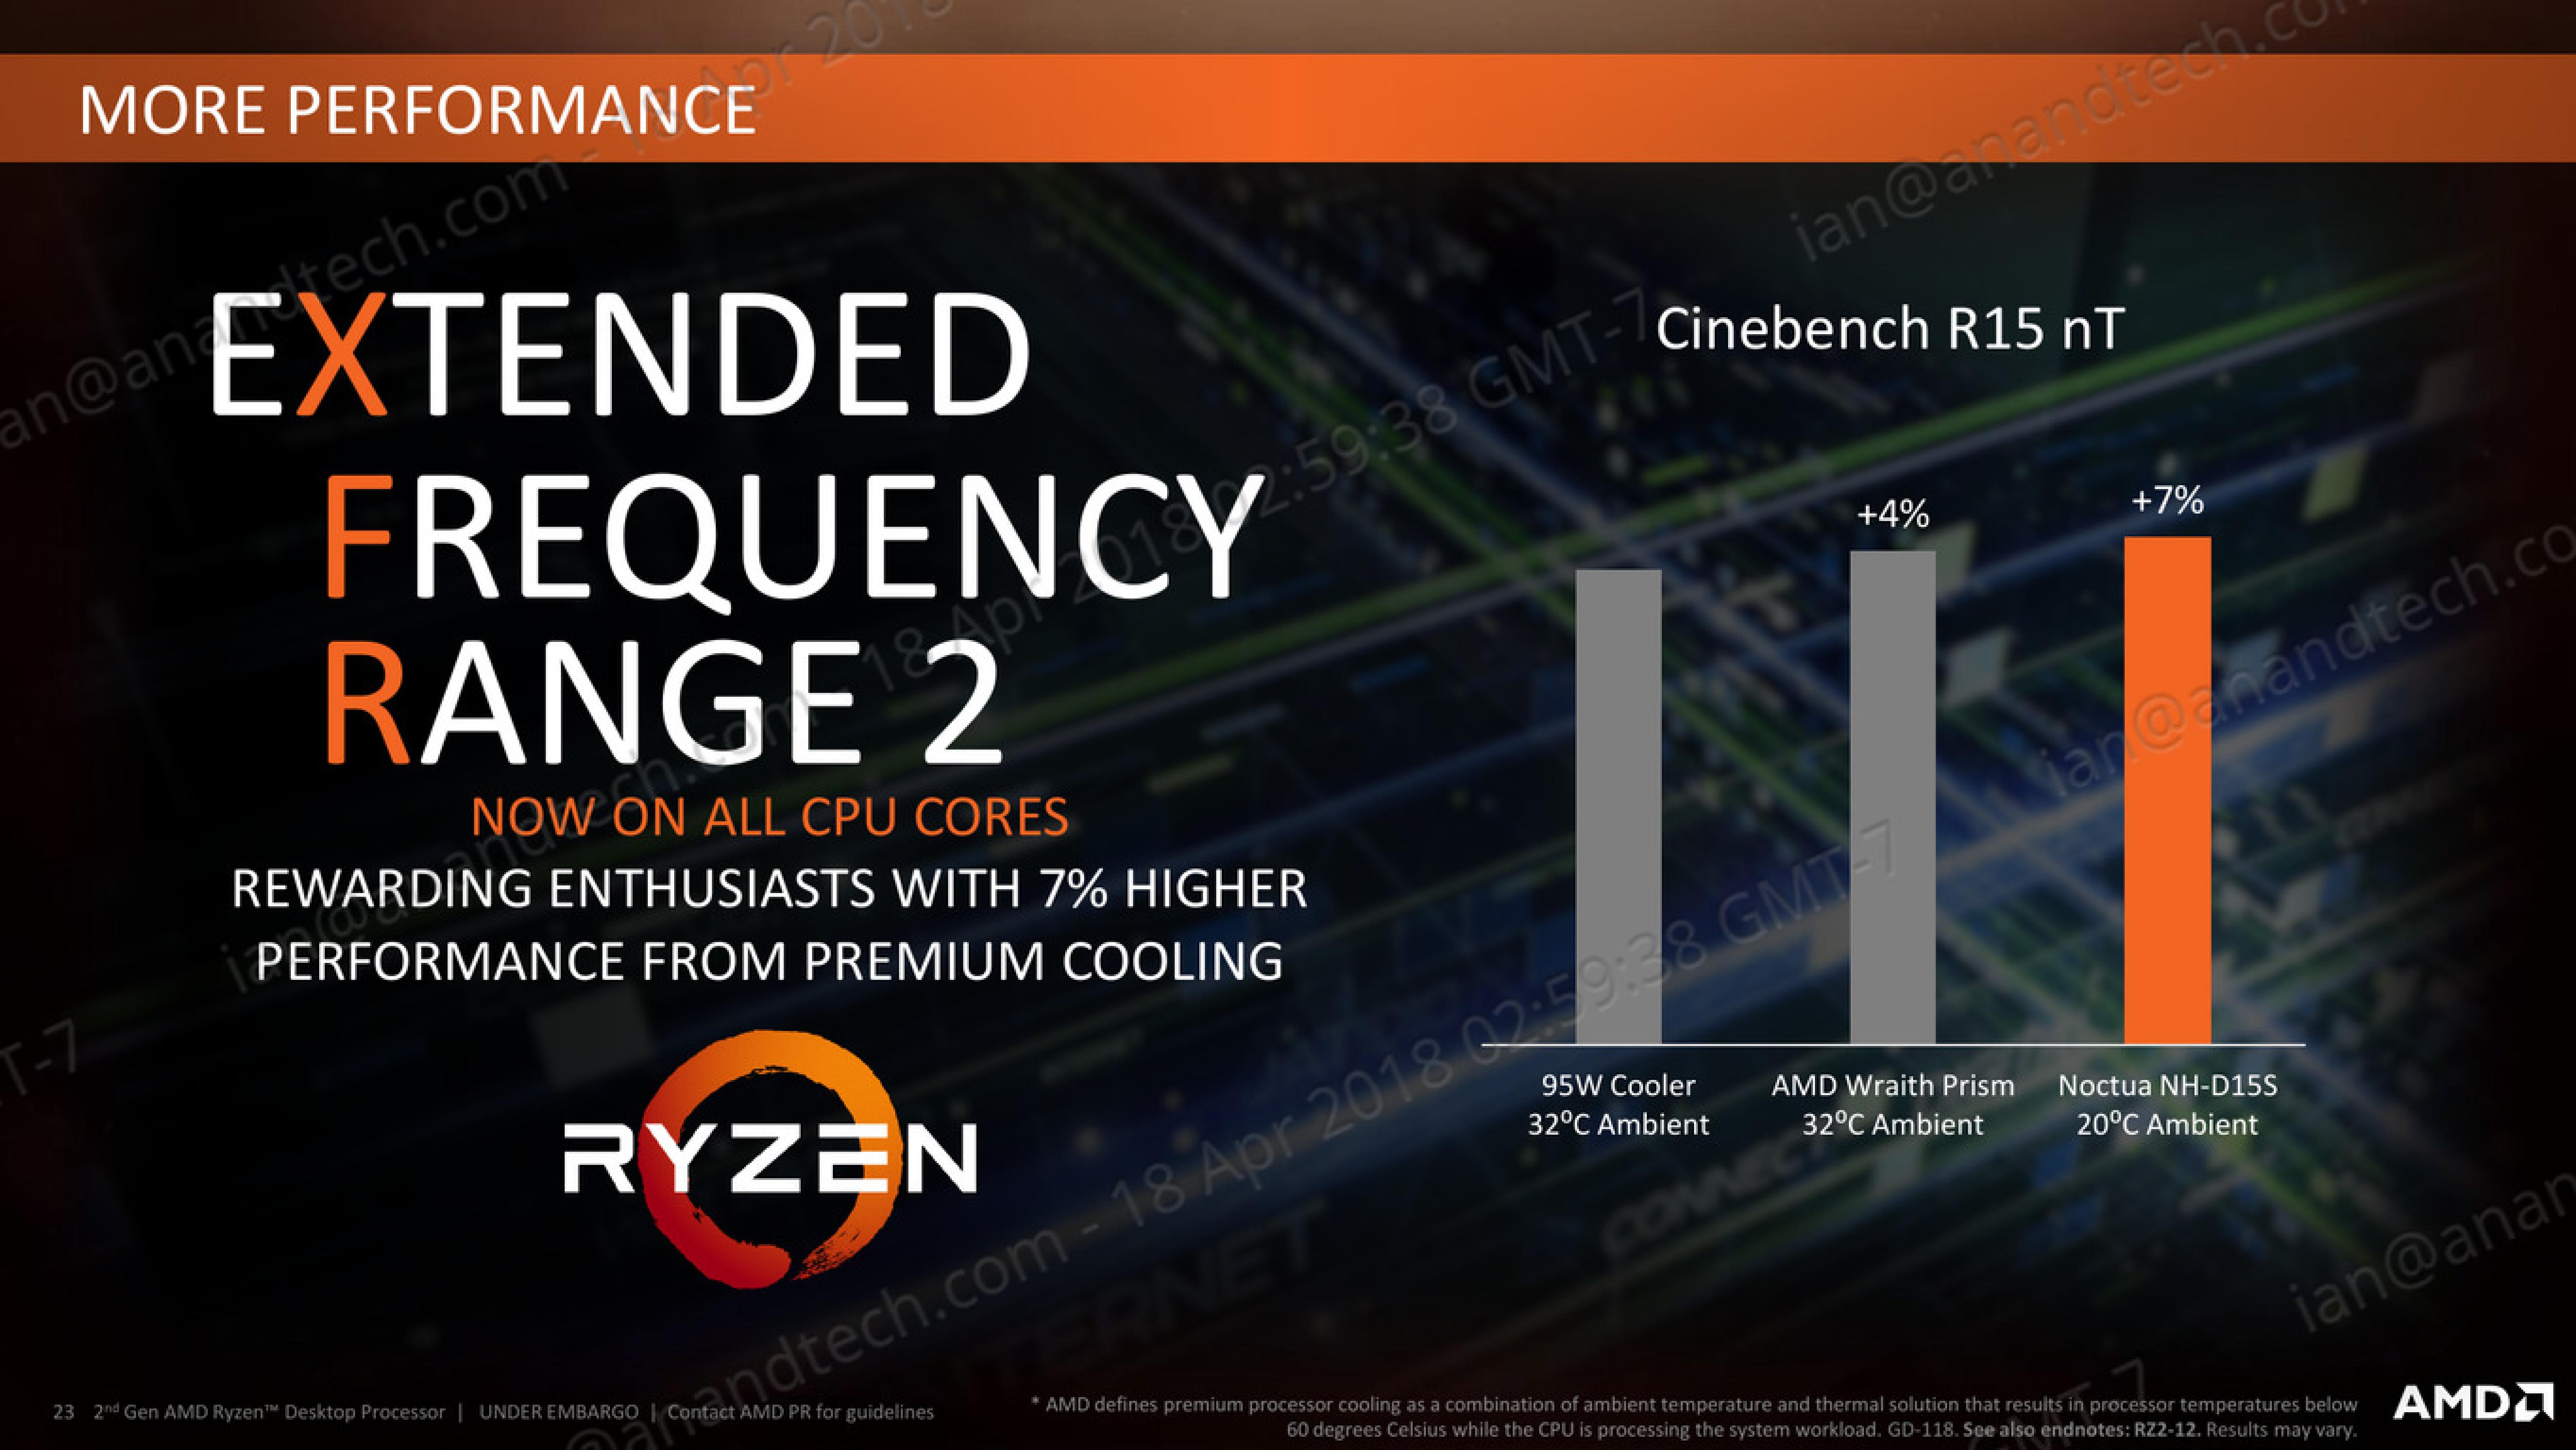
On certain motherboards, like the ASUS Crosshair VII Hero, there are additional options to assist XFR2 beyond AMD’s implementation. ASUS does not go into specific details, however I suspect it implements a more aggressive version, perhaps extending the voltage/frequency curve, raising the power limits, and/or adjusting the thermal limit.
New X470 Chipset and Motherboards
A Focus on Power
For our reviews, AMD shipped us two motherboards: the ASUS ROG Crosshair VII Hero (Wi-Fi) and the MSI X470 Gaming M7 AC. These will be two of the high-end halo motherboards to focus on the new X470 chipset.
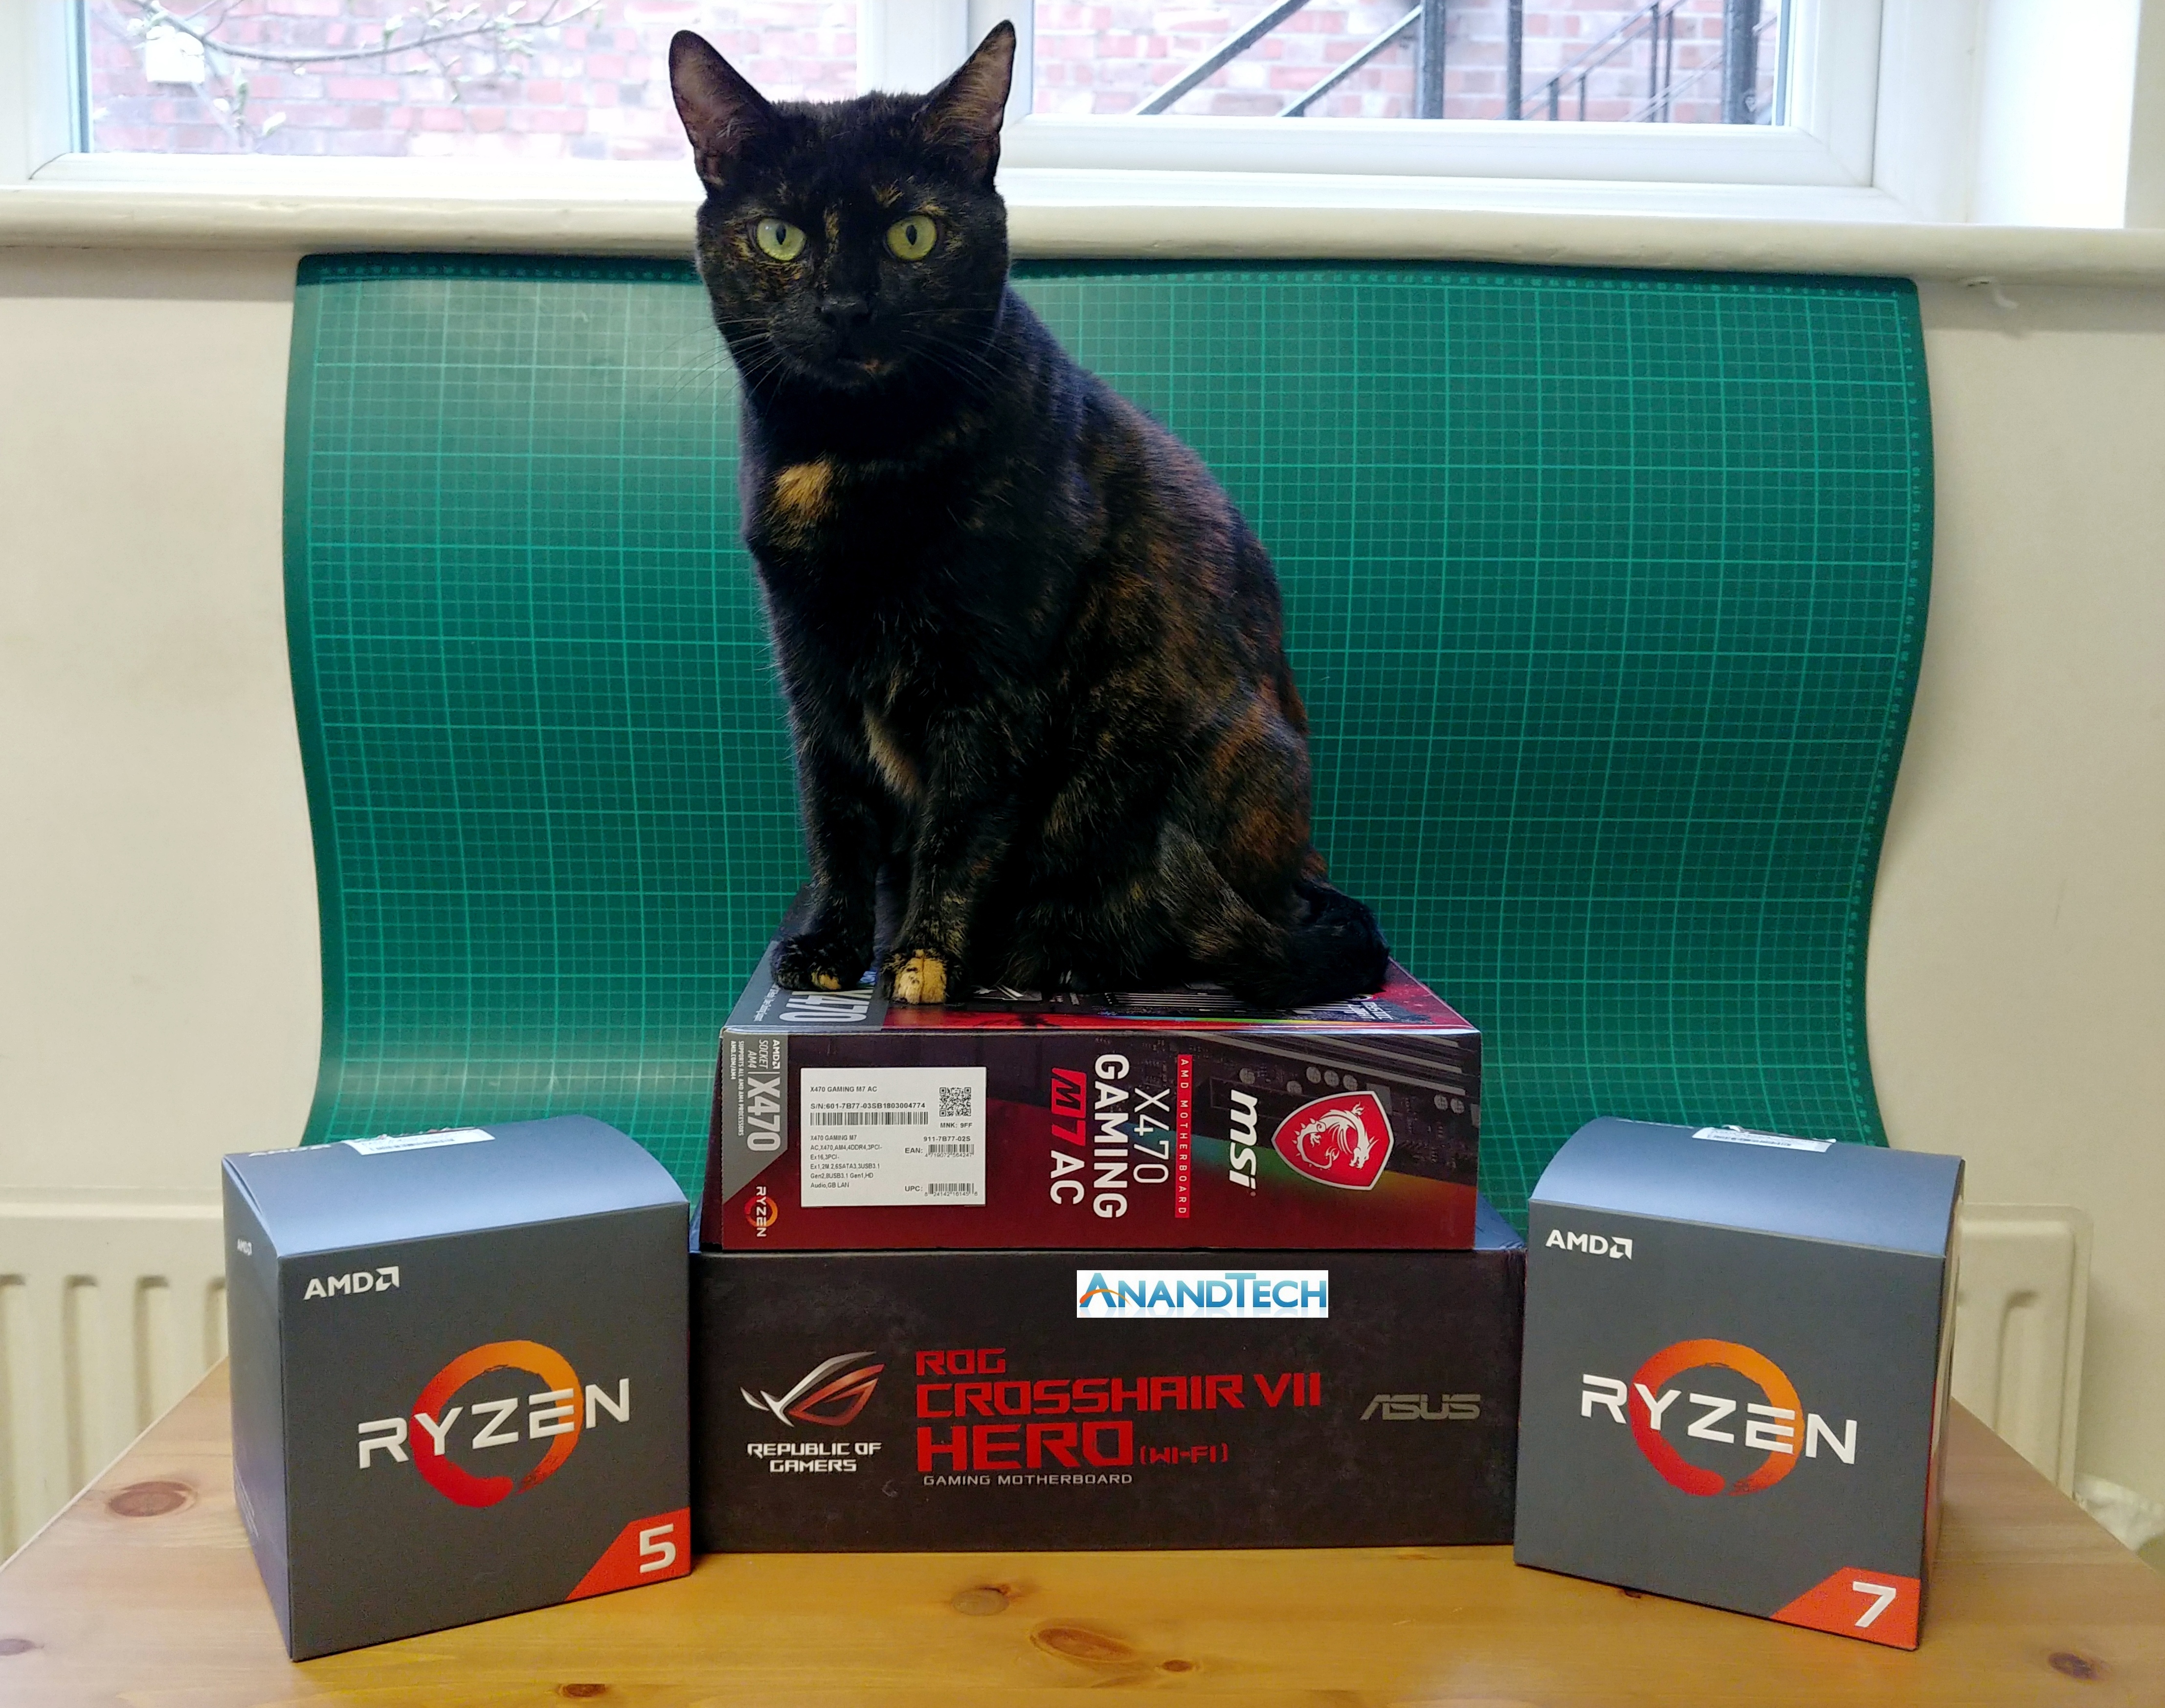
Katamari loves motherboards. Or just loves sitting on my review samples. (ed: it's the latter)
The new X470 chipset is designed to sit above the X370 chipset, although looking at the specifications, users might be forgiven for not seeing a difference. Technically the X470 part has identical PCIe and SATA support to the older X370 chipset, and for a while AMD will be running both chipsets concurrently for the main motherboard manufacturers to use. Both sets of boards will be using the AM4 chipset, which AMD has guaranteed to support for several generations now.
| AMD AM4 Chipsets AnandTech |
|||||||||||||
| DDR4 | OC | USB | SATA | PCIe 2.0 |
GPU | XFR2 PB2 |
StoreMI | TDP | RAID SATA |
RAID NVMe |
|||
| 3.1 | 3.0 | 2.0 | |||||||||||
| X470 | 2933 | Y | 2 | 6 | 6 | 6 | 8 | x8/x8 | Y | Y | 4.8W | 0,1,10 | |
| X370 | 2667 | Y | 2 | 6 | 6 | 6 | 8 | x8/x8 | N | N | 6.8W | 0,1,10 | |
| B350 | 2667 | Y | 2 | 2 | 6 | 4 | 6 | x16 | N | N | 6.8W | 0,1,10 | |
| A320 | 2667 | N | 1 | 2 | 6 | 4 | 4 | x16 | N | N | 6.8W | 0,1,10 | - |
| Embedded | |||||||||||||
| X300 | 2667 | Y | 0 | 4 | 0 | 2 | 4 | x8/x8 | N | N | ? | 0,1 | - |
| B300 | 2667 | N | 0 | 4 | 0 | 2 | 4 | x16 | N | N | ? | 0,1 | - |
| A300 | 2667 | N | 0 | 4 | 0 | 2 | 4 | x16 | N | N | ? | 0,1 | - |
The big change in the chipset will be in the power consumption. Currently the X370 chipset, built on a 55nm manufacturing process using ASMedia IP, runs at a 6.8W TDP (running at full load). For X470, we were told that this is the same process and IP, but the chip will now run at 4.8W peak and 1.9W in an idle mode. This is due to an improved power infrastructure within the chip, and AMD also claims that overall throughput is improved. The chipset firmware is also set to provide better memory OC support and stability.
The other factor in this is StoreMI, on the next page. This new feature technically does not require chipset support, however the free installer will check for the presence of an X470 chipset before providing a free license, otherwise the software will cost $20 and not have AMD branding.
All X470 boards, and X370 boards with the latest BIOS updates, will support the new Ryzen 2nd Gen processors. X370 motherboards that have had the BIOS updated already will have the ‘Ryzen 2000 Desktop Ready’ logo attached on the box, however X470 boards will automatically be covered.
AMD Boot Kits
For users in that buy an X370/B350/A320 motherboard that has old firmware, AMD has a support page to manage the issue. Users should first reach out to the retailer for a replacement board with an updated BIOS, but failing that, users with verified purchases can obtain an “AMD Boot Kit” – a short term loan of an A-series processor with which people can update the BIOS for their new processor.
AMD will supply the kit, free of charge, if the user can:
- Show a picture of the new 300-series motherboard,
- Show a picture of the new Ryzen 2000-series CPU,
- With model numbers / unique serial numbers in shot, and
- A copy of the purchase invoice.
This means that users who want to take advantage of the Boot Kit will have to buy retail components, and buy them second hand. The kit will have an A-series (Bristol Ridge) processor and a cooler, as well as a pre-paid return label for the hardware. Offering a kit like this for a motherboard BIOS update is relatively unheard of, as previously users would have to go through the retailer and pay for an RMA. However, one might suggest that AMD has enough A-series processors in stock for this to not be much of an issue, and the positive reaction from such a service outweighs the sending and return costs.
Users that need a Boot Kit can go to this link to find the official details.
X470 Motherboards
Each manufacturer has already announced a handful of new motherboards for the chipset, although it is clear this is not a full stack.
| X470 Motherboards | |||
| Name | Size | Price Amazon | Price Newegg |
| ASRock | |||
| X470 Master SLI/AC | ATX | - | $150 |
| X470 Gaming K4 | ATX | - | $170 |
| X470 Gaming-ITX/ac | Mini-ITX | - | $180 |
| X470 Taichi | ATX | - | $230 |
| X470 Taichi Ultimate | ATX | - | $300 |
| X470 Master SLI | ATX | - | - |
| ASUS | |||
| TUF X470-Plus Gaming | ATX | $160 | $160 |
| Prime X470-Pro | ATX | - | $185 |
| Strix X470-F Gaming | ATX | - | $215 |
| Strix X470-I Gaming (Wi-Fi) | Mini-ITX | $210 | $210 |
| X470 Crosshair VII Hero | ATX | $280 | $280 |
| X470 Crosshair VII Hero Wi-Fi | ATX | $300 | $300 |
| Biostar | |||
| X470GT8 | ATX | - | - |
| X470GTN | Mini-ITX | - | - |
| GIGABYTE | |||
| X470 Aorus Ultra Gaming | ATX | $140 | $140 |
| X470 Aorus Gaming 5 Wi-Fi | ATX | $180 | $180 |
| X470 Aorus Gaming 7 Wi-Fi | ATX | $240 | $240 |
| MSI | |||
| X470 Gaming Plus | ATX | - | $140 |
| X470 Gaming Pro | ATX | $170 | - |
| X470 Gaming Pro Carbon | ATX | - | $190 |
| X470 Gaming M7 AC | ATX | $260 | $260 |
| X470 Pro Carbon AC | ATX | - | - |
Most vendors will run the X470 and X370 chipsets side by side, with the X470 taking up some of the more premium offerings at this time.
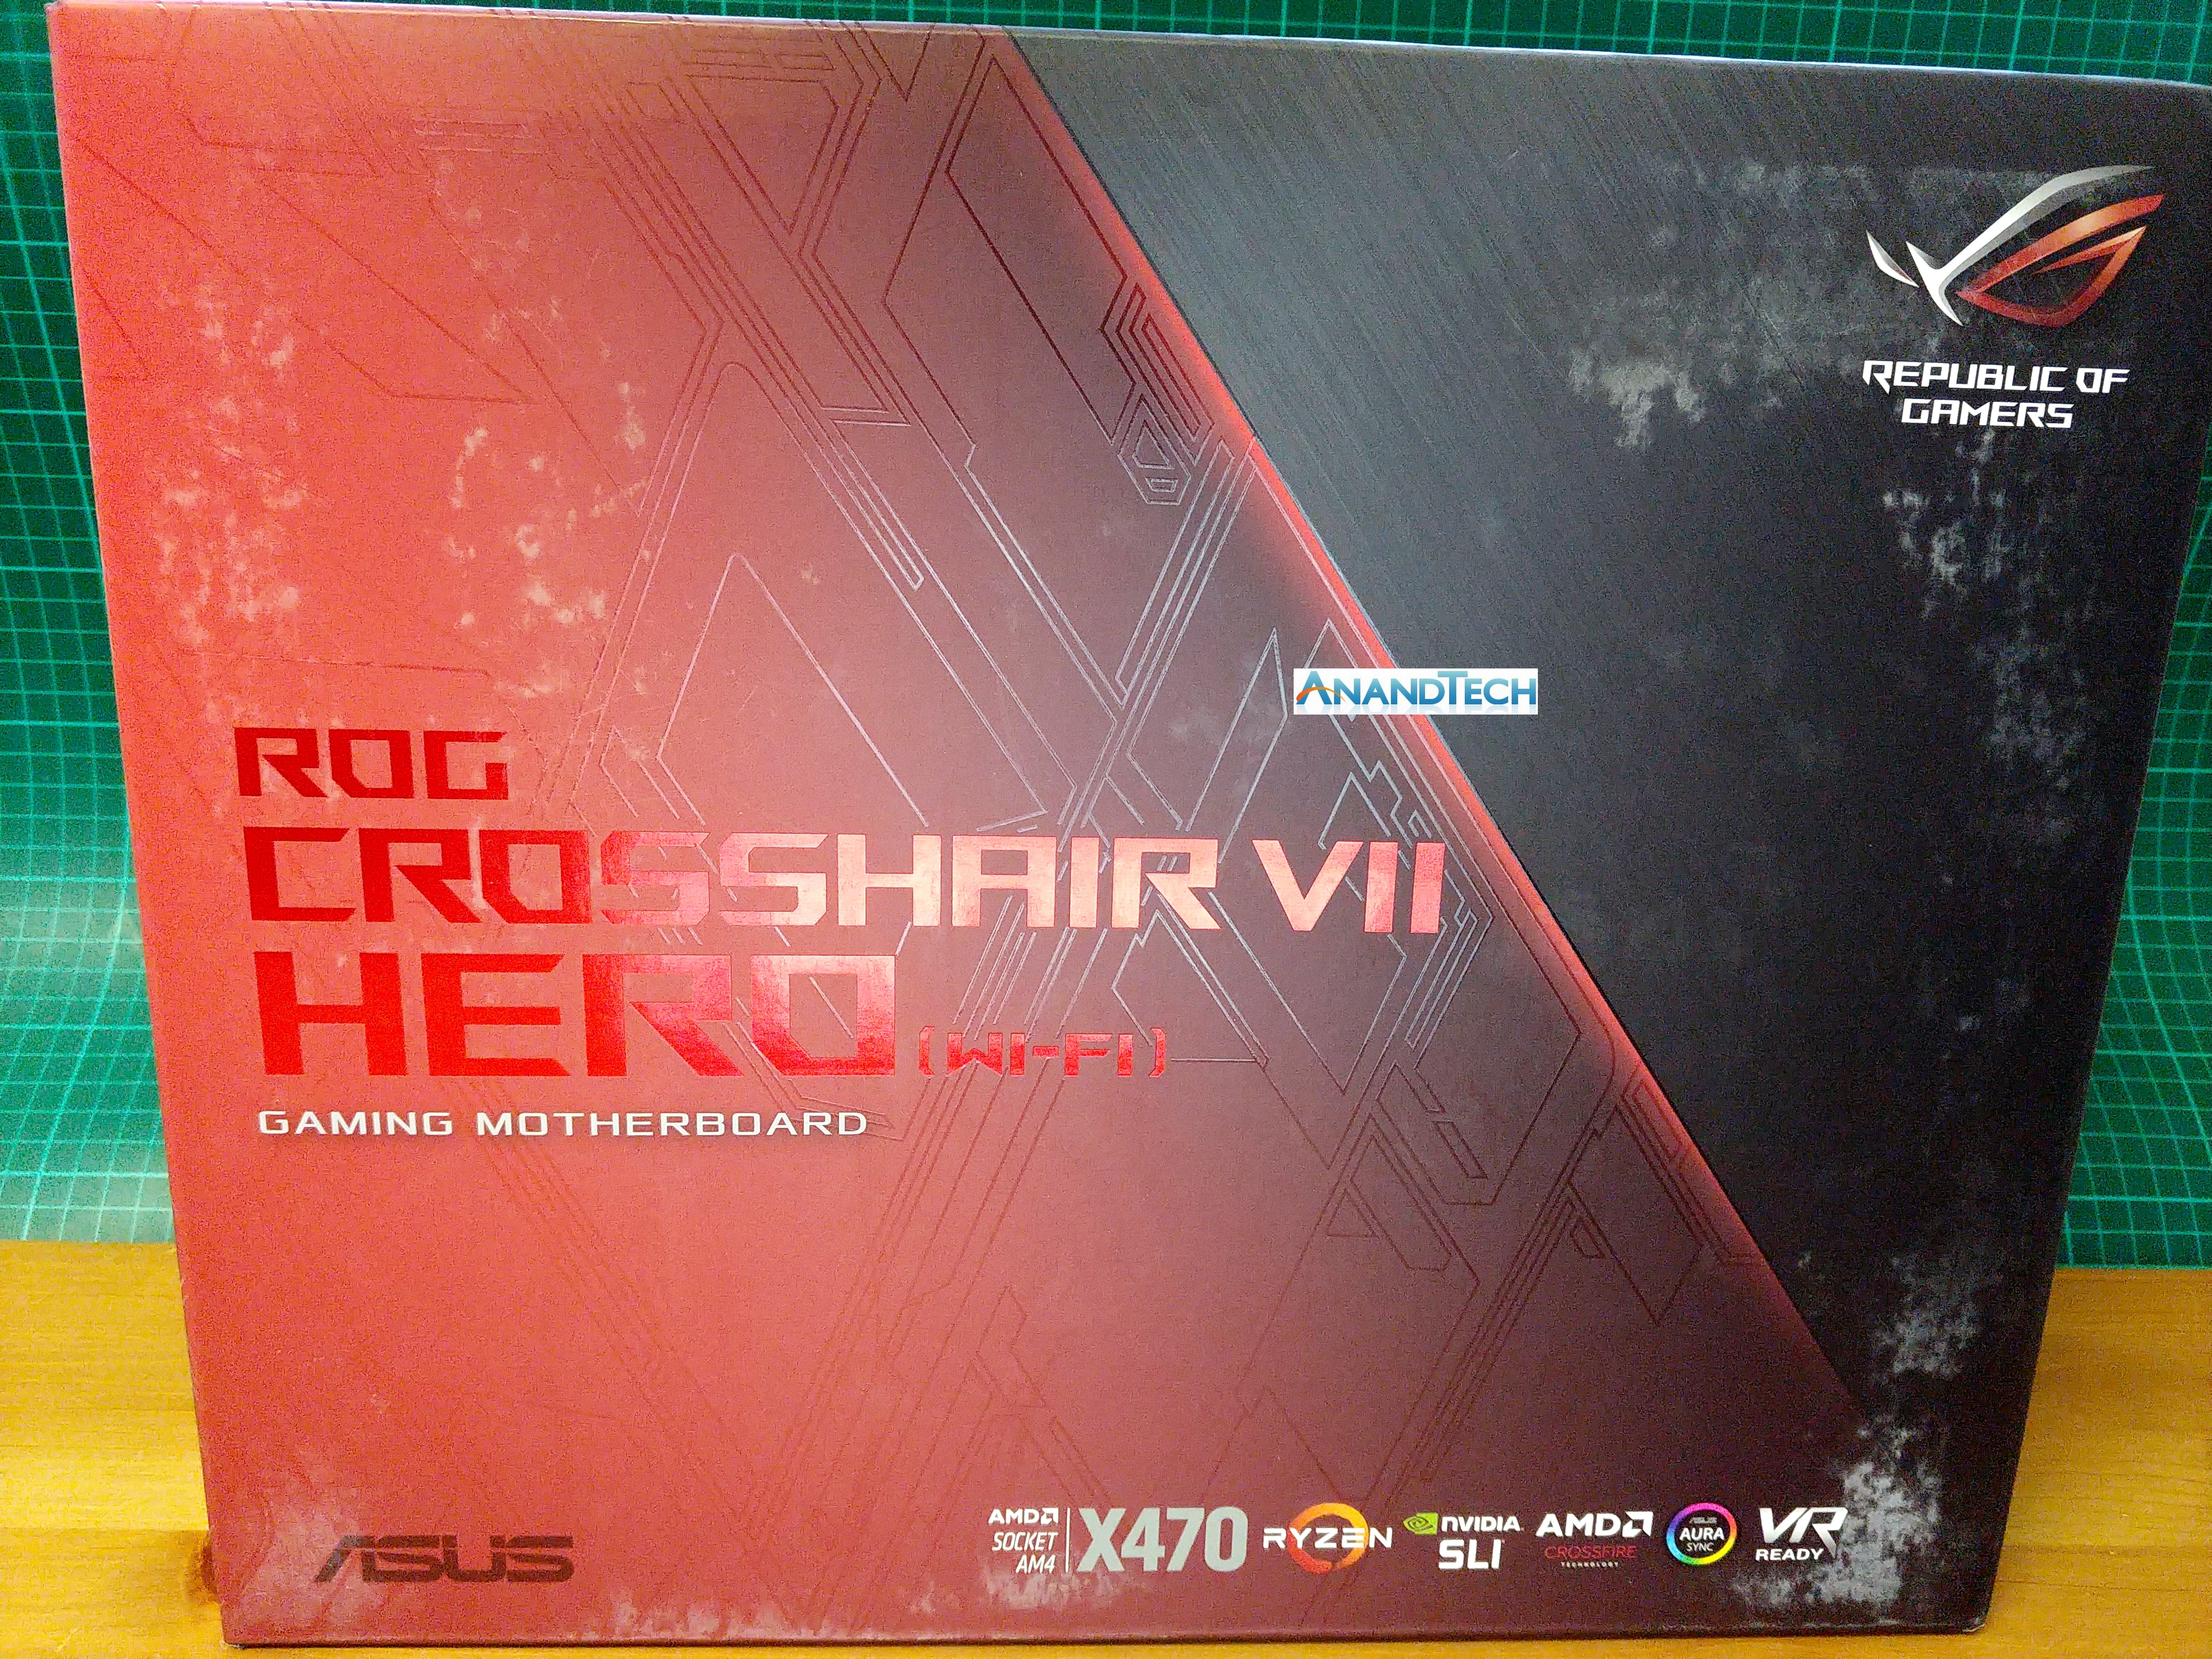
ASUS ROG Crosshair VII Hero
The first board we opened was the ASUS ROG Crosshair VII Hero (Wi-Fi), with the box well and truly battered either by shipping or how it was stored.
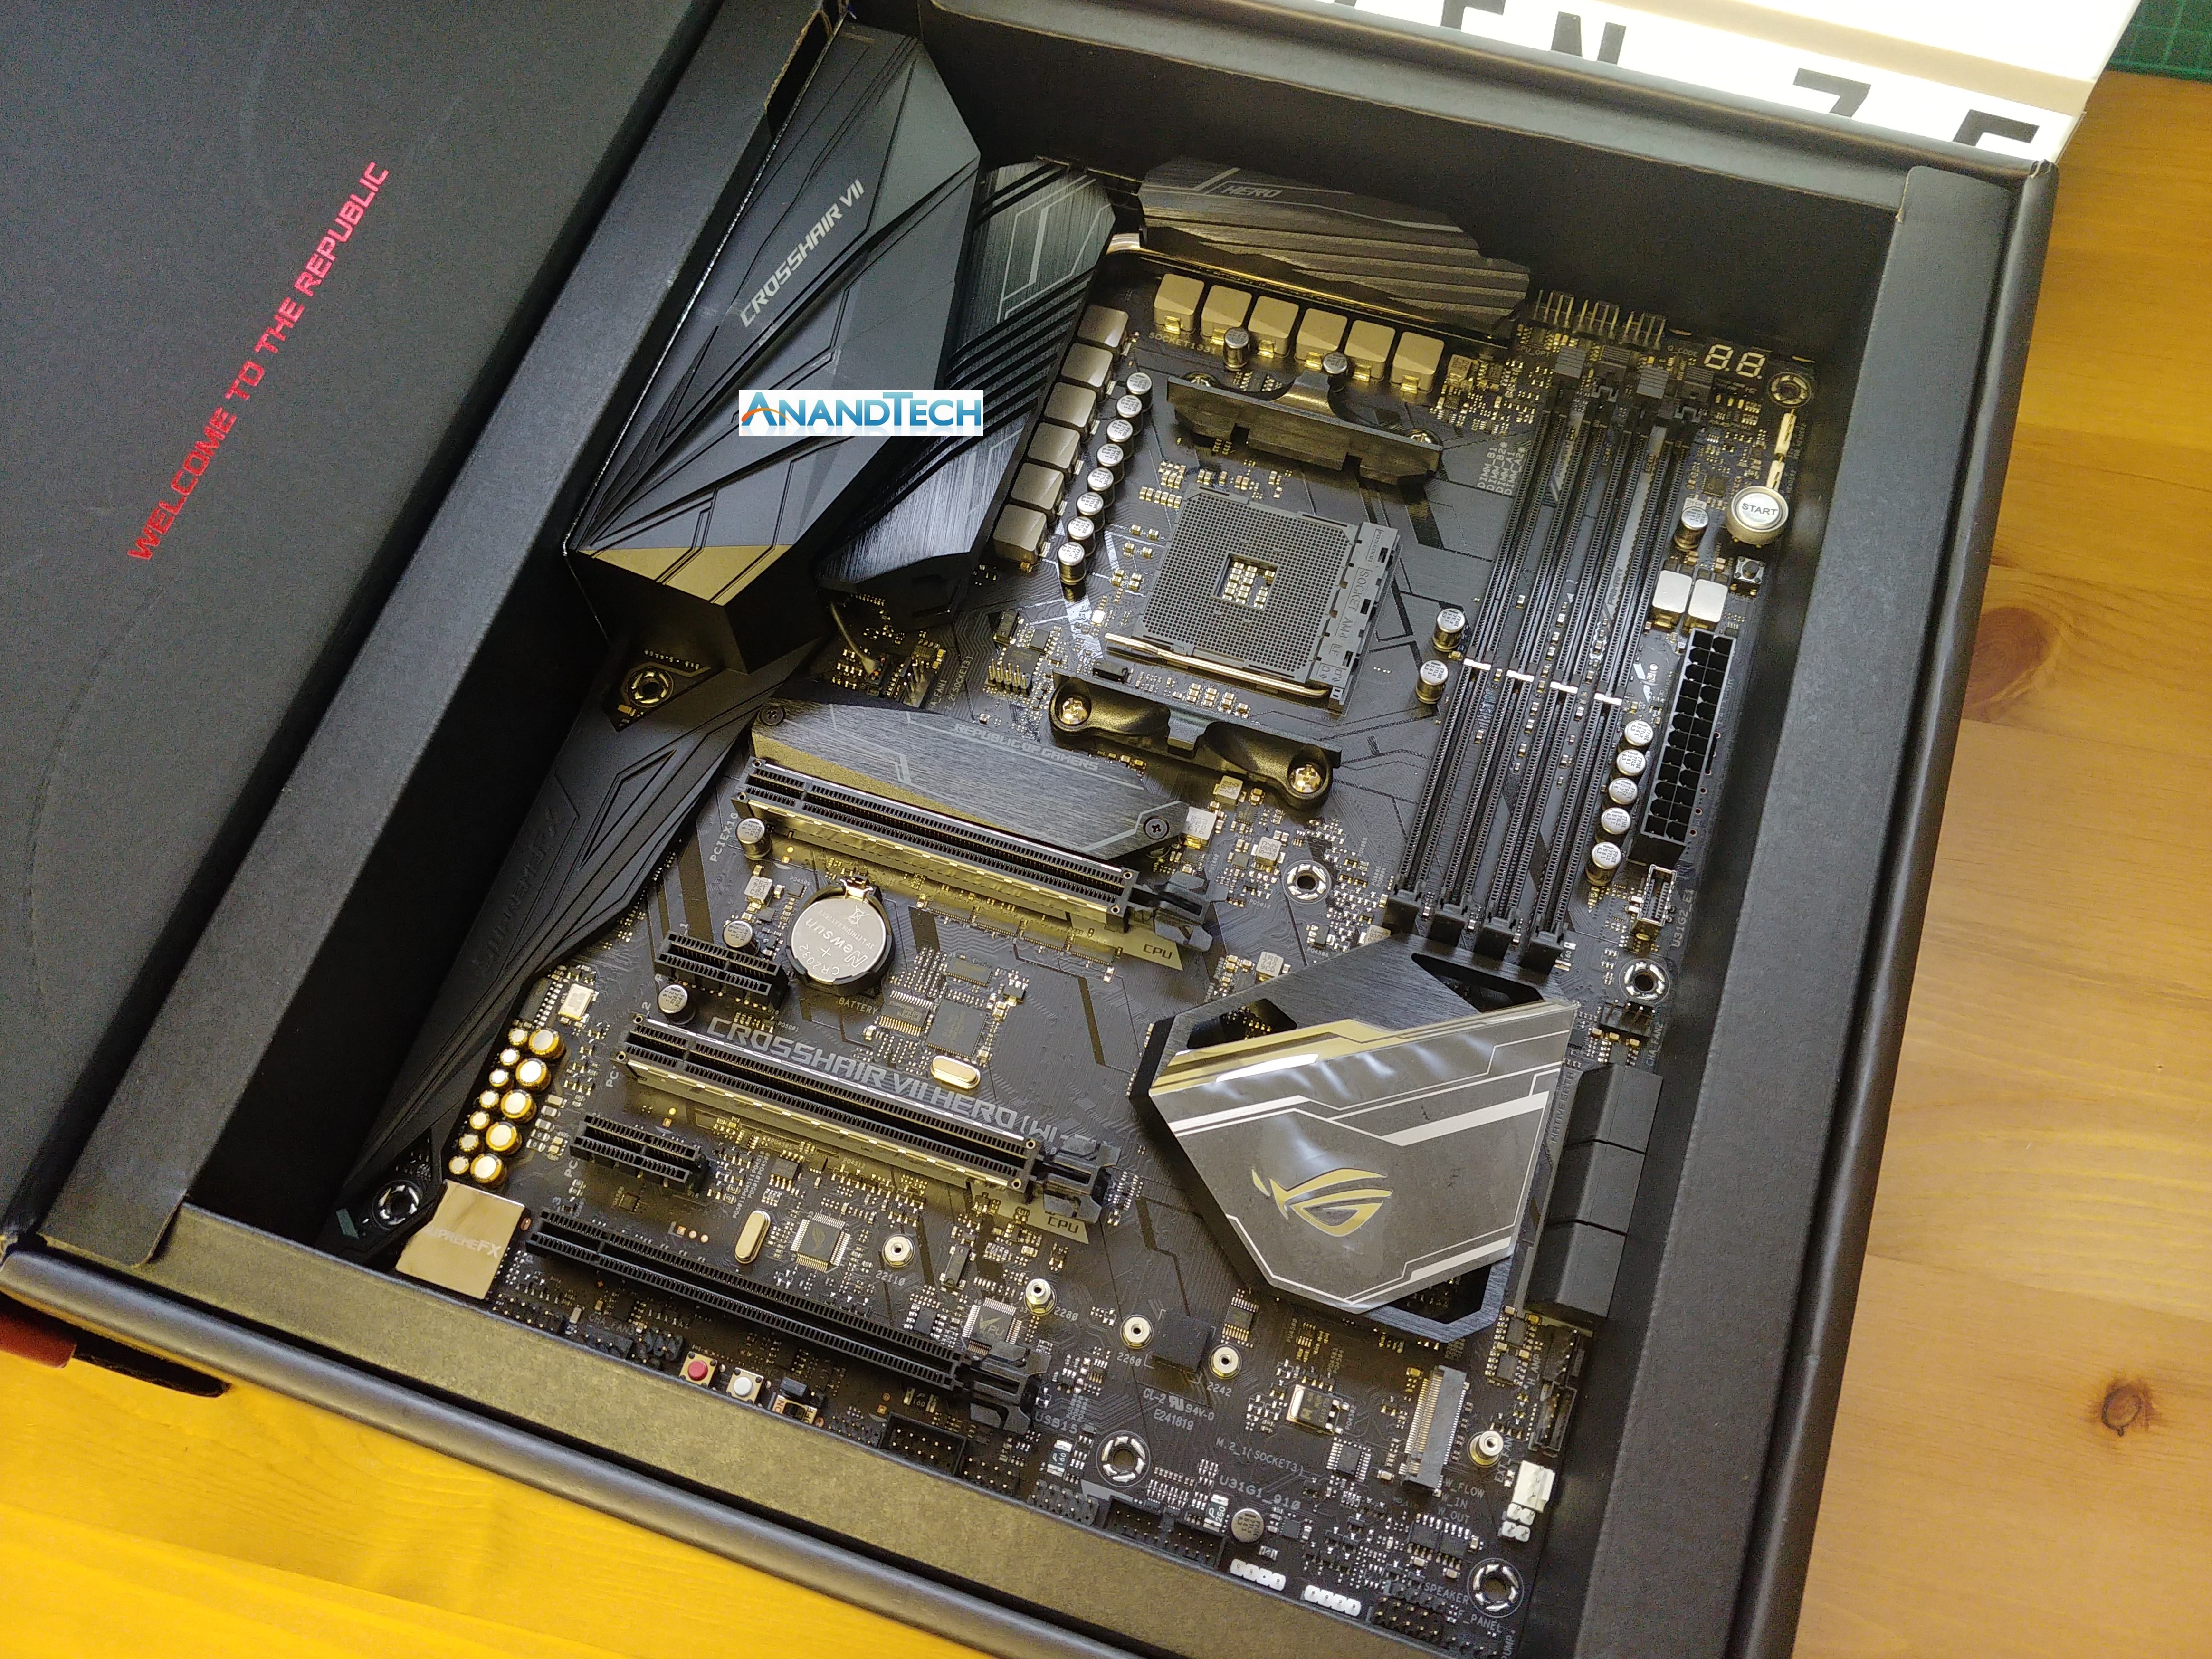
At first glance we already see a few notable features: a combined 12-phase power delivery (likely 10+2) on the CPU, with dual M.2 slots and reinforced PCIe for x8/x8 SLI operation. The rear IO panel is pre-attached to the system with the shroud, and there is a small cable connecting the integrated LEDs on the motherboard.
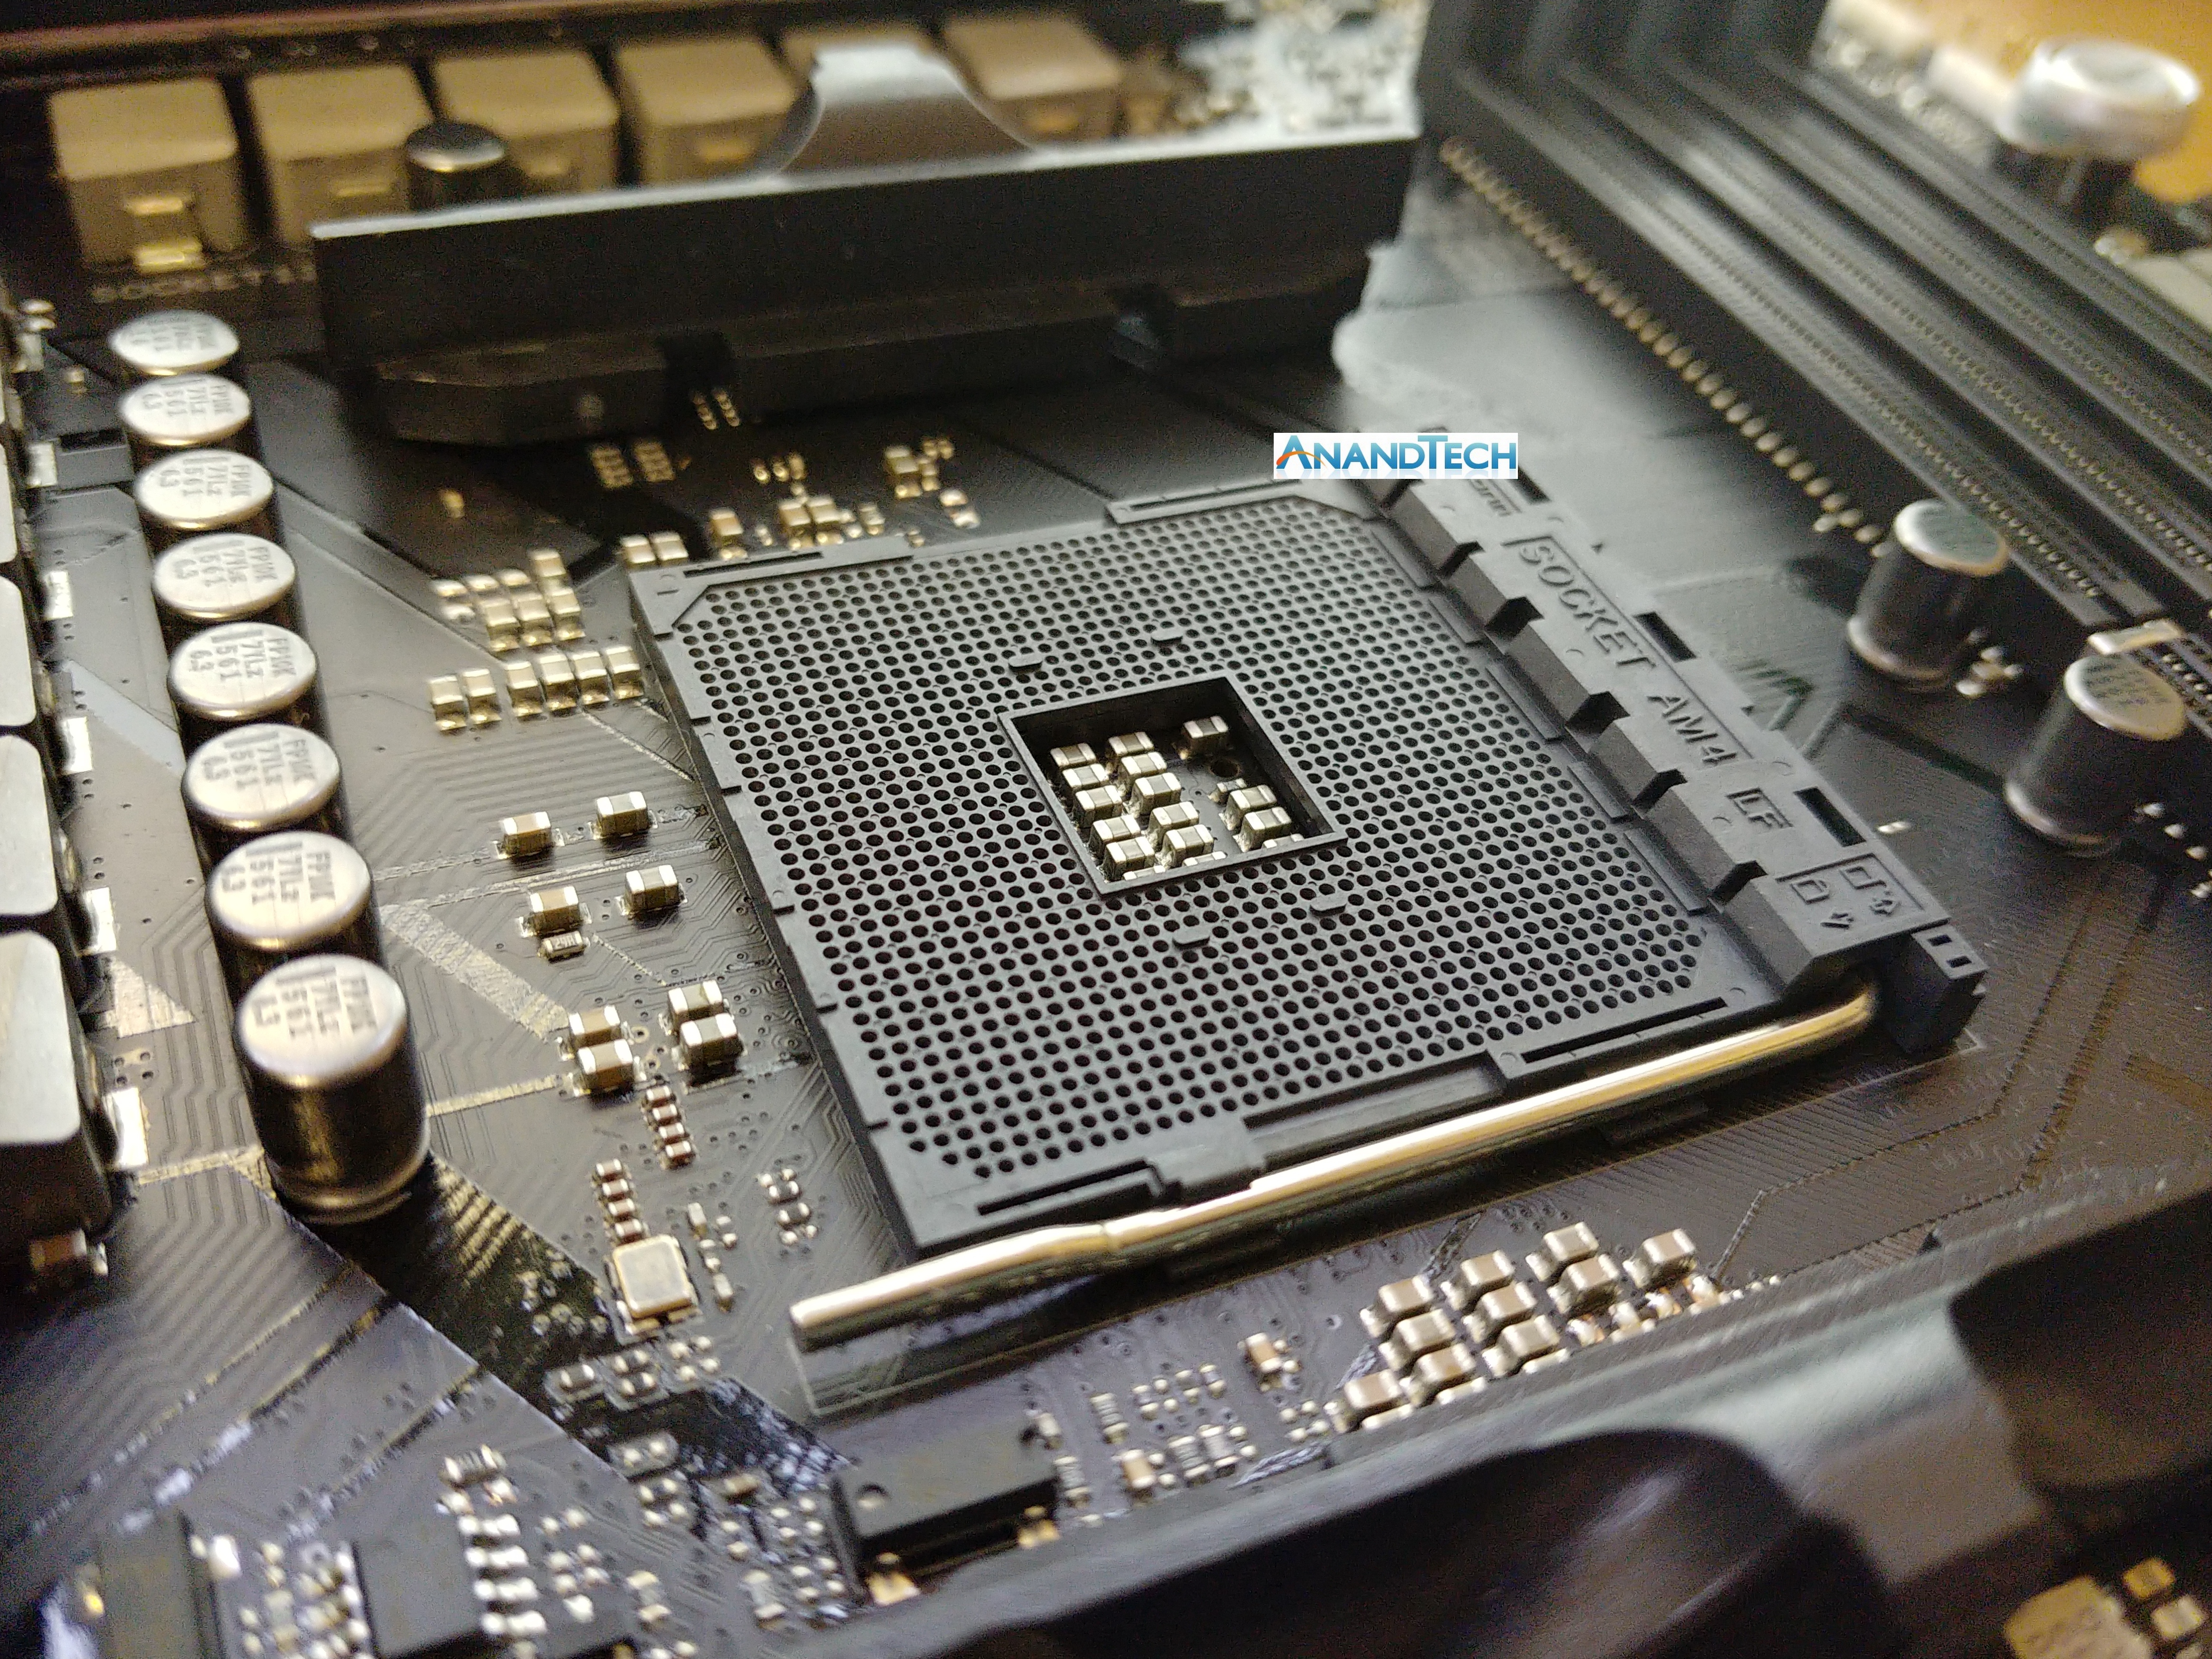
The socket is the same as before: AM4 with 1331 holes for the processor. The latch mechanism is the same, as are the cooler dimensions.
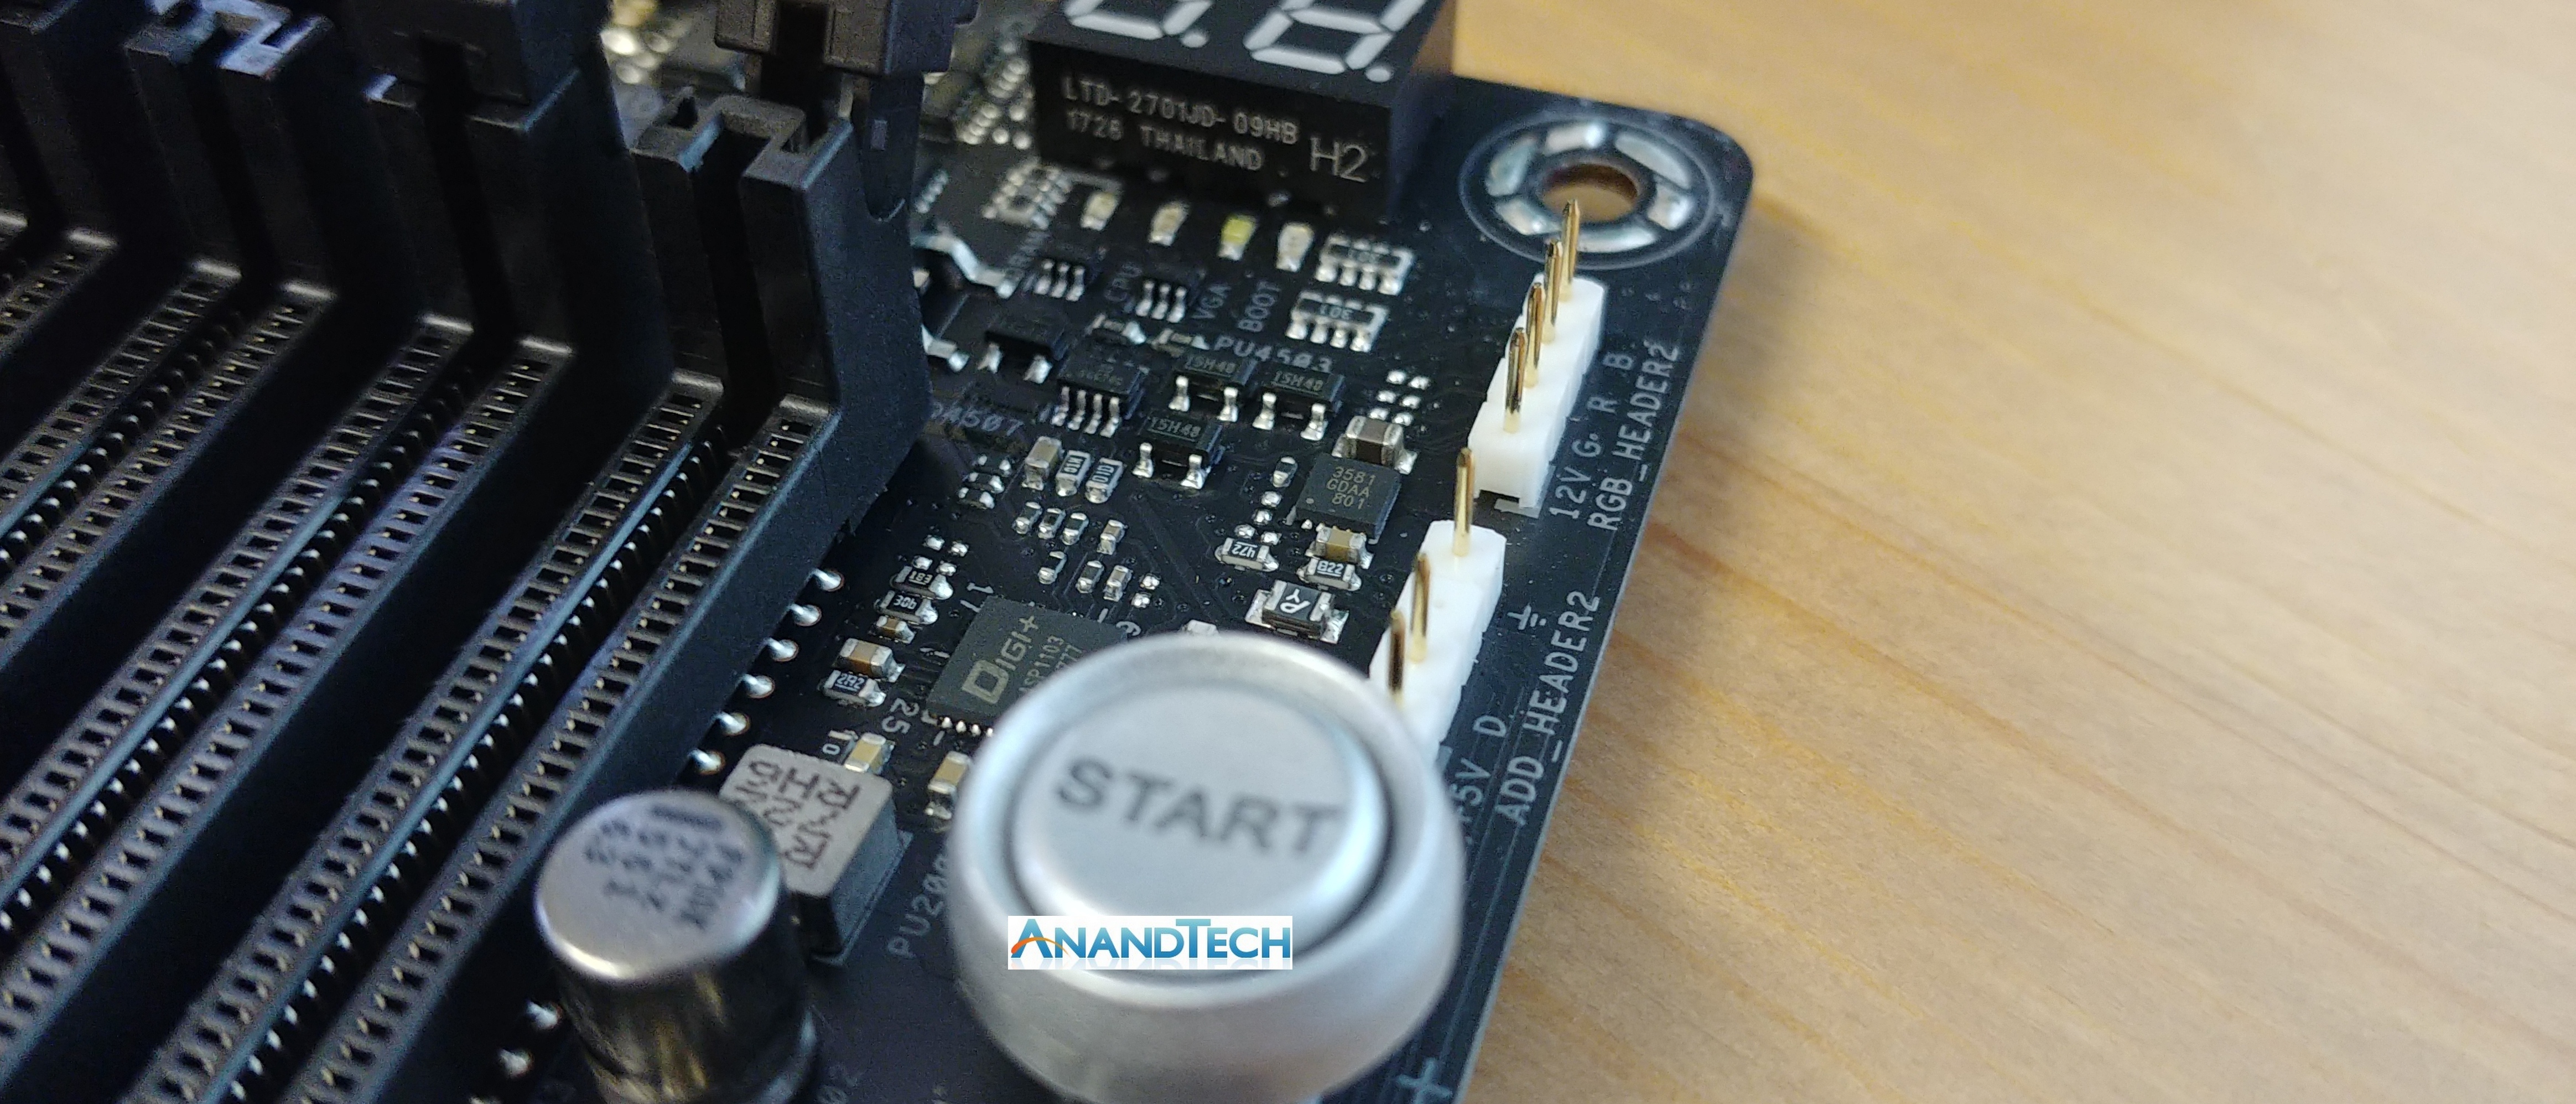
ASUS has added a number of RGB headers on the board, as well as what looks like easy-to-use voltage read points or points to enable any 5V operation (such as cold-cathode lighting?).
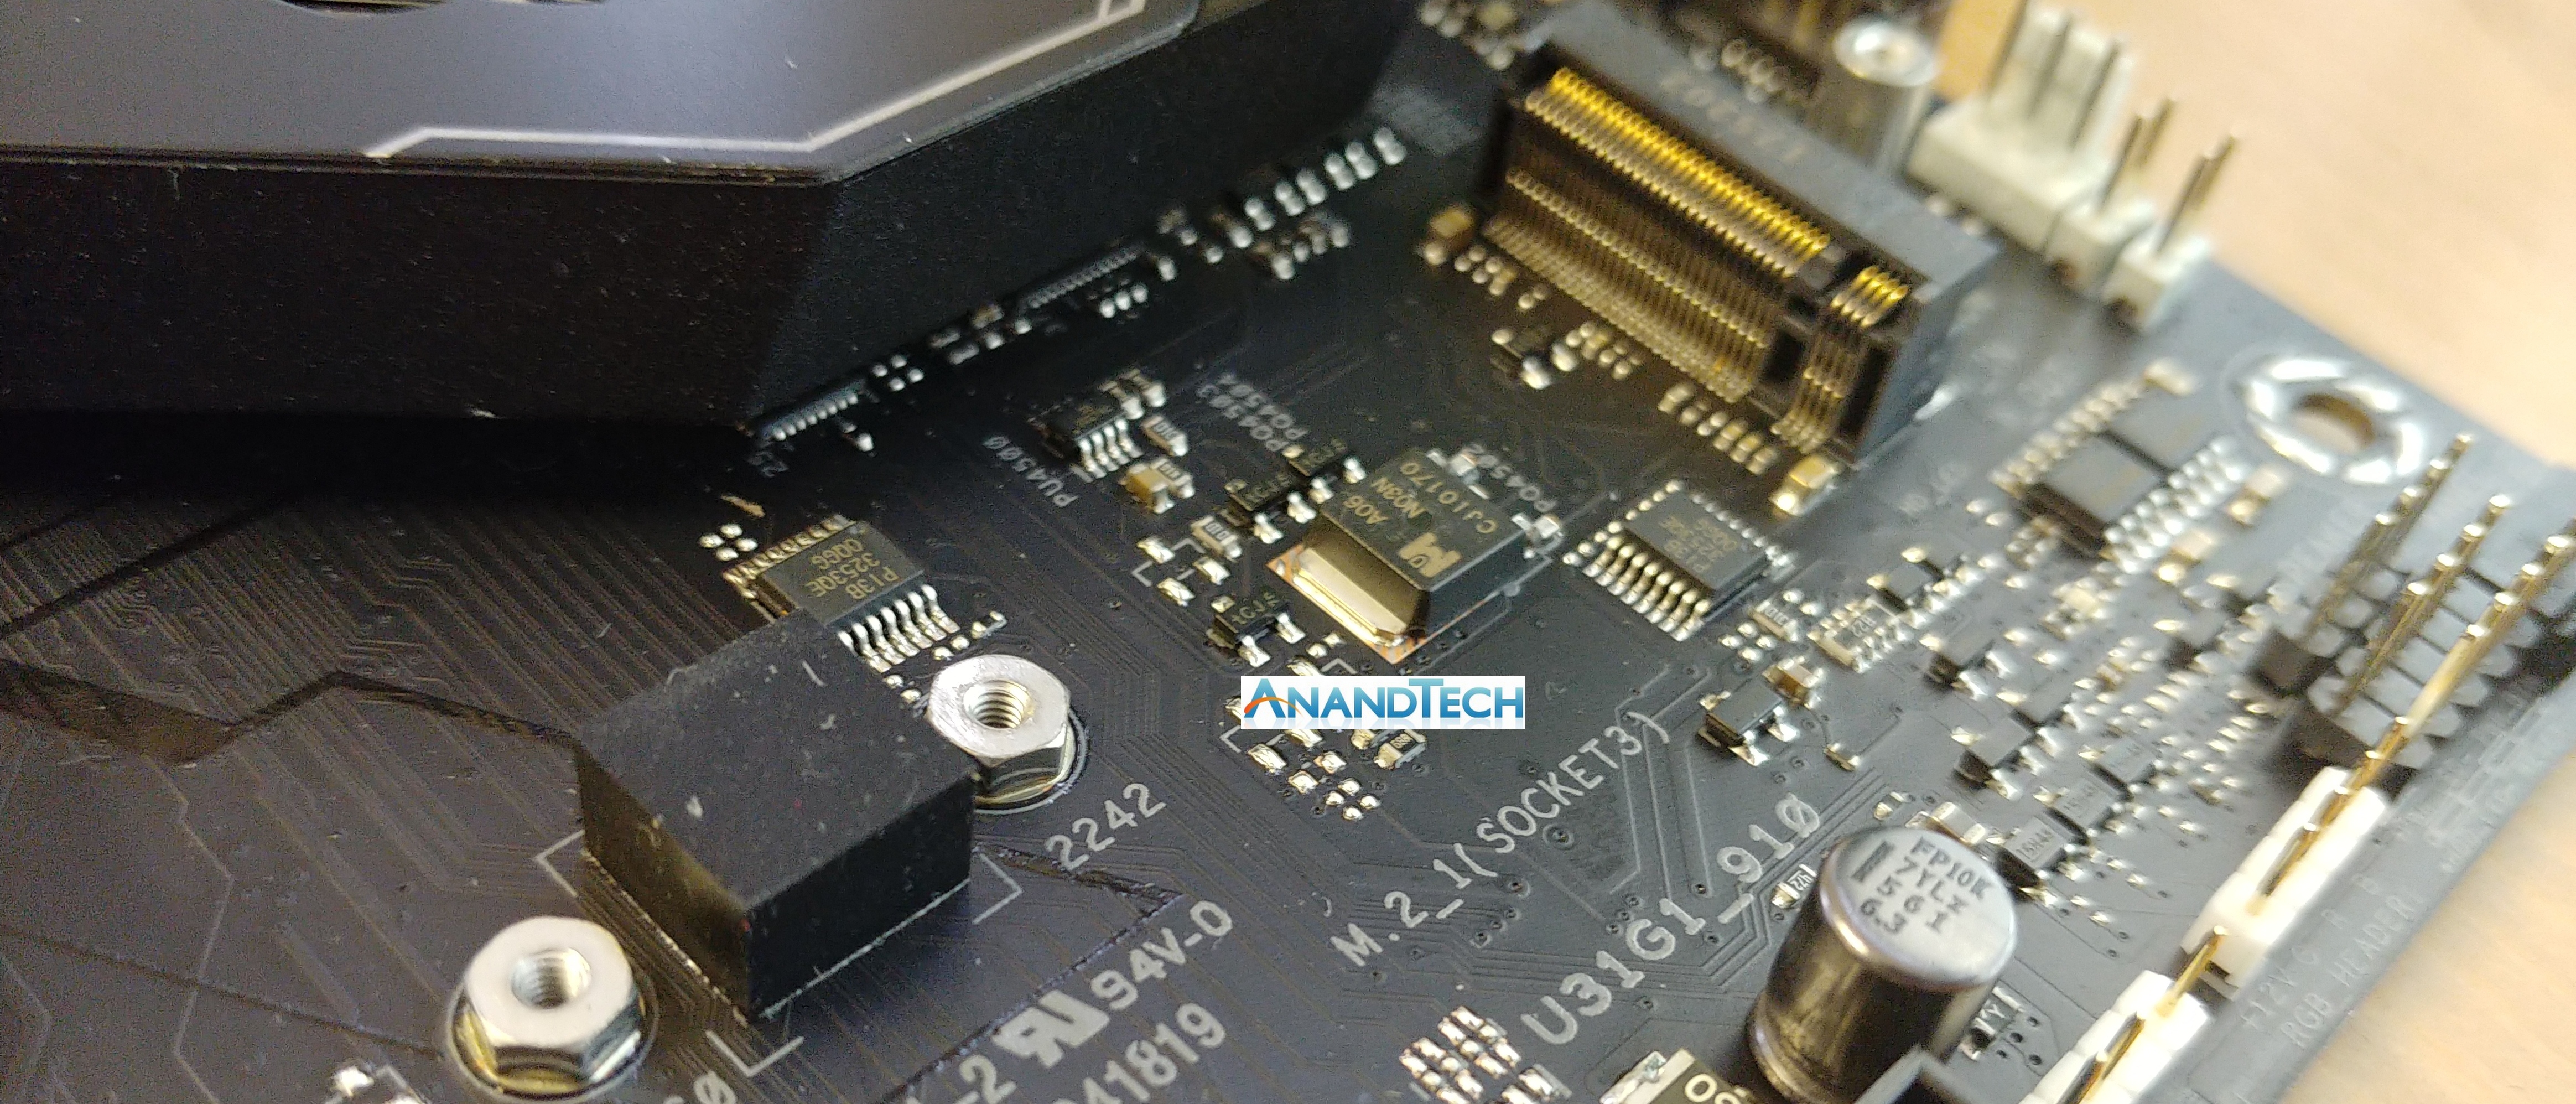
With the two M.2 sockets, one will be PCIe 3.0 x4 from the CPU and the other is PCIe 2.0 x4 from the chipset. For other storage needs, there are six SATA ports as well.
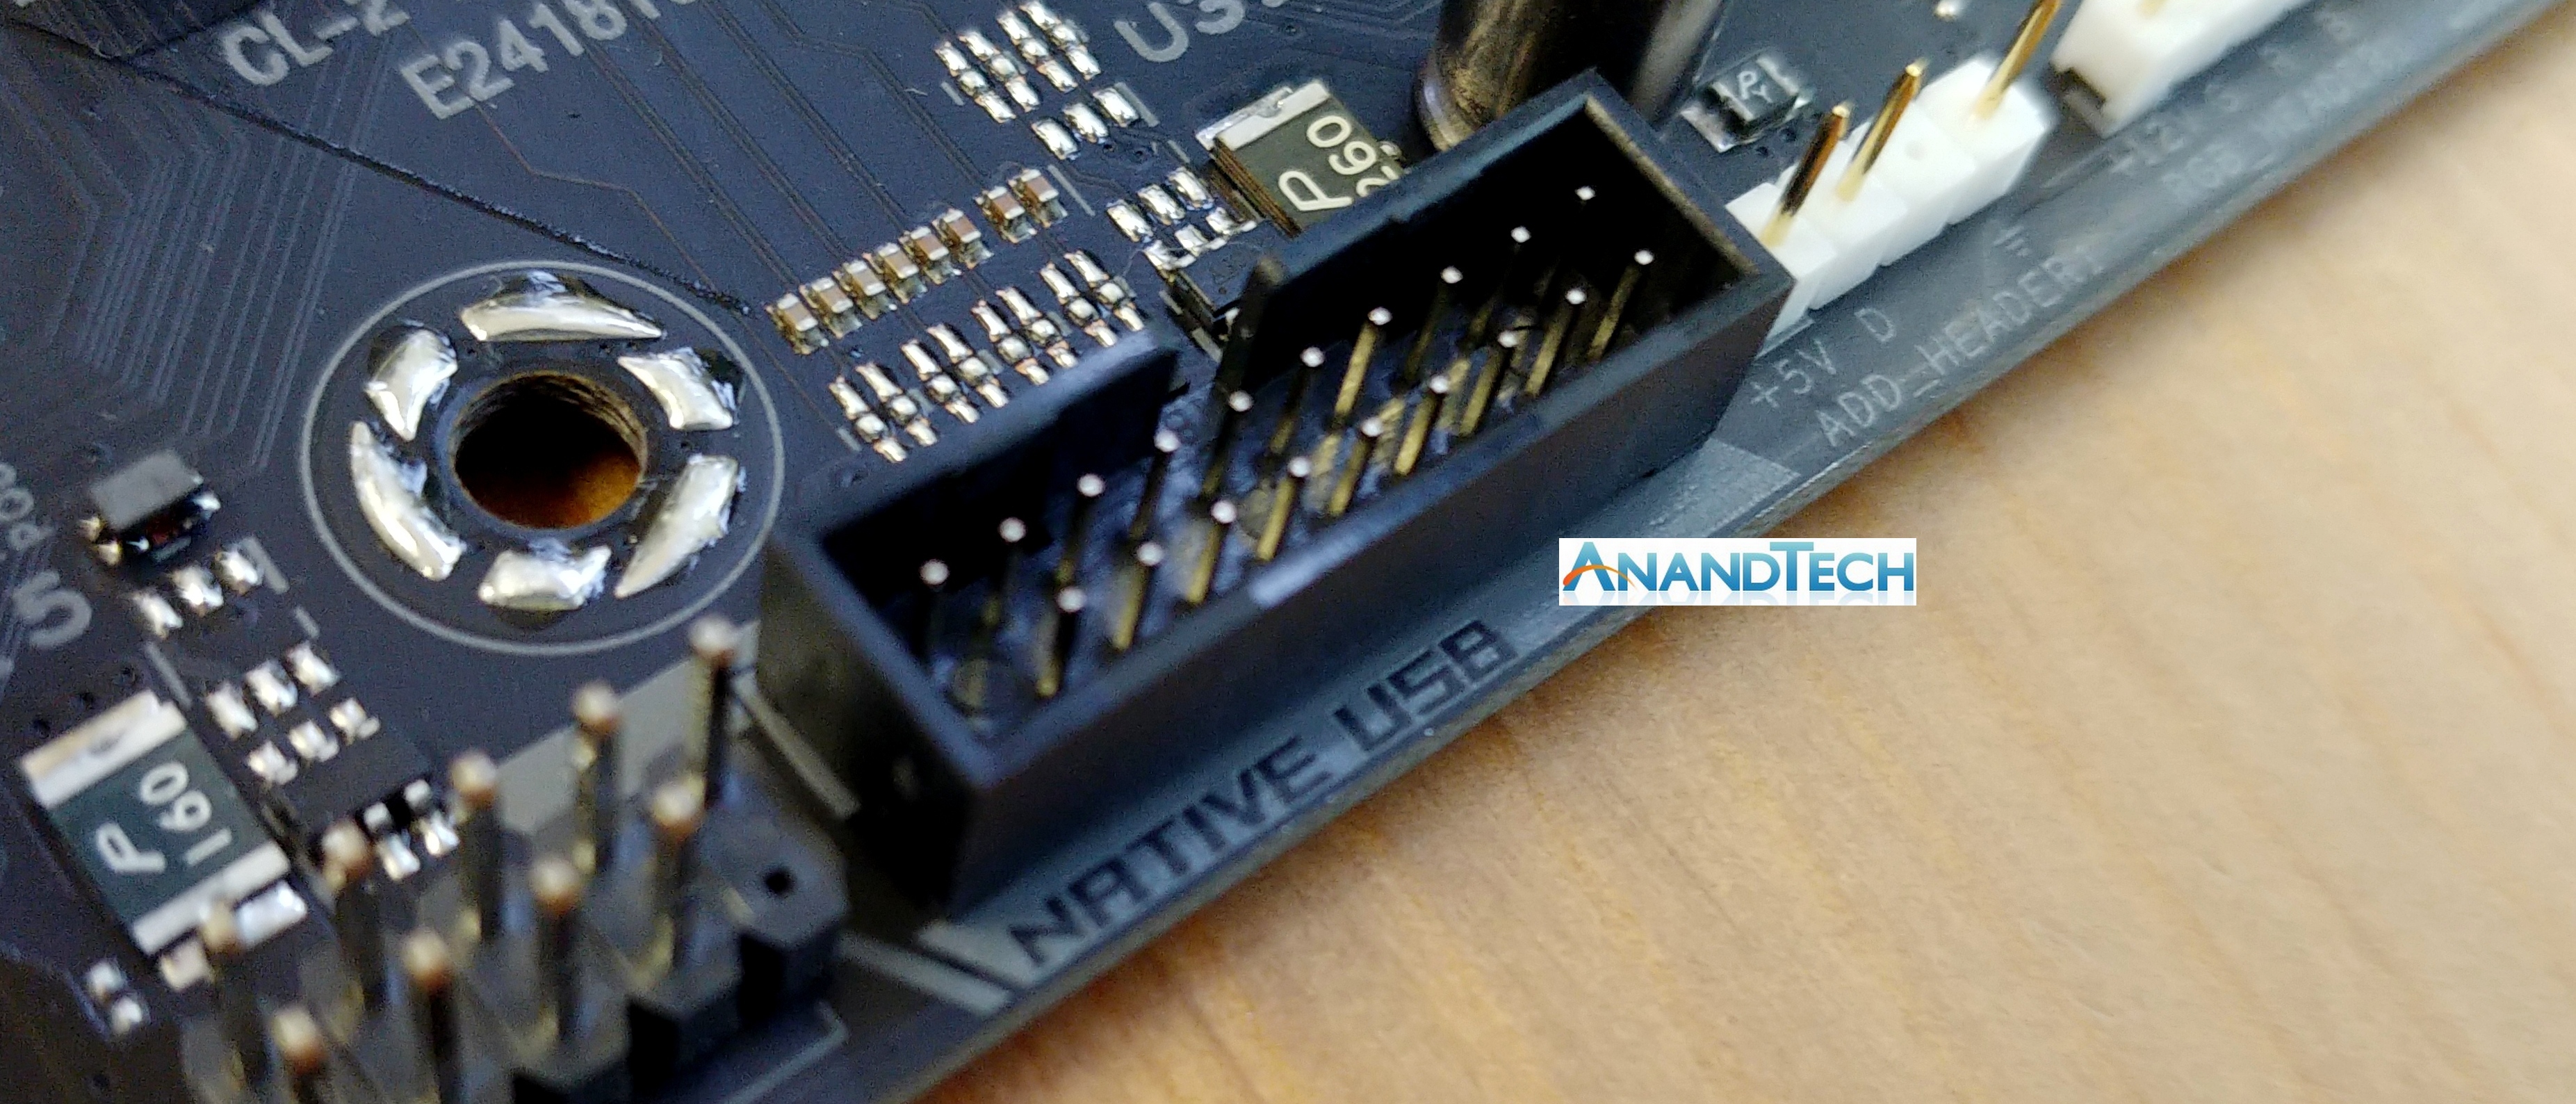
Onboard are a variety of USB 3.1, USB 3.0, and USB 2.0 ports and headers, although I found it quite amusing that ASUS decided to put ‘native USB’ on this header to signify that it is from the chipset and not from a controller. This has benefits for VR that requires native ports, allowing the user to put front panel connectors into the native USB headers.
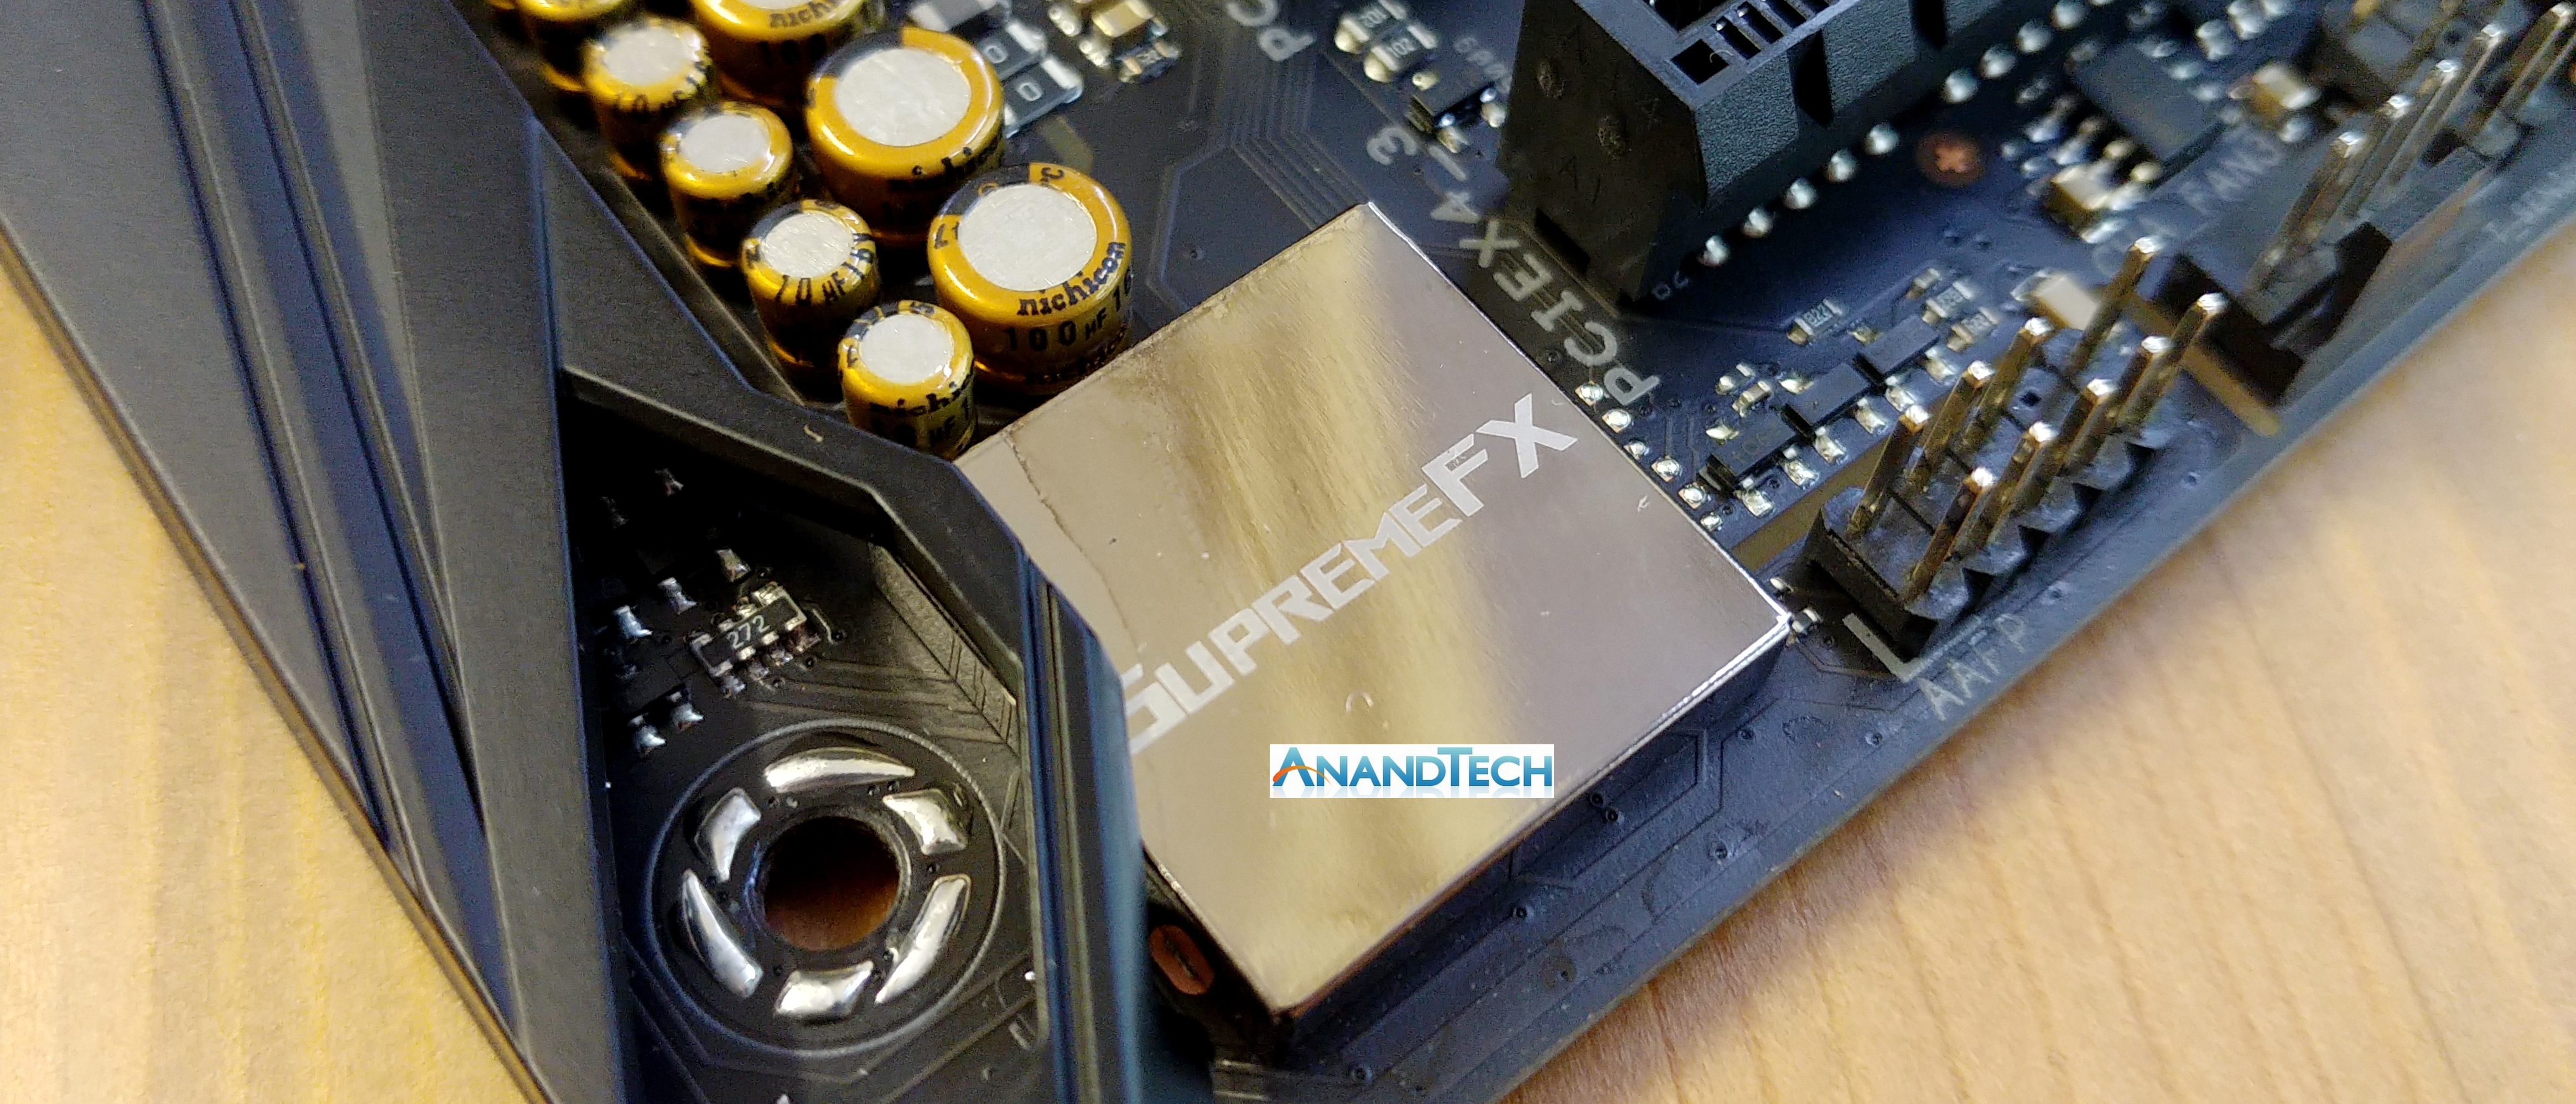
Being a halo board, ASUS has put in its SupremeFX audio configuration. This is based on a custom Realtek ALC1220A codec, Nichicon audio capacitors, an EMI shield, PCB separation, and bundled software.
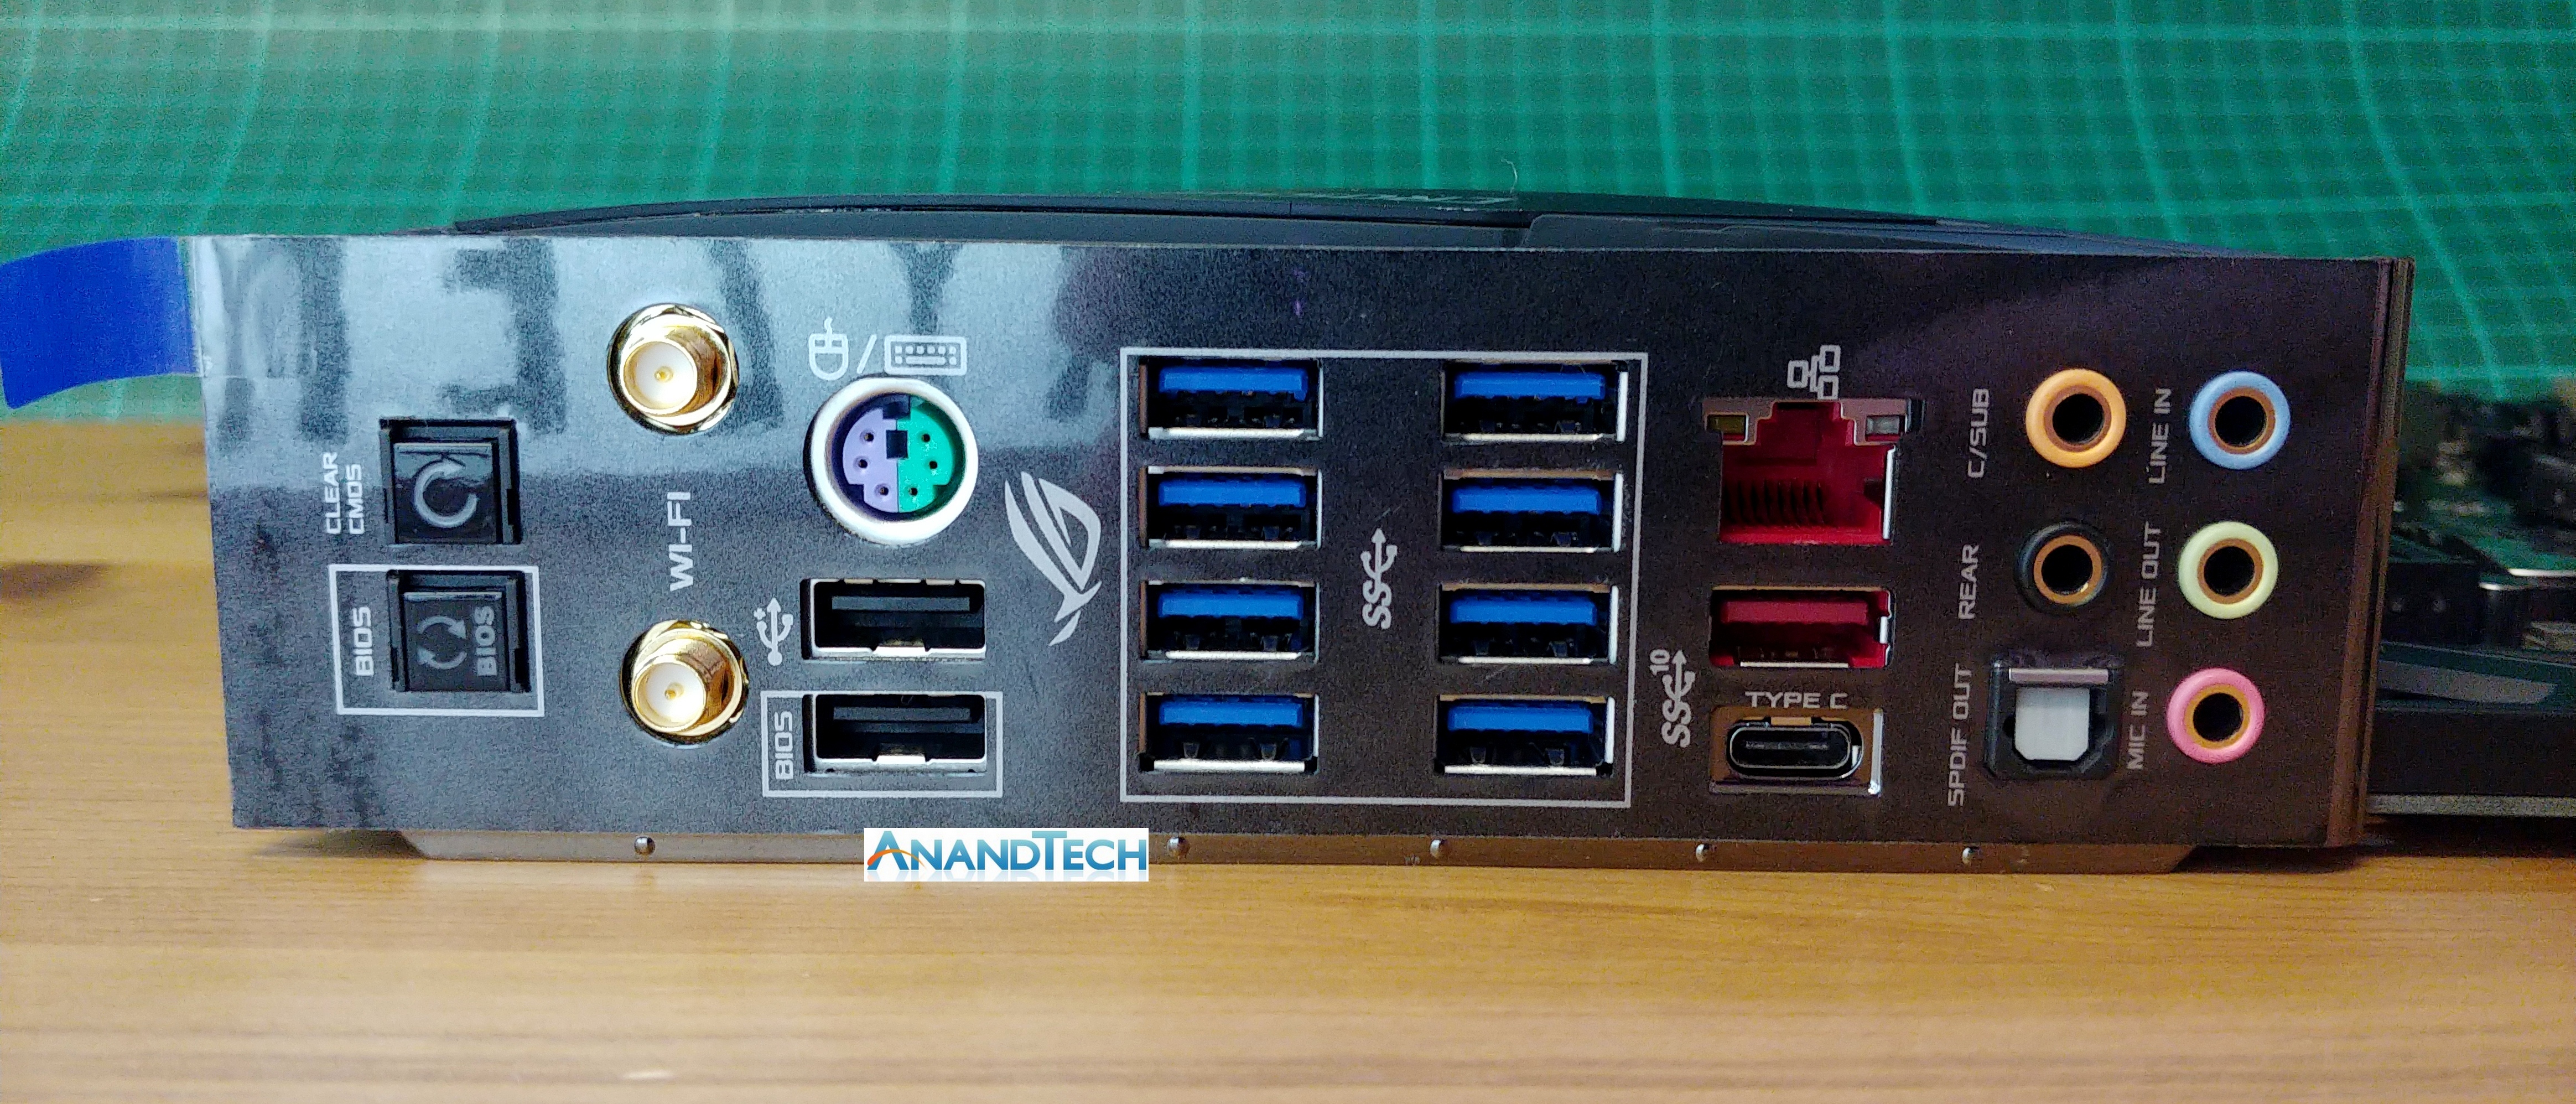
On the back we get ASUS BIOS Flashback button, such that users can upgrade the BIOS without the CPU/GPU/DRAM installed, a Clear CMOS button, the 802.11ac Wi-Fi, two USB 2.0 ports, a combination PS/2 port, eight USB 3.0 ports, two USB 3.1 ports (one Type-C), the gigabit Ethernet port, and the audio jacks.


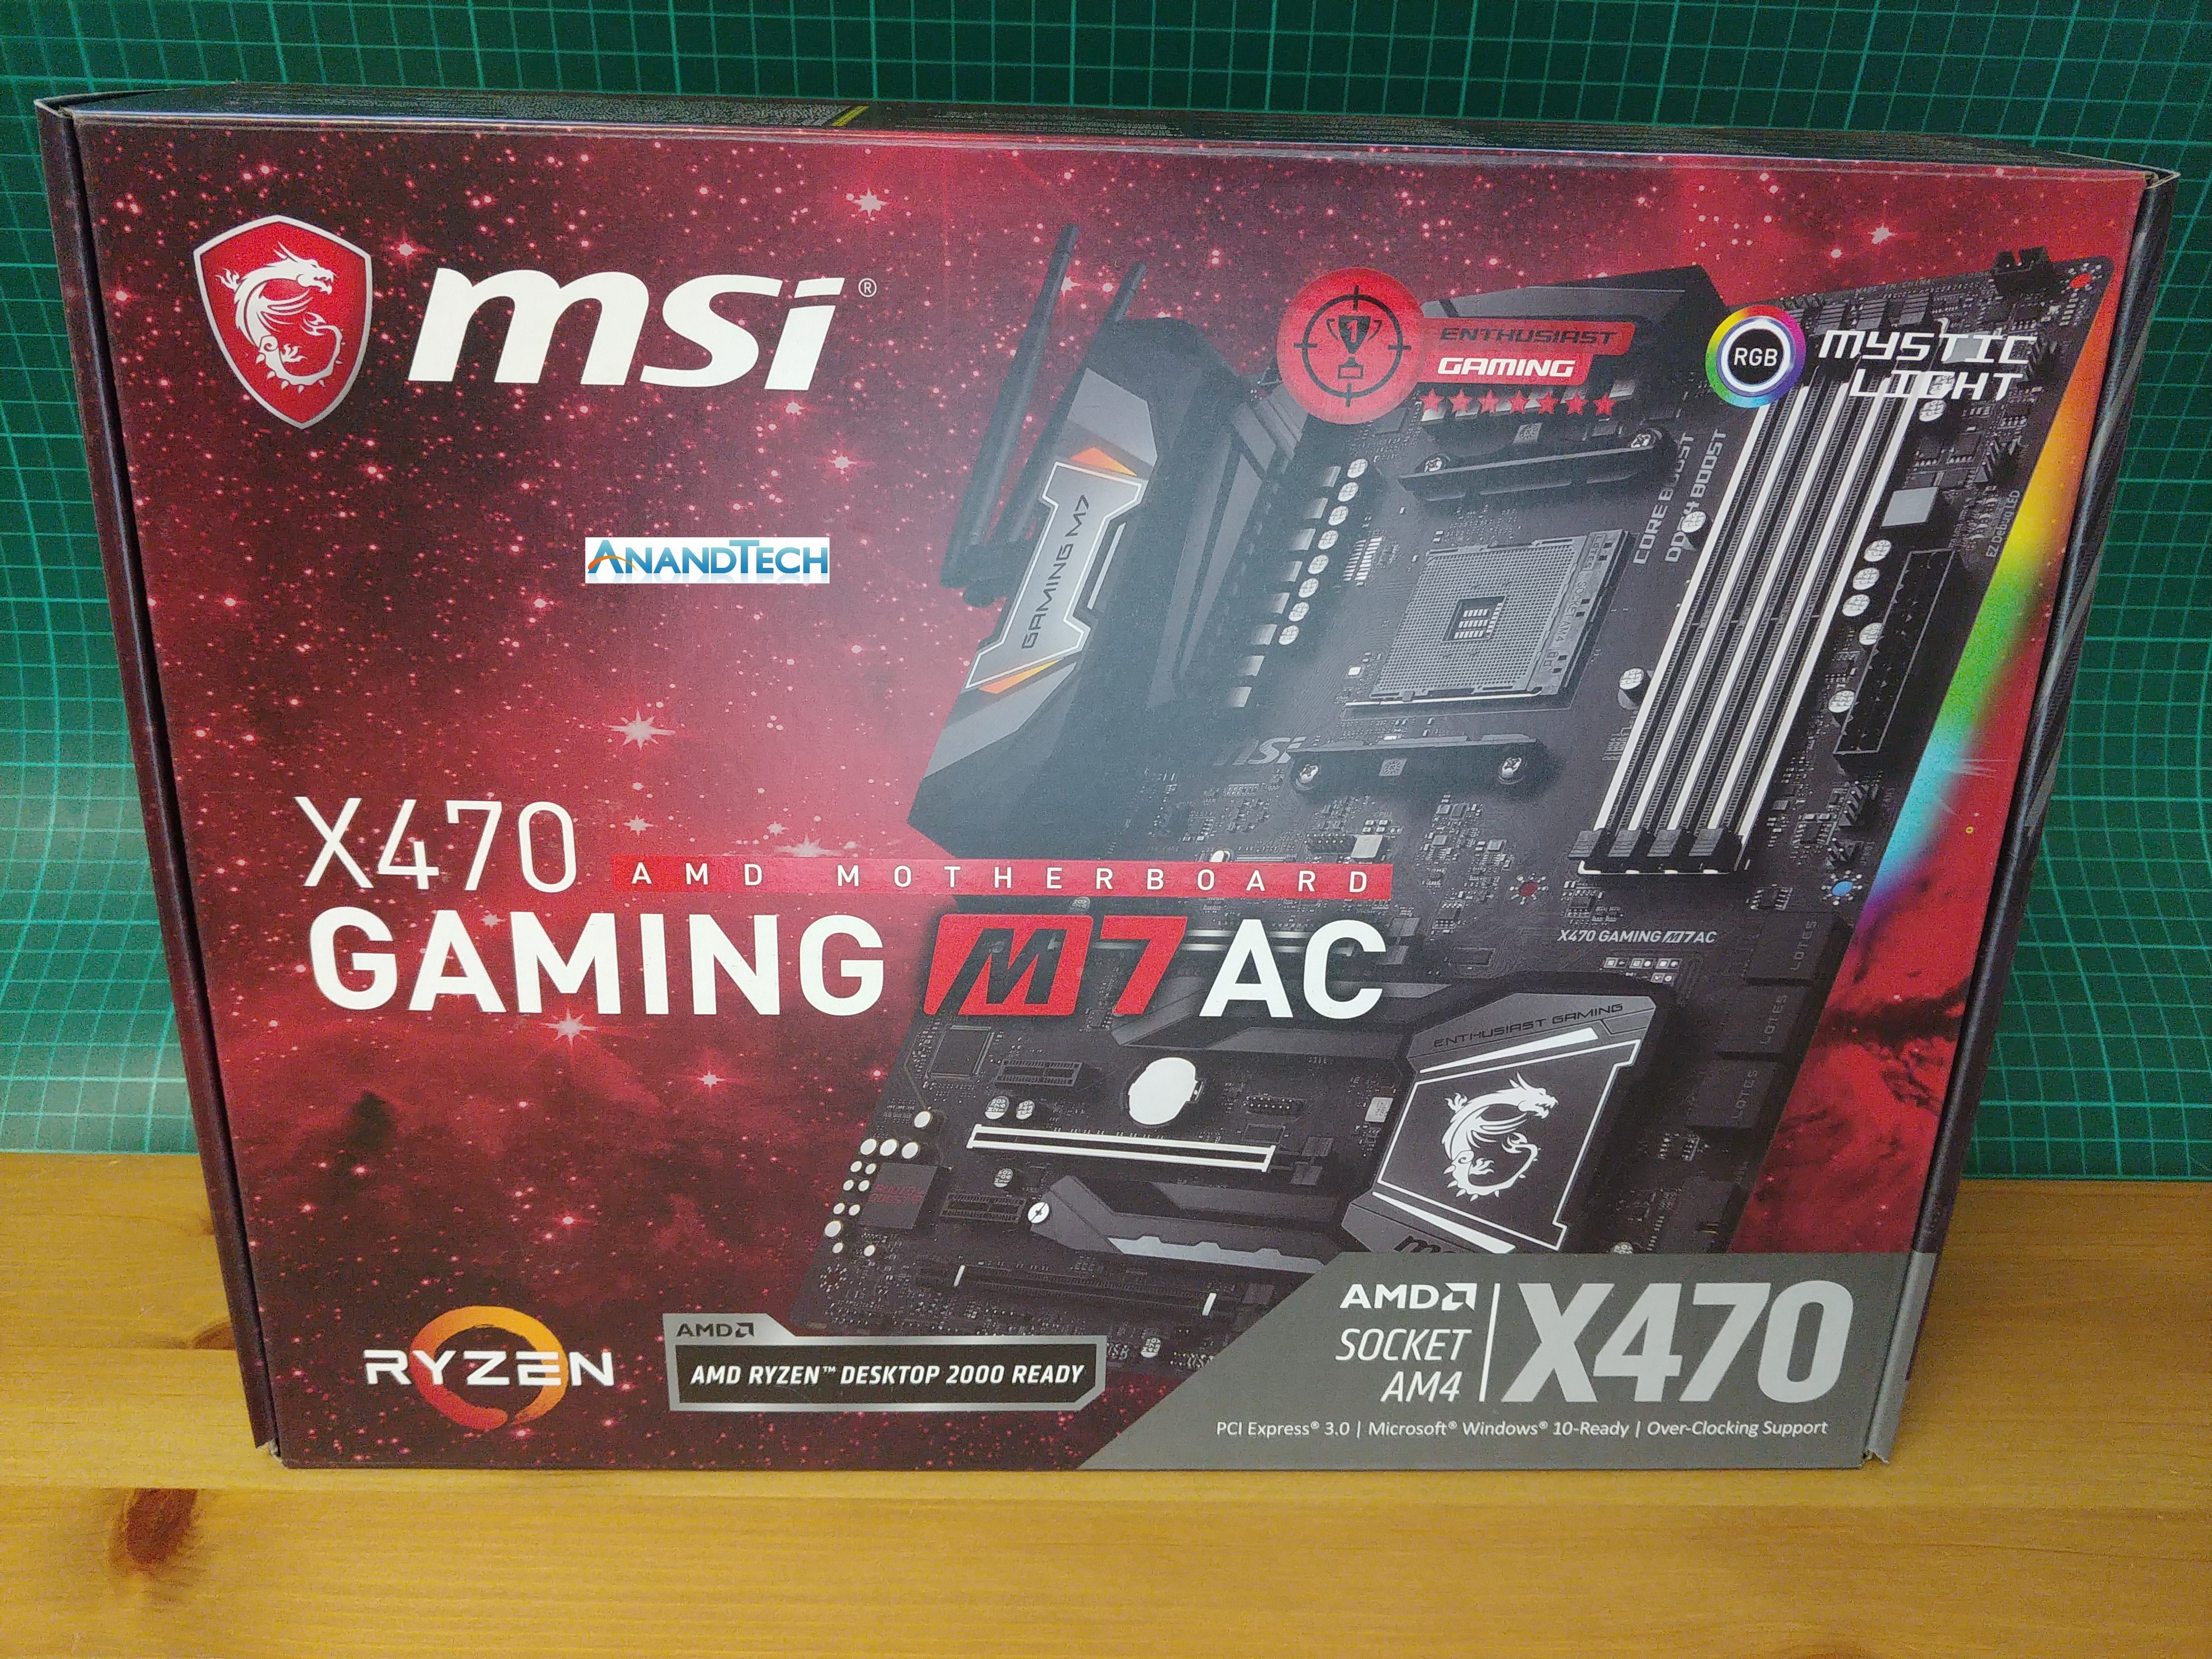
MSI X470 Gaming M7 AC
By contrast, the MSI X470 Gaming M7 AC box was not bashed up, and showed the picture of the motherboard directly on the front. Normally we are used to seeing MSI and the ‘ACK’ moniker on some of its Gaming M7 motherboards with Wi-Fi, to indicate using a Killer network controller, but not here.
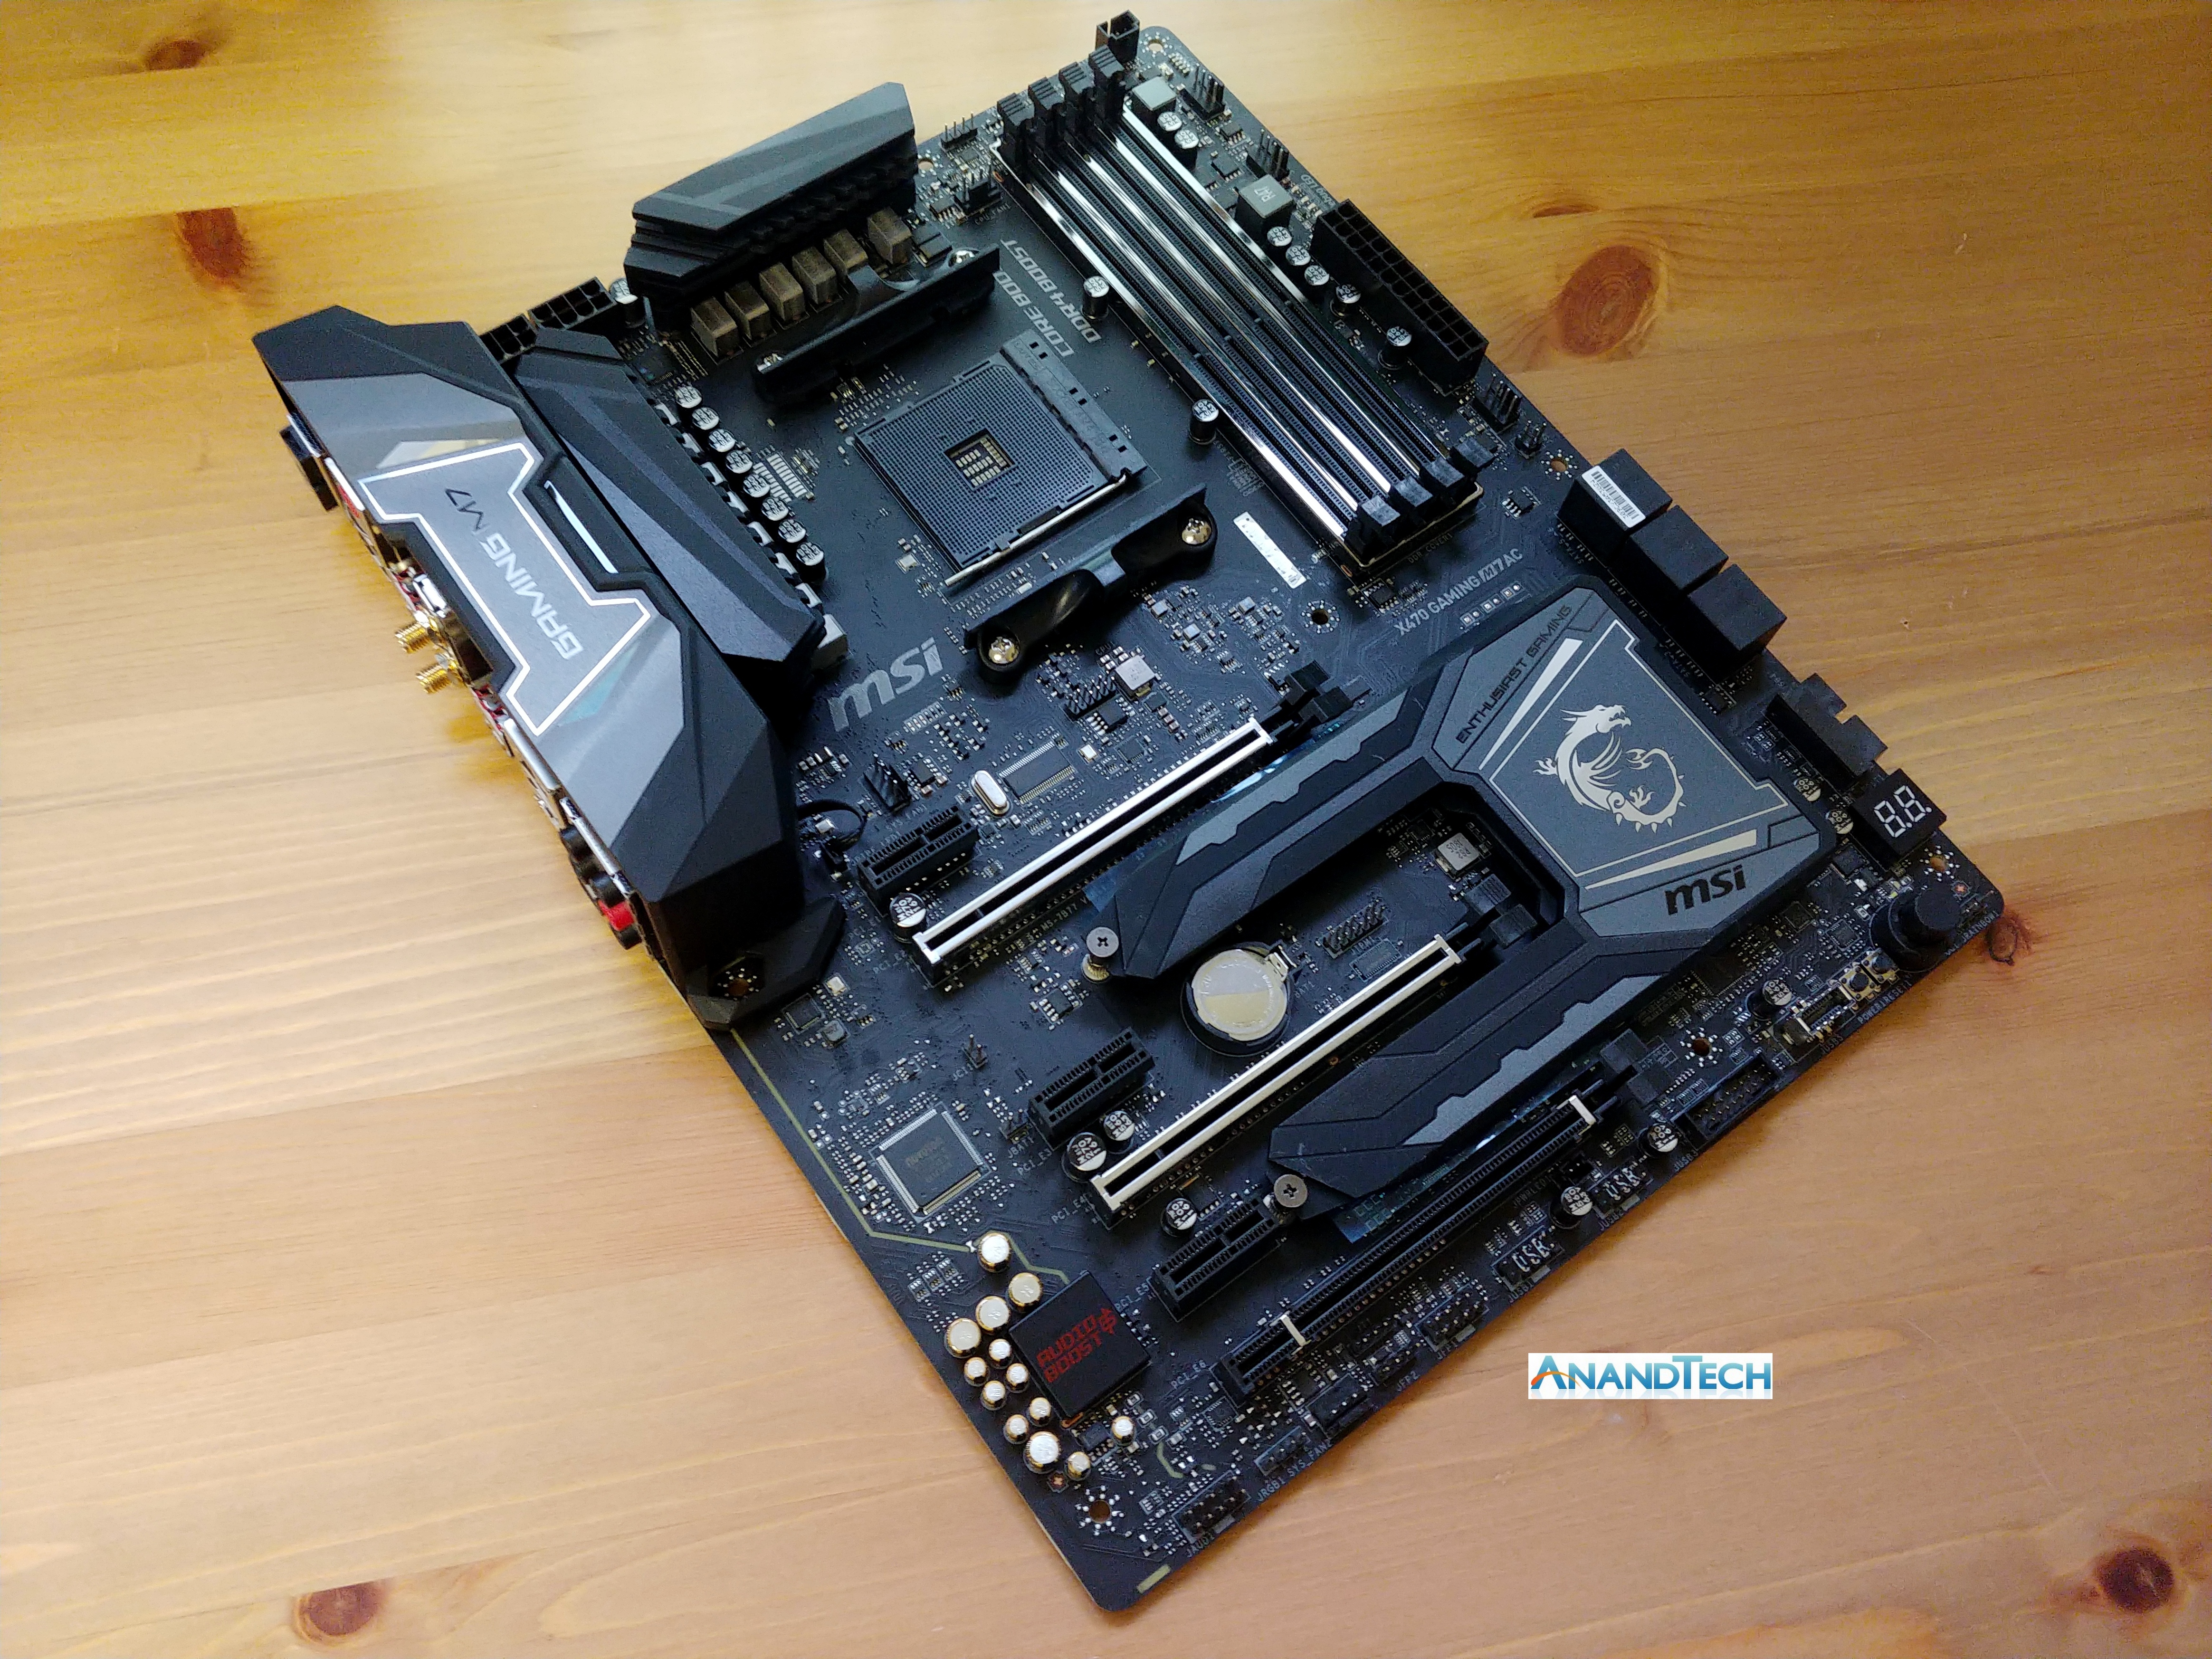
The first look at the board shows something a little less heavy on the styling than the ASUS, although MSI is still pushing a bit of an angled look. The obvious features are the DRAM supports, the multitude of chokes in the power delivery, and that dual-fingered chipset heatsink which hides two M.2 slots.

A close up of the DRAM ‘cover’ shows that this is how MSI is evolving its reinforced memory slot concept. We can argue if reinforcing memory slots is actually worth anything (it certainly helps PCIe), but here it can contribute to the aesthetic.
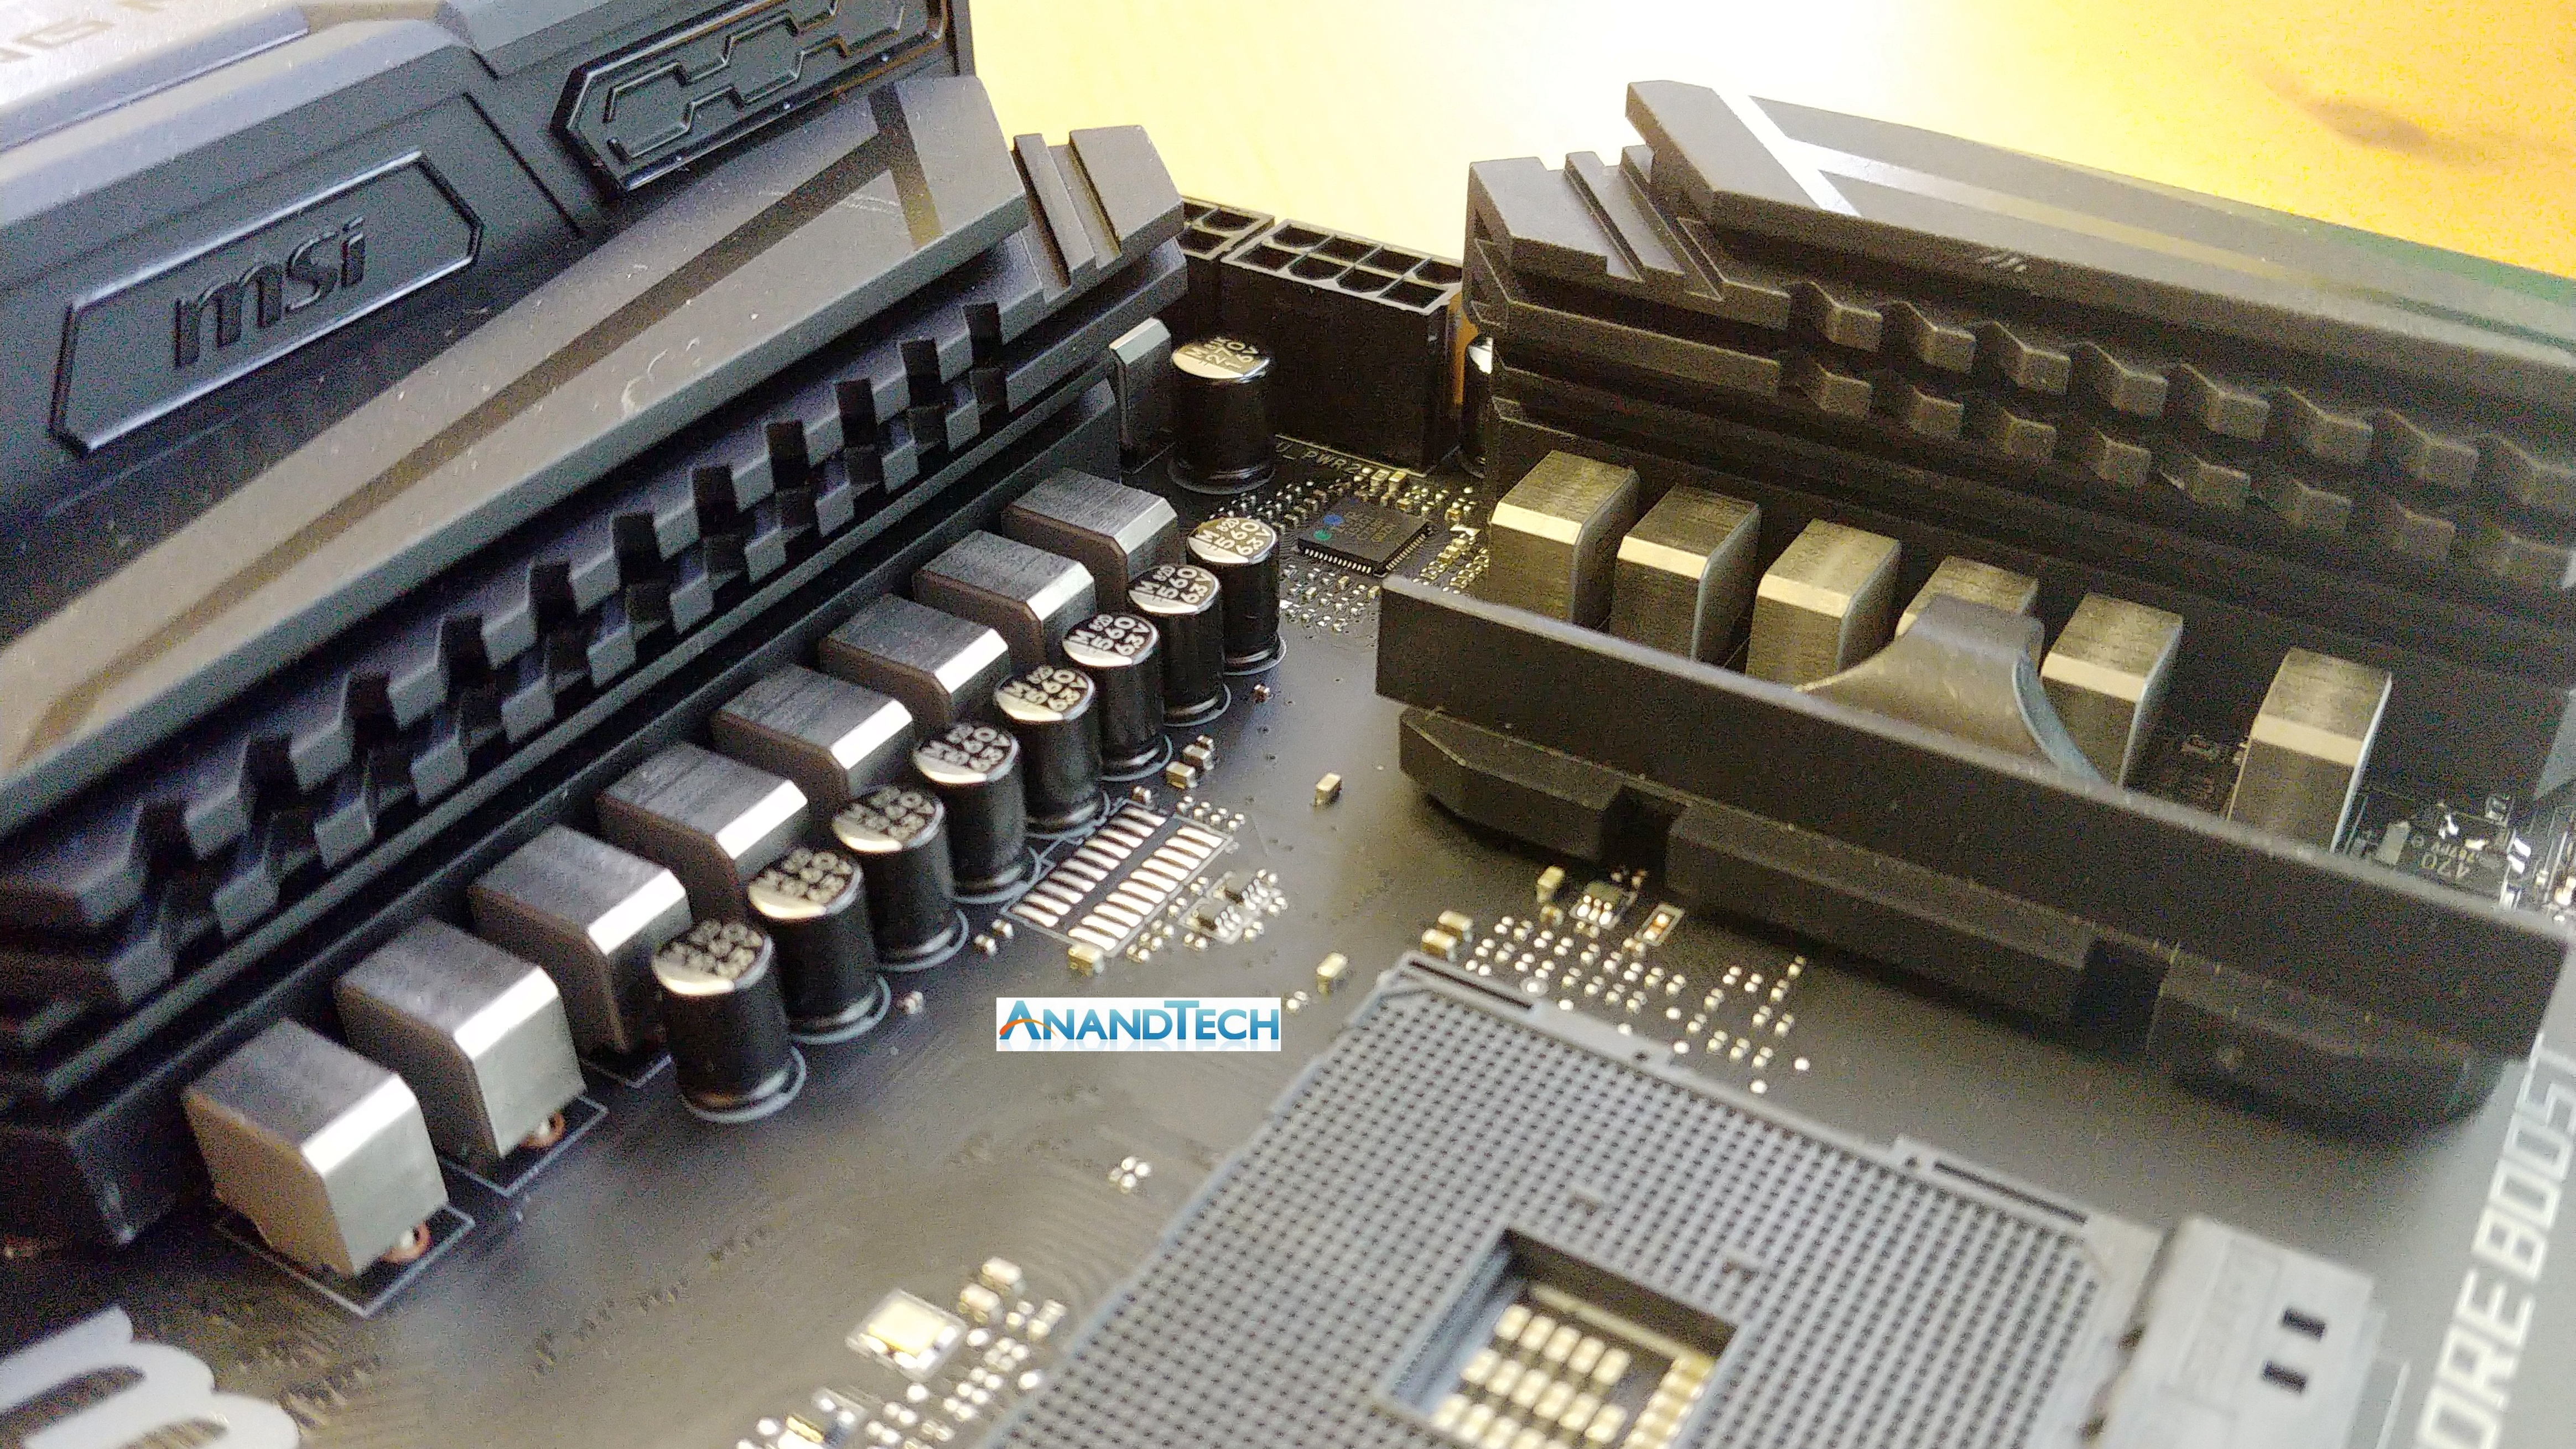
I’m counting 14 chokes on this motherboard, which would make it one of the biggest power delivery options on any AM4 motherboard. The power delivery heatsinks are not connected together, perhaps indicative of cost or MSI’s confidence in the power delivery efficiency. It is worth noting that MSI uses dual 8-pin power for the CPU here, compared to the 8+4-pin arrangement on the ASUS ROG.
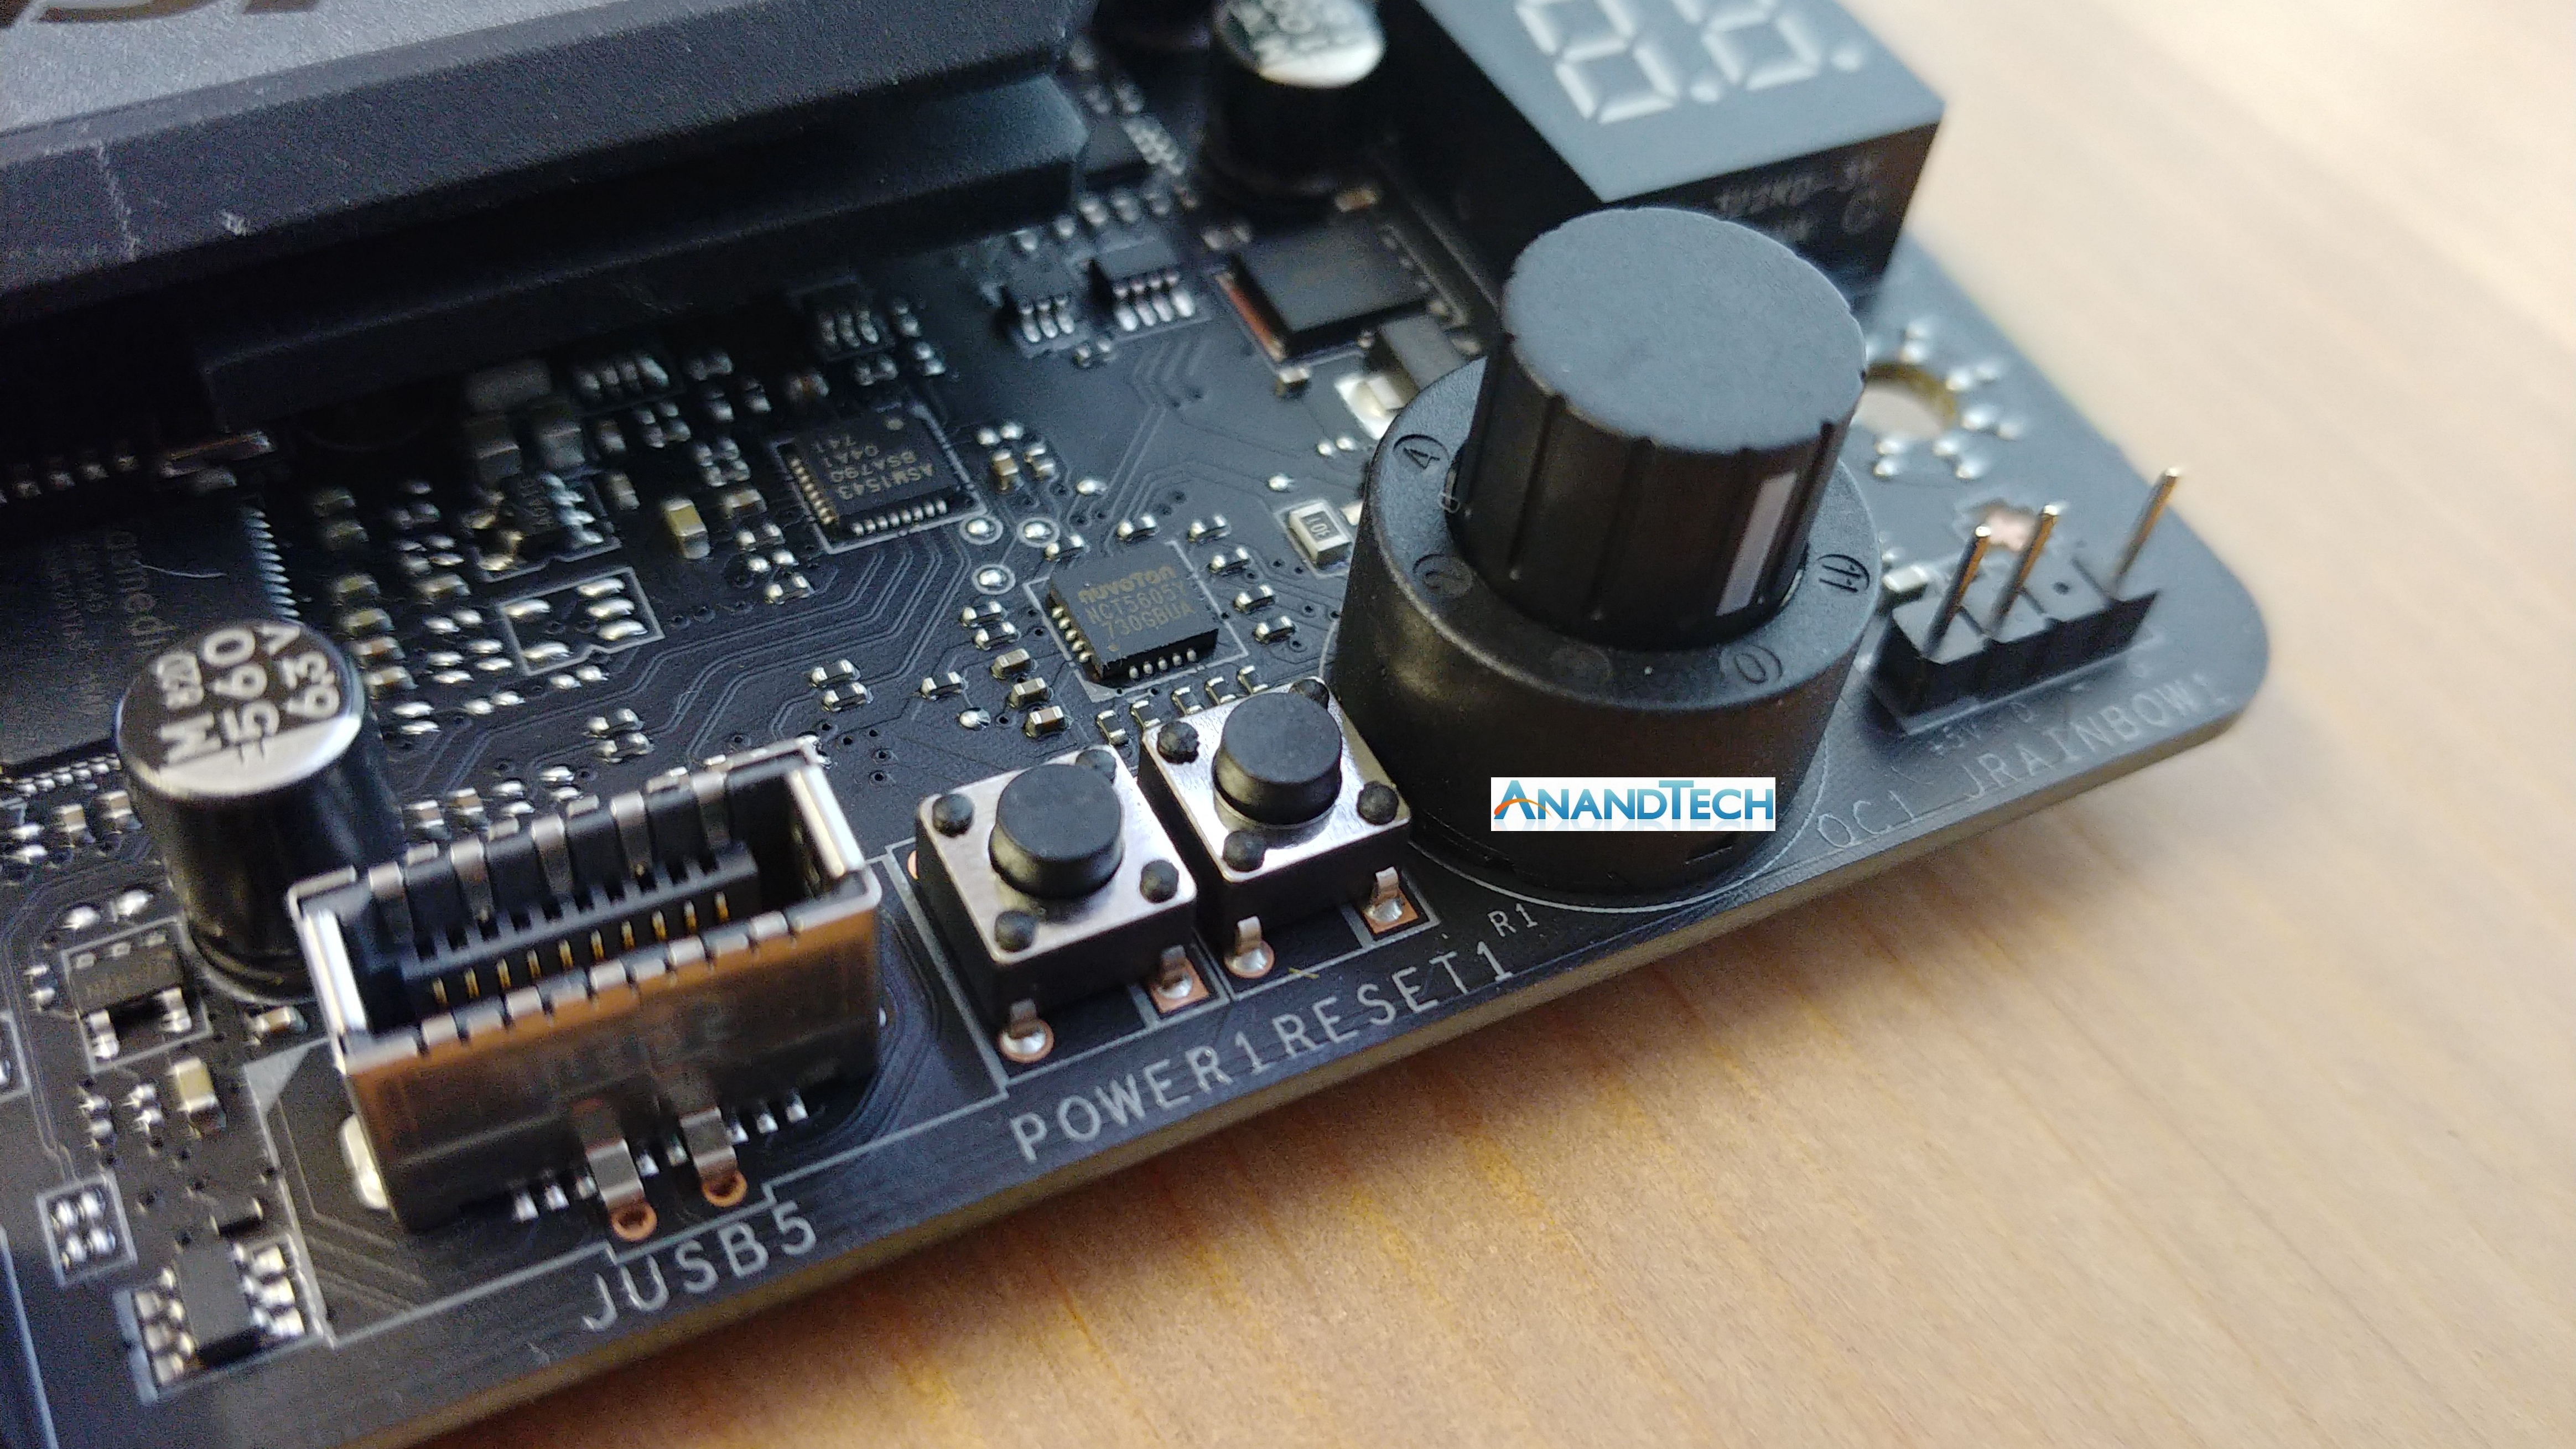
One of the more esoteric features of recent MSI motherboards is this big knob, which goes all the way up to 11. This is MSI’s Game Boost overclocking feature, designed such that each twist gives a bigger overclock boost to the processor. In the past these features are often overly harsh to most processors, in an effort to encapsulate as many as possible, and in the past we’ve never been able to go much beyond the ‘2’ setting on air cooling. Luckily there are power/reset buttons right next to it.
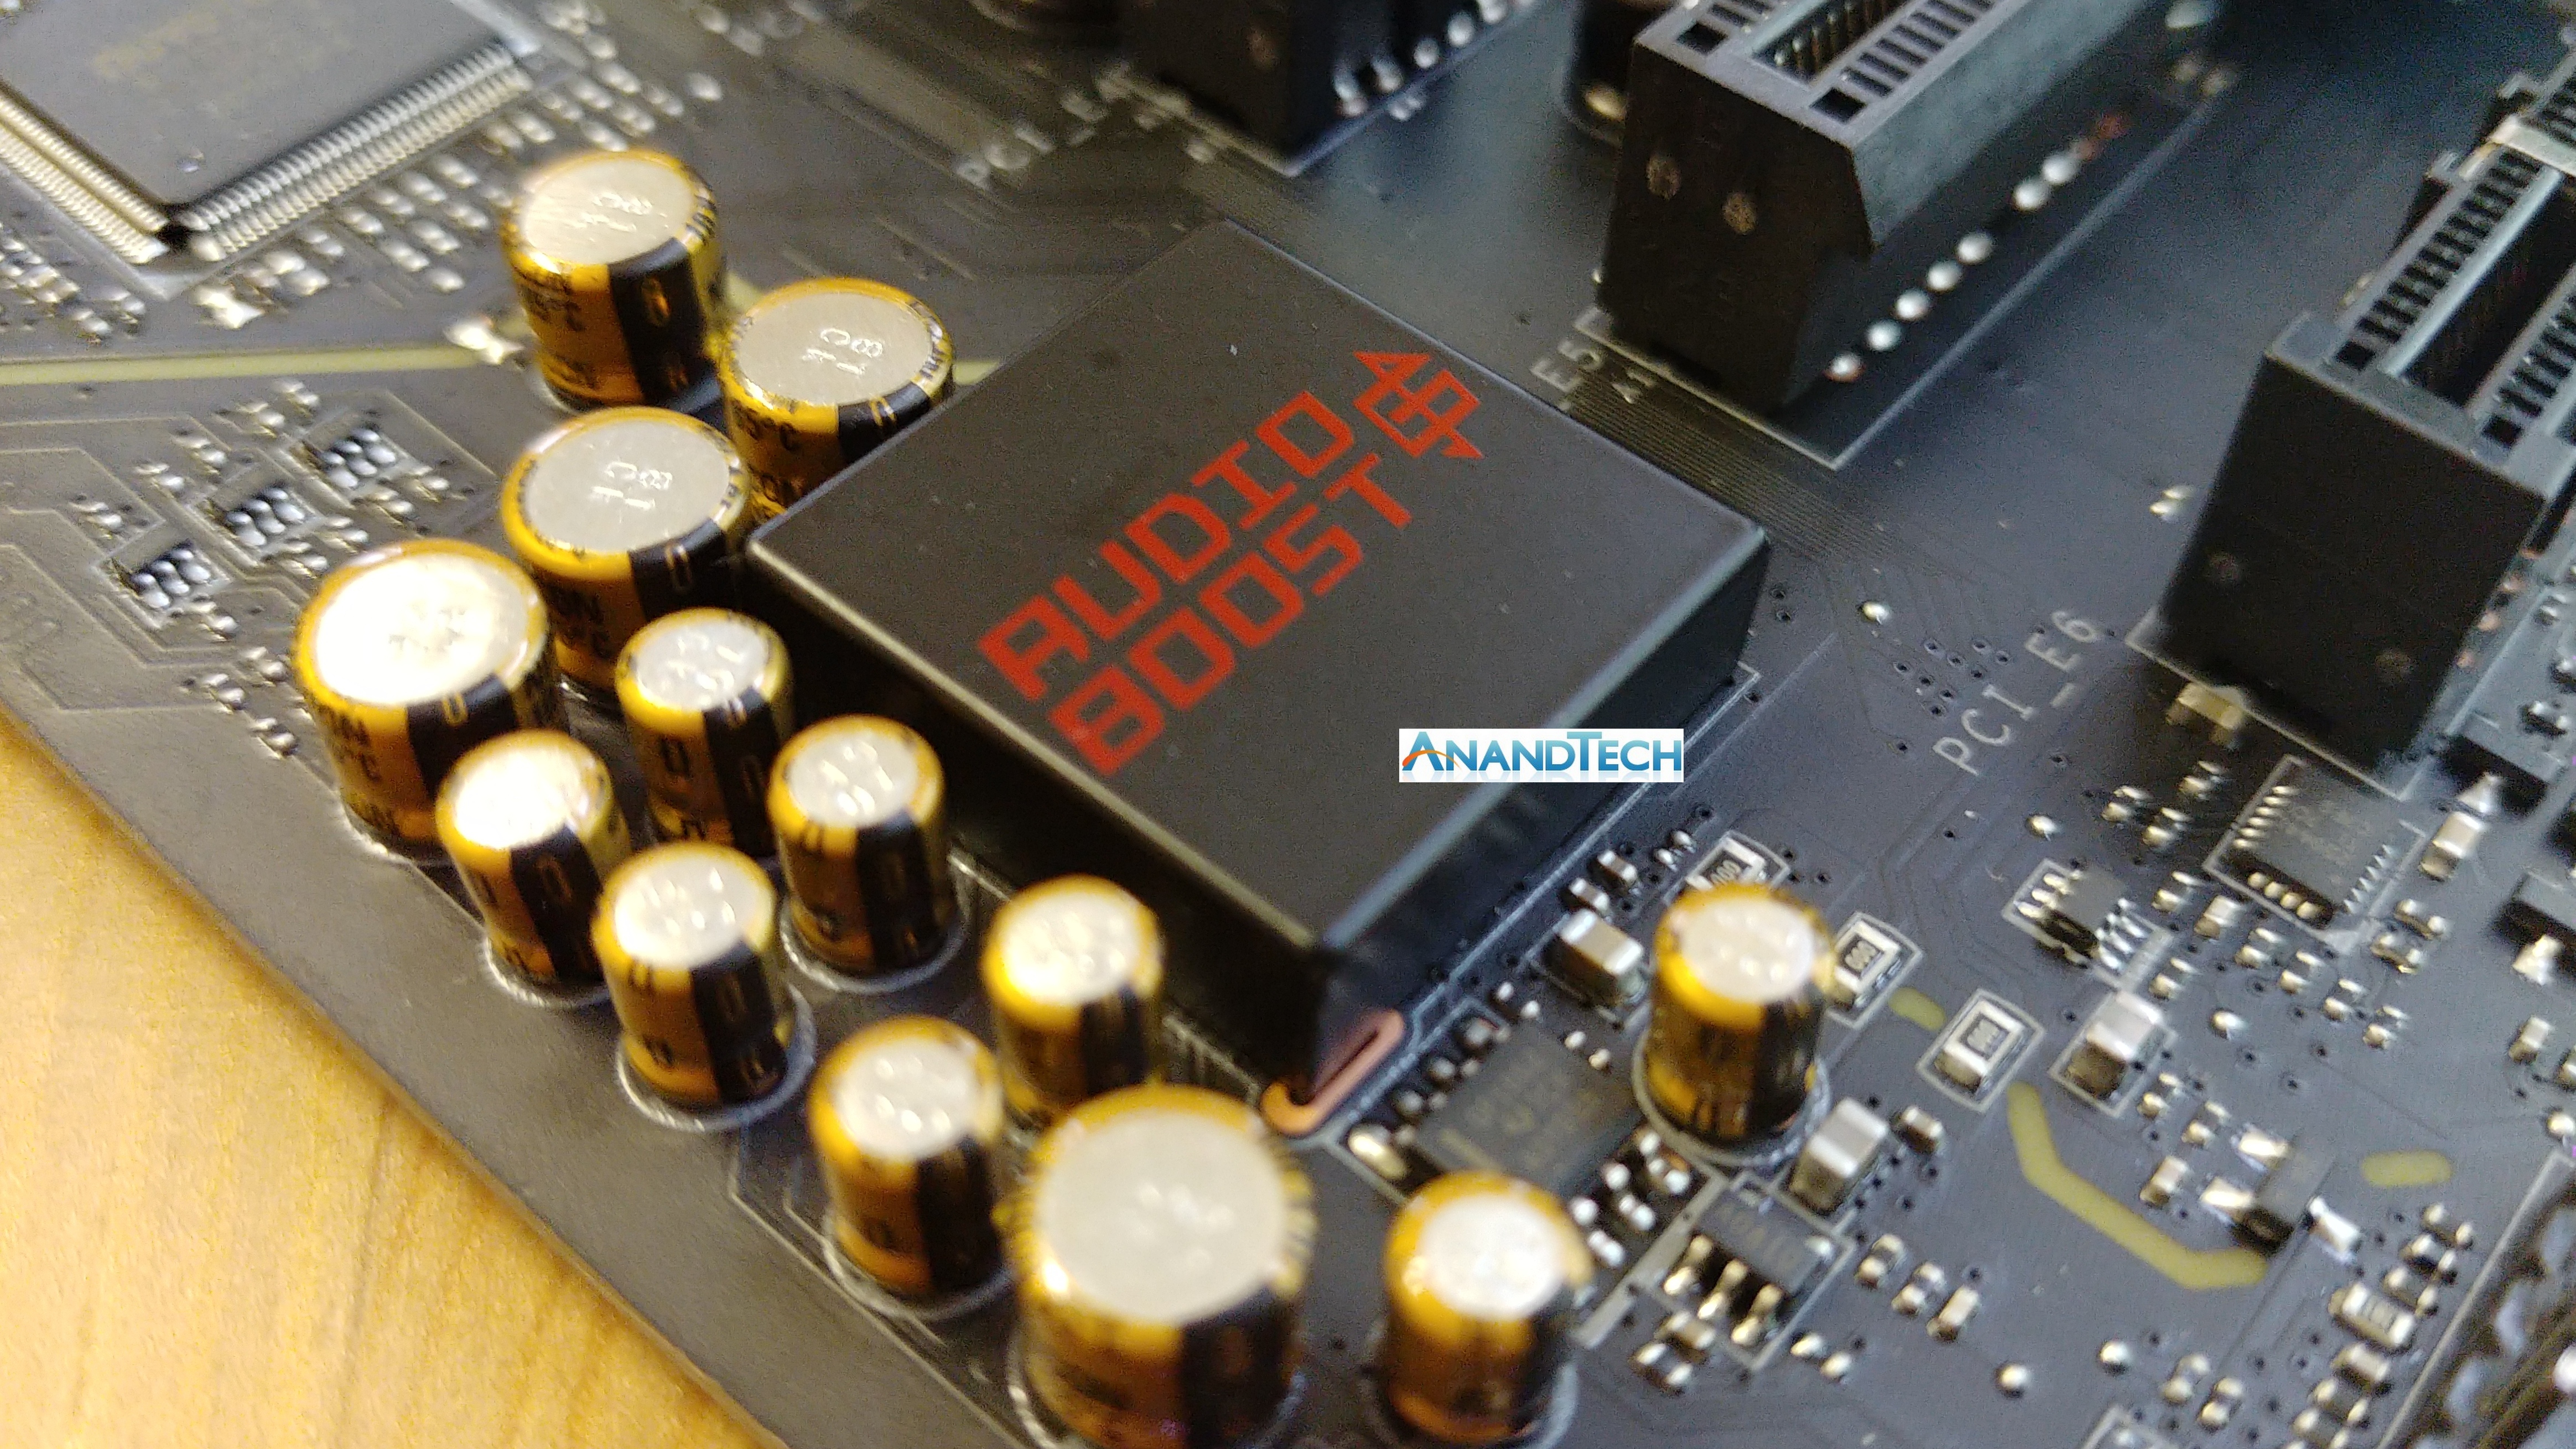
MSI’s Audio Boost 6 branding for the audio is almost like the others: a Realtek ALC1220 codec with specialized audio capacitors, an EMI shield, and PCB separation. MSI’s add here is in the software, using a license from a company called Nahimic to offer various EQ adjustments and in-game benefits.
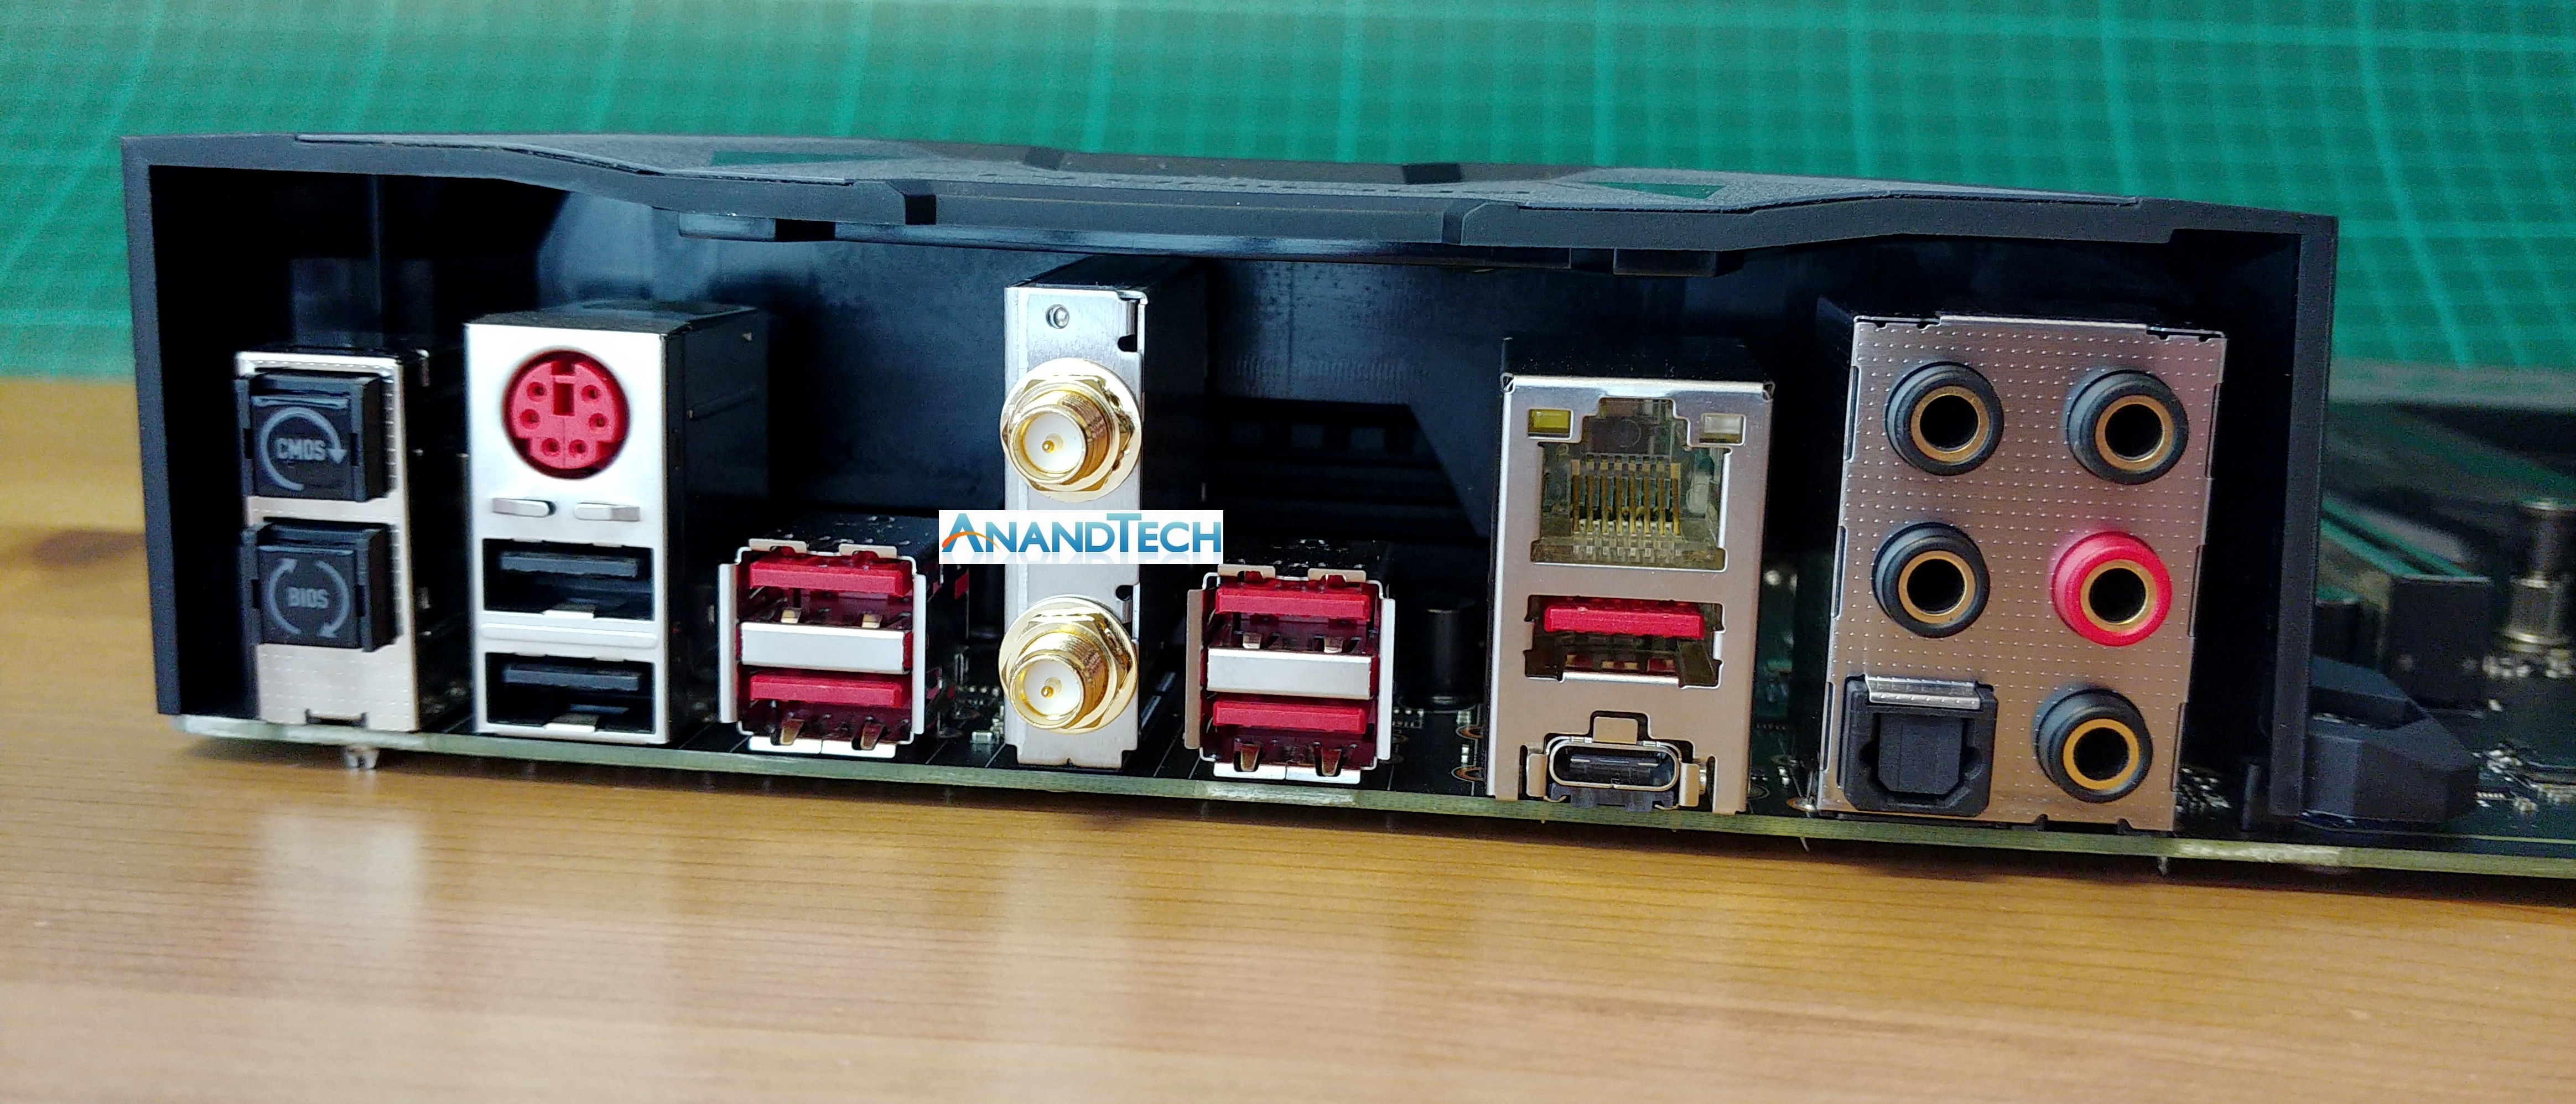
Like the ASUS, MSI offers a BIOS update feature without the CPU/GPU/DRAM installed. On the rest of the rear panel we get two USB 2.0 ports, a combination PS/2 port, four USB 3.0 ports, the 802.11ac Wi-Fi module, two USB 3.1 ports, the gigabit Ethernet port, and the audio jacks.

A couple of interesting things to note on the rear of the board - around the chipset heatsink area, MSI has placed this warning about keeping case standoffs away from the bottom of the board. Because most cases are designed to house all sorts of motherboard form factors, users that take older cases and do not remove the unneeded standoffs can result in short circuits and possibly ruined hardware. Although if a user doesn’t remove the older standoffs, I doubt they will bother reading the rear of the motherboard.
Here’s a handy addition to some motherboards: this tells you how many PCB layers there are. In this case, six. To put that into context, the cheapest motherboards usually have three or four, most mainstream boards will have six or sometimes eight, while high-end desktop usually require eight or ten. Money-no-object motherboards, like server systems, can have twelve. Additional features, like double copper or high-humidity protection, can add +50% each to the cost of the pure PCB.


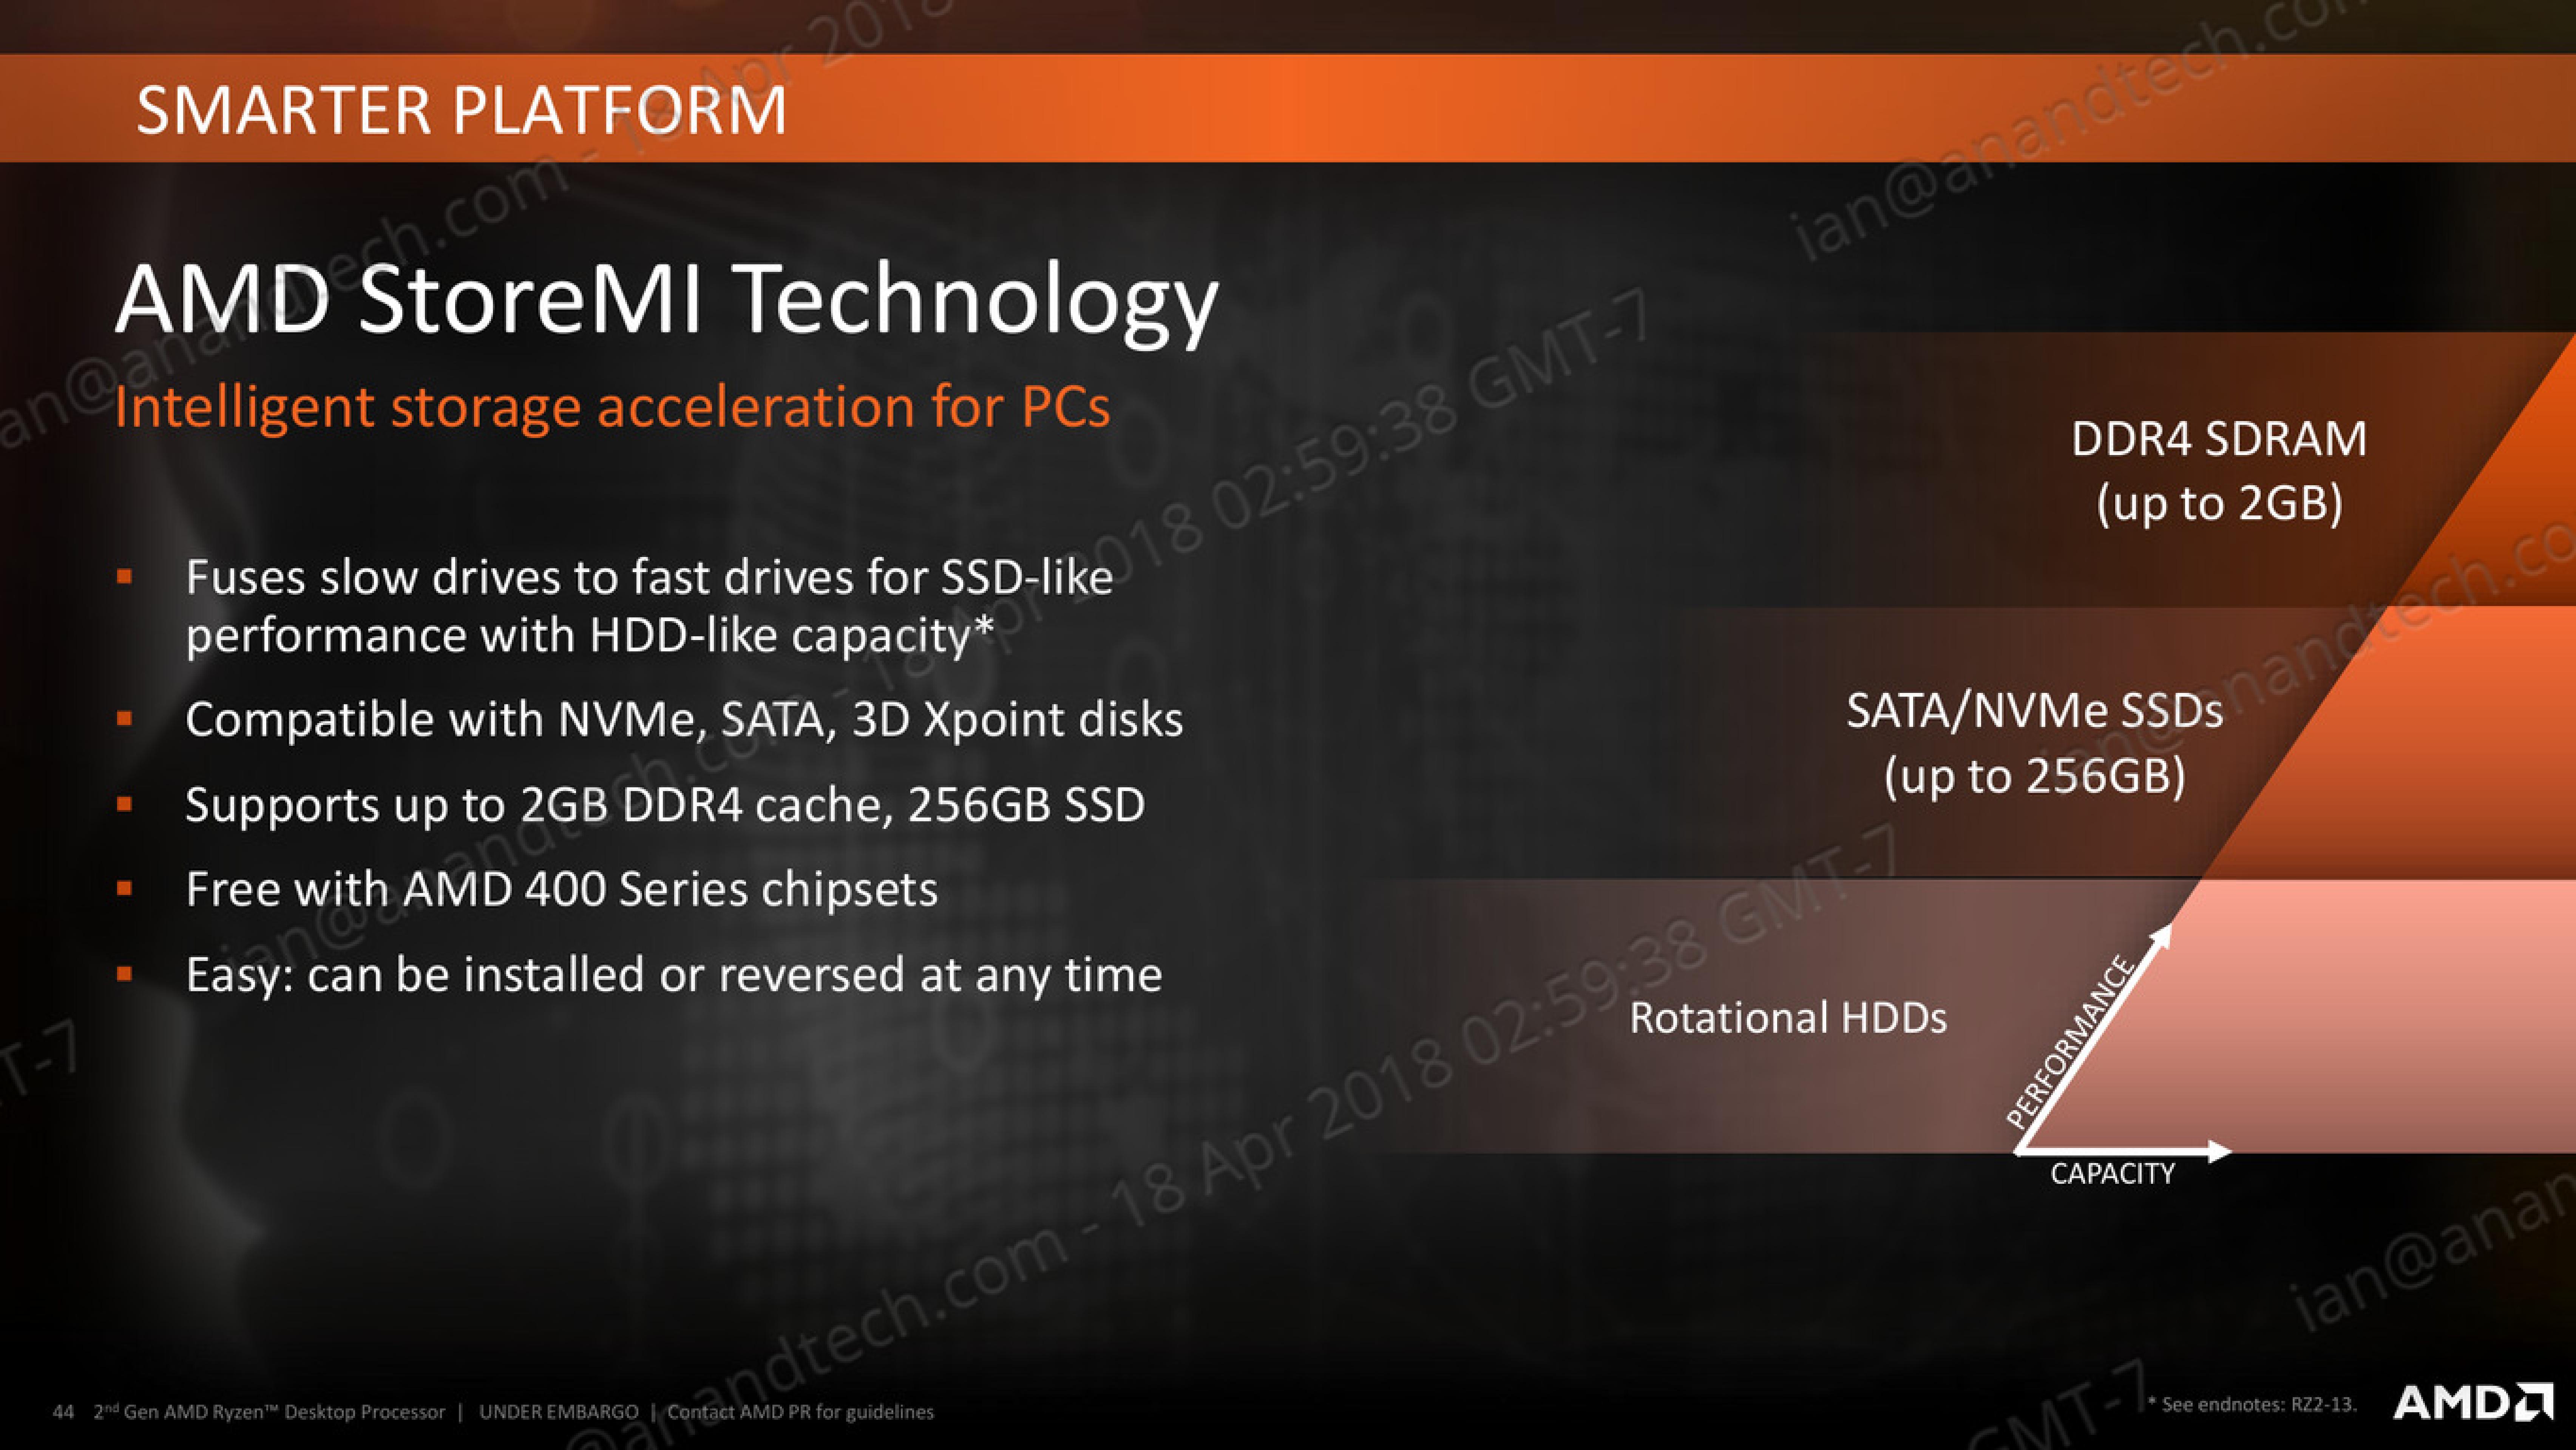
StoreMI: The Way To A Faster JBOD
When AMD launched the Ryzen APUs earlier this year, one of the minor side-announcements was that AMD was promoting software called FuzeDrive, from Enmotus. For an extra $20, this software could be yours. For the new Ryzen-2000 series desktop processors and X470 platform, this software is now branded as part of AMD’s software stack, and can be downloaded for free from the AMD website under the StoreMI branding.
The Benefits of a Cache
The principle for StoreMI is that a user can take a mid-range system, powered by a slow drive, and add a small but fast drive to increase the speed of the most frequently accessed files. The software creates a storage ‘tier’ between the fast drive and the slow drive, giving the user a single drive with the combined capacity of the two drives, while the software implements pattern recognition to understand which files can be placed on the fast drive and help with acceleration.
Tiered storage is not new – it is used in many storage-focused enterprise systems backed by very complex software. Fast storage is small expensive, while content is typically large: content delivery networks (CDNs), like Netflix or Steam, will use tiered storage and caching such that the most frequency accessed films or games will come from storage that is both near to the user and from the fastest possible location.
In a modern computer, the fastest storage is the onboard memory / DRAM. This is where files and programs are loaded to when the processor needs to access the data or keep data close for the lifetime of the software. In recent years certain enthusiasts have used RAMDisks, creating a drive using the onboard memory, to act as a fast repository. The only downside is that the data is lost on restart as the data held in DRAM is volatile (or not persistent).
A modern enthusiast machine is likely to have some sort of solid-state drive (SSD) based on NAND flash – either a drive connected via the PCIe lanes as super-fast storage, or connected through a SATA port. These users often have a mechanical hard-drive, based on spinning platters of rust, as a backup for bulk storage, commonly referred to as a hard-disk drive (HDD), and the speed is limited to how the system reads from a drive that spins at 7200 or 5400 times per second. Many machines still ship with HDDs as their primary and bulk storage, much to the dismay of users that notice the immediate user experience benefit of an SSD.
With StoreMI, a user can take any configuration of PCIe SSD, SATA SSD, or HDD, and implement them into a tiered storage drive. The combined single drive will have the capacity of all the drives in the tier, and the software will manage which data should be moved around into the fast storage drive. This process is gradual, and the software will take time to learn which files are the most important – this will mean that the effect will not be immediately noticeable, but after the third or fourth time that software or a game has been loaded, the system should have a good idea.
The StoreMI tool also allows the user to add up to 2GB of onboard memory into the storage tier. This process does not add additional capacity to the tier, but the DRAM acts as the fastest cache and will hold copies of the data held on other drives such that data is not lost. As mentioned above, as onboard memory is volatile, the speed up information will be lost on restart. In our discussions with AMD, they felt that 2GB was a good amount of memory for this DRAM cache: due to the way the software works, the company said that a large cache showed no tangible benefit. It also allows systems with only 8GB of total system memory to take advantage of the software.
Configurations
Unlike the caching technology behind Intel’s RST (which has only recently supported caching on non-Boot drives), AMD’s StoreMI can be used at any time in the lifecycle of the system. For any user that wants to delay the purchase of an SSD NVMe or SSD SATA storage drive, or delay to buy a bigger drive, they can do so and implement it into the tiered storage at a later date.
StoreMI can support almost any configuration requested, either on a Boot drive or on a data drive. For a Boot drive, AMD recommends installing the operating system on the higher capacity slower drive first, such that the HDD, and adding a blank SSD as the fast tier, although the reverse is also possible for users that want to add the larger drive later (there may be additional steps to the process). The only difference is that the software is likely to move a lot of data around at the beginning.

Configurations that are suggested for StoreMI are:
- HDD + DRAM
- HDD + SATA SSD
- HDD + SATA SSD + DRAM
- HDD + NVMe SSD
- HDD + NVMe SSD + DRAM
- SATA SSD + DRAM
- SATA SSD + NVMe SSD + DRAM
- NVMe SSD + DRAM
The biggest noticeable improvement should occur in configuration 4, when an NVMe SSD is paired with a mechanical HDD.
AMD states that if a tier reaches across from native chipset to controller based SATA ports, the software is likely to move files related to hibernation over to the drive on the native SATA ports for stability; this process might take up to 30 minutes.
Users can also remove drives from the tiered storage, if there is enough space to put all the data on the drive that stays in the tier. The removed drive will be left with zero data, and can be removed from the system or used for other things.
The Big Limitation: 256 GB on the Fast Tier
A point not mentioned in our initial briefings when FuzeDrive was launched alongside the APUs, but repeated sufficiently in the StoreMI User Guide, is that AMD’s bulk licensing deal with Enmotus means that the faster drive in the tier can only be up to 256GB in size.
When adding a drive larger than 256GB as the fast tier, the system will partition the blank drive automatically, offering the extra capacity as a separate drive letter on its own.
When adding a large HDD as the slow tier to an SSD boot drive, this is only a problem if the SSD is bigger than 256. Users in this circumstance will be required to migrate the operating system (using other software) from the SSD to the HDD first, then boot the system using the HDD and add the (now blank) SSD as a fast tier.
Some users might see this as a big deal – adding a 3TB HDD slow drive to a 512GB SSD-based boot drive shouldn’t have to be this complicated. However in this circumstance it might be suggested that the drives be kept separate, and items like the Steam folder are manually bifurcated into two locations with the favorite games on the sizeable SSD. However StoreMI is geared more towards systems that would naturally only have a large HDD in them to begin with – adding in a small fast SSD, say 64GB-128GB, is the intended use case here.
The Failure Rate: Downsides of a JBOD
Most options for combining drives in an array involve an element of speed (reading data across many drives at once) or protection against failures (data is replicated, or a parity bit is introduced), and usually storage array options combine both, trading failure protection for speed or vice-versa. For users involved in storing files, one of the options for combining drives is known as a JBOD, or ‘just a bunch of disks’. A JBOD offers neither speed nor failure protection.
A JBOD array does one thing: it combines the drives into the array to appear as one contiguous file space, and it treats it as such. Putting eight 10 TB drives into a JBOD will appear as an 80 TB drive in a system. However, it does not read from or write to the drives simultaneously – it will purely write data in a sequential manner and read the data from the drive that has it. As a result, it is still only as fast as a single drive, but if one of the drives in the JBOD array fails, the array is broken and the array is lost. Without specialist tools, all the data is lot from the whole array as well, and the data on that specific drive is almost certainly gone. If a single drive has an average failure rate, an eight drive array is expected to fail eight times as frequently as it relies on every drive being in workable condition.
What StoreMI does in this context is that it suffers from the same lack of protection from drive failures. There is no mechanism by which the data is protected if one drive in the tier fails – if one drive in the tier fails, the data across all the drives is lost. If the boot drive is a bargain SSD using low quality NAND, or the hard drive is old, then losing the data across both drives is a real possibility.
Initially I thought this was a significant issue. If a user was to put 10 drives into the tier, for example, it could spell disaster. The significance was muted however, when I learned of the 256 GB fast tier size limit, as it means that most users are likely to only pair two drives into a tier. AMD’s response to the threat of failure was to say that users should expect to keep backups regardless, and no specific comment was made based on the increased failure rate of a two-drive tier compared to a single drive. Because StoreMI moves data around from SSD to HDD, there could be additional concern as the software could write more data to the SSD over time than a casual user might do if it was just the boot drive, causing the NAND to wear out quicker. Neither AMD nor AnandTech see this as much of an issue, given that modern MLC and TLC SSDs are very good at managing bad data blocks and have overprovisioning built in.
Benchmarks!?
At present we haven’t had time to directly test StoreMI, having focused on other projects and upcoming events. If we get time, we will have a new article on StoreMI.
Benchmarking Setup
Testing with Spectre and Meltdown Patches Applied
For our testing on the new AMD Ryzen 2000-series processors and the Intel processors, we enabled the latest version of Microsoft Windows with the latest updates and also BIOS microcode updates to ensure that the Spectre and Meltdown vulnerabilites were as patched as could possibly be. This means that some of the data used in this review is not comparable to previous reviews, however in time we expect our benchmark database to be up to date with these patches.
Test Bed
As per our processor testing policy, we take a premium category motherboard suitable for the socket, and equip the system with a suitable amount of memory running at the manufacturer's maximum supported frequency.
It is noted that some users are not keen on this policy, stating that sometimes the maximum supported frequency is quite low, or faster memory is available at a similar price, or that the speeds can be prohibitive for performance. While these comments make sense, ultimately very few users apply memory profiles (either XMP or other) as they require interaction with the BIOS, and most users will fall back on JEDEC supported speeds - this includes home users as well as industry who might want to shave off a cent or two from the cost or stay within the margins set by the manufacturer. Where possible, we will extend out testing to include faster memory modules either at the same time as the review or a later date.
| Test Setup | |||||||
| AMD | Intel Core | ||||||
| Processor | AM4 | FM2+ | LGA1151 | LGA1151 | LGA2066 | ||
| R7 2700X R7 2700 R5 2600X R5 2600 R7 1800X R5 1600 A12-9800 |
A10-7870K | i7-8700K i7-8700 |
i7-7700K i7-6700K |
i7-7820X i9-7980XE |
|||
| Motherboards | AM4: ASUS Crosshair VII Hero FM2+: ASUS A88X Pro |
LGA1151 (CFL): ASR Z370 Gaming i7 LGA1151: GBT X170-Gaming ECC LGA2066: ASR X299 OC Formula |
|||||
| BIOS | 0508 | 2502 | P1.70 | F21e | P1.40 | ||
| Smeltdown | Yes | OS-level | Yes | Yes | Yes | ||
| Cooling | AM4: Wraith Prism RGB FM2+: Arctic Freezer 13 CO |
LGA1151: Silverstone AR10-115XS LGA2066: Thermalright TRUE Copper |
|||||
| Power Supply | Corsair AX760i PSU | ||||||
| Memory | G.Skill SniperX Crucial Ballistix G.Skill RipjawsV |
||||||
| Memory Settings | Ryzen-2000: DDR4-2933 16-17-17 Ryzen-1000: DDR4-2666 16-17-17 Bristol Ridge: DDR4-2400 15-17-17 Kaveri: DDR3-2133 9-11-11 |
Coffee Lake: DDR4-2666 16-17-17 Kaby Lake: DDR4-2400 15-15-15 Skylake: DDR4-2133 15-15-15 Skylake-X: DDR4-2400 14-16-16 |
|||||
| GPUs | MSI GTX 1080 Gaming 8G | ||||||
| Hard Drive | Crucial MX200 1TB | ||||||
| Optical Drive | LG GH22NS50 | ||||||
| Case | Open Test Bed | ||||||
| OS | Windows 10 Enterprise RS3 (1803) with OS Patches | ||||||
Power Analysis
One of the key debates around power comes down to how TDP is interpreted, how it is measured, and what exactly it should mean. TDP, or Thermal Design Power, is typically a value associated with the required dissipation ability of the cooler being used, rather than the power consumption. There are some finer physics-related differences for the two, but for simplicity most users consider the TDP as the rated power consumption of the processor.
What the TDP is actually indicating is somewhat more difficult to define. For any Intel processor, the rated TDP is actually the thermal dissipation requirements (or power consumption) when the processor is running at its base frequency. So for a chip like the Core i5-8400 that is rated at 65W, it means that the 65W rating only applies at 2.8 GHz. What makes this confusing is that the offical turbo rating for the Core i7-8700 is 3.8 GHz on all cores, well above the listed base frequency. The truth is that if the processor is limited in firmware to 65W, we will only see 3.2 GHz when all cores are loaded. This is important for thermally limited scenarios, but it also means that without that firmware limit, the power consumption is untied to the TDP: Intel gives no rating for TDP above that base frequency, despite the out-of-the-box turbo performance being much higher.
For AMD, TDP is calculated a little differently. It used to be defined as the peak power draw of the CPU, including turbo, under real all-core workloads (rather than a power virus). Now TDP is more of a measure for cooling performance. AMD defines TDP as the difference between the processor lid temperate and the intake fan temperature divided by the minimum thermal cooler performance required. Or to put it another way, the minimum thermal cooler performance is defined as the temperature difference divided by the TDP. As a result, we end up with a sliding scale: if AMD want to define a cooler with a stronger thermal performance, it would lower the TDP.
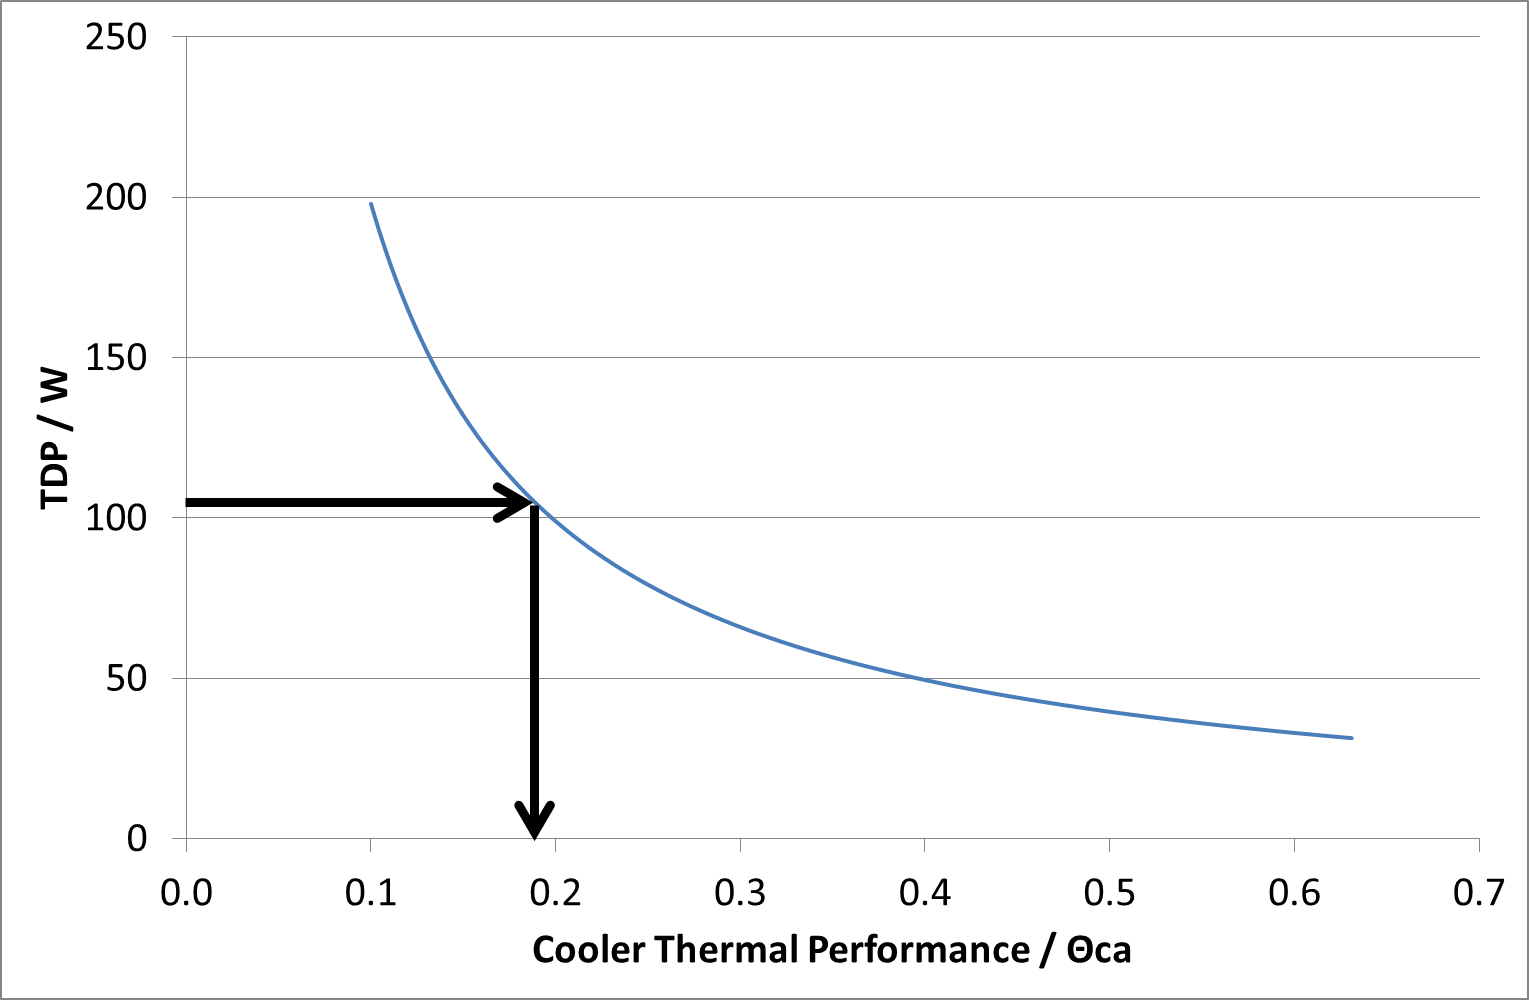
For Ryzen, AMD dictates that this temperature difference is 19.8ºC (61.8 ºC on processor when inlet is 42ºC), which means that for a 105W TDP, the cooler thermal performance needs a to be able to sustain 0.189 ºC per Watt. With a cooler thermal performance of 0.4 ºC/W, the TDP would be rated at 50W, or a value of 0.1 would give 198 W.
This ultimately makes AMD's TDP more of a measure of cooling performance than power consumption.
When testing, we are also at the whim of the motherboard manufacturer. Ultimately for some processors, turbo modes are defined by a look-up table. If the system is using X cores, then the processor should run at Y frequency. Not only can motherboard manufacturers change that table with each firmware revision, but Intel has stopped making this data official. So we cannot tell if a motherboard manufacturer is following Intel's specifications or not - in some reviews, we have had three different motherboard vendors all have different look up tables, but all three stated they were following Intel specifications. Nice and simple, then.
It should also be stated that we are at the whim of a lottery. While two processors could be stamped as the same, how the processor responds to voltage and frequency could actually be very different. The stamp on the box is merely a minimum guarantee, and the actual performance or thermal characteristics of the processor can vary from the minimu guarantee to something really, really good. Both AMD and Intel go through a process called binning, whereby every processor off the manufacturing line is tested to meet with certain standards - if it surpasses the best standards, it gets stamped as the best processor. If it doesn't meet those standards, it might be labelled as something else. There is also the fact that if a manufacturer needs more mid-range components, they might alter the percentage of parts that do meet the high standard but will be stamped as if they meet a medium standard. So a lottery it is.
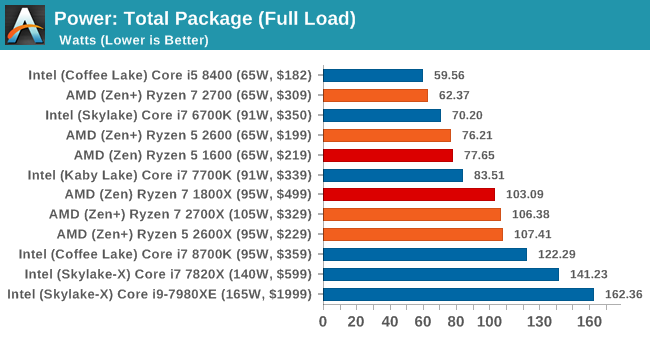
In our testing, we take the power value readings from the internal registers on the processor designed to estimate the power consumption and apply the right turbo and fan profiles. This method is strictly speaking not the most accurate - for that we would be applying our multimeters. But what it does do is give us more information than a multi-meter would. Modern multi-core processors use different voltage plans for different parts of the processor, or even for each core, so the software readings give us a good breakdown of power for the different regions. This is good if the processor makes it available, but this is not always the case. In most situations, we are able to get the two main important numbers: the estimated power consumption of the whole chip, and the estimated power consumption of just the cores (not the memory controller or interconnects).
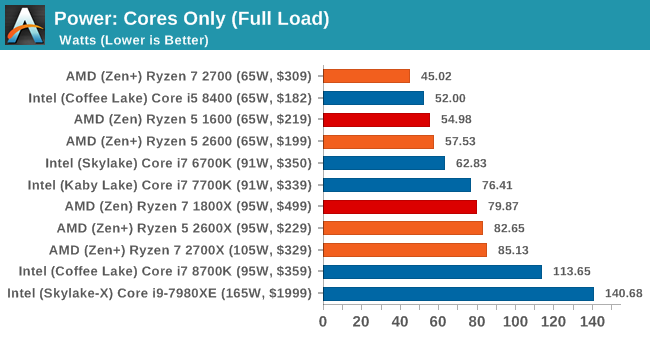
What is noticable between the Intel and AMD chips is the difference between core-only power and full-chip power. AMD's interconnect, Infinity Fabric, combined with the other non-core components of the chip, draw a lot more power than the Intel chips do. This arguably leaves more power budget for Intel to push the frequencies. That being said, AMD is keeping power consumption around the TDP values: our Ryzen 7 2700 is especially efficient, while we seem to have an average Ryzen 5 2600. By contrast, the Intel Core i7-8700K blasts past its TDP value very easily, whereas the older Kaby Lake processors are more in line with their TDP values.
Many Thanks To
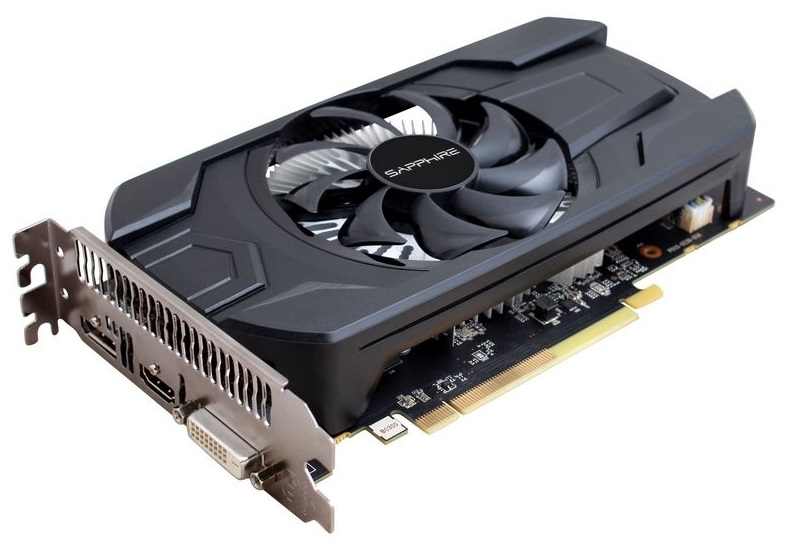
Thank you to Sapphire for providing us with several of their AMD GPUs. We met with Sapphire back at Computex 2016 and discussed a platform for our future testing on AMD GPUs with their hardware for several upcoming projects. Sapphire passed on a pair of RX 460s to be used as our CPU testing cards. The amount of GPU power available can have a direct effect on CPU performance, especially if the CPU has to spend all its time dealing with the GPU display. The RX 460 is a nice card to have here, as it is powerful yet low on power consumption and does not require any additional power connectors. The Sapphire Nitro RX 460 2GB still follows on from the Nitro philosophy, and in this case is designed to provide power at a low price point. Its 896 SPs run at 1090/1216 MHz frequencies, and it is paired with 2GB of GDDR5 at an effective 7000 MHz.
We must also say thank you to MSI for providing us with their GTX 1080 Gaming X 8GB GPUs. Despite the size of AnandTech, securing high-end graphics cards for CPU gaming tests is rather difficult. MSI stepped up to the plate in good fashion and high spirits with a pair of their high-end graphics. The MSI GTX 1080 Gaming X 8GB graphics card is their premium air cooled product, sitting below the water cooled Seahawk but above the Aero and Armor versions. The card is large with twin Torx fans, a custom PCB design, Zero-Frozr technology, enhanced PWM and a big backplate to assist with cooling. The card uses a GP104-400 silicon die from a 16nm TSMC process, contains 2560 CUDA cores, and can run up to 1847 MHz in OC mode (or 1607-1733 MHz in Silent mode). The memory interface is 8GB of GDDR5X, running at 10010 MHz. For a good amount of time, the GTX 1080 was the card at the king of the hill.
Further Reading: AnandTech’s NVIDIA GTX 1080 Founders Edition Review

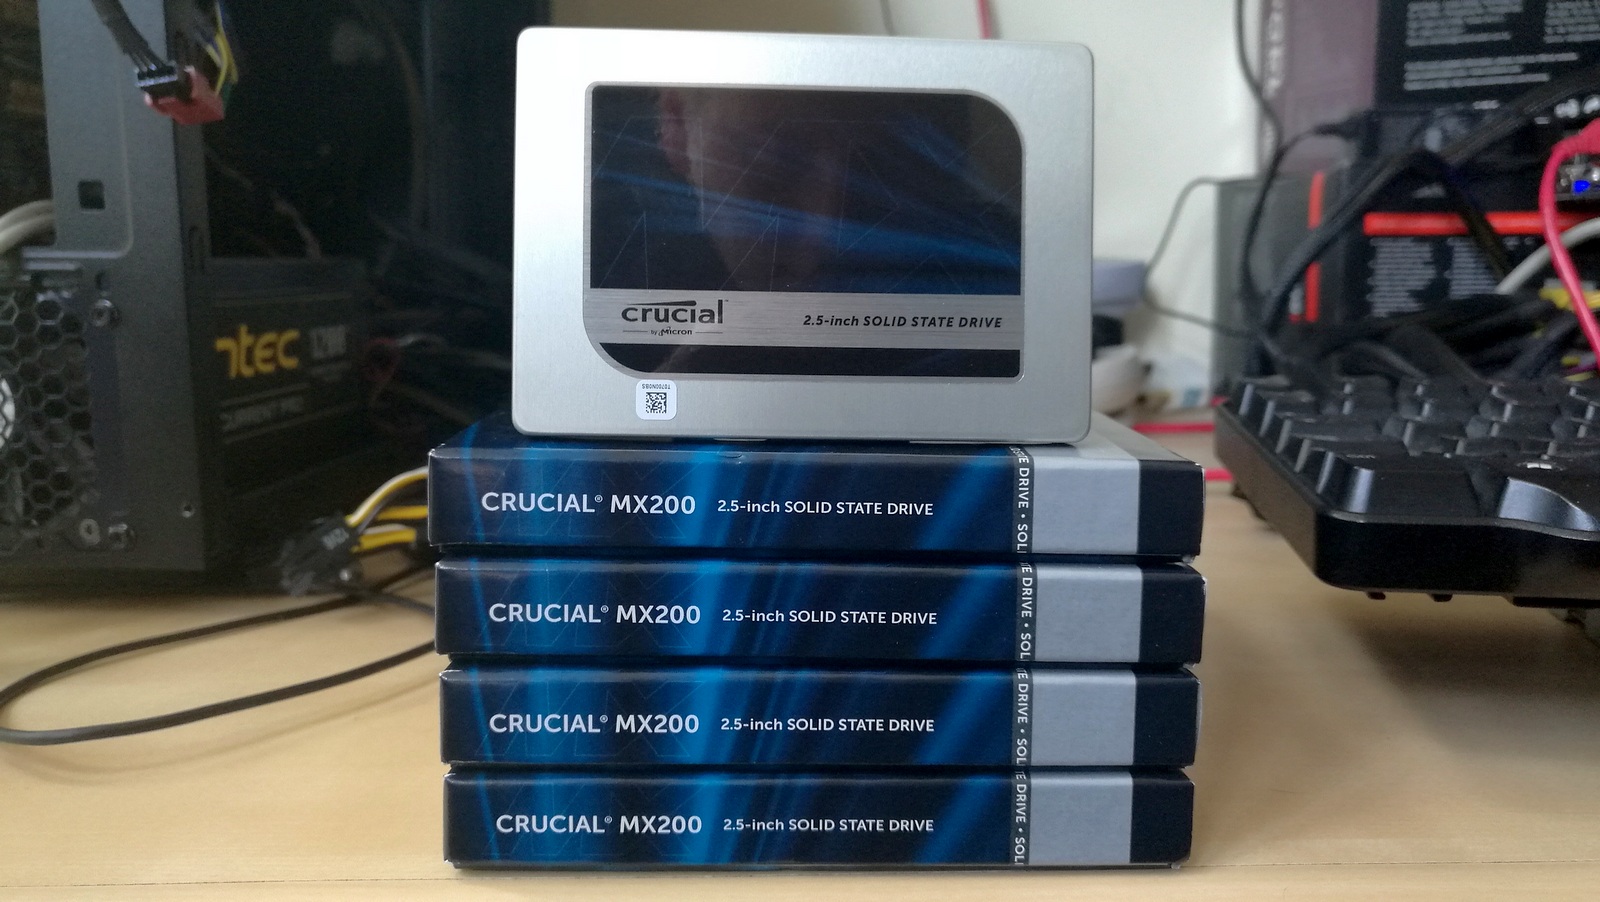
Thank you to Crucial for providing us with MX200 SSDs. Crucial stepped up to the plate as our benchmark list grows larger with newer benchmarks and titles, and the 1TB MX200 units are strong performers. Based on Marvell's 88SS9189 controller and using Micron's 16nm 128Gbit MLC flash, these are 7mm high, 2.5-inch drives rated for 100K random read IOPs and 555/500 MB/s sequential read and write speeds. The 1TB models we are using here support TCG Opal 2.0 and IEEE-1667 (eDrive) encryption and have a 320TB rated endurance with a three-year warranty.
Further Reading: AnandTech's Crucial MX200 (250 GB, 500 GB & 1TB) Review
Thank you to Corsair for providing us with an AX1200i PSU. The AX1200i was the first power supply to offer digital control and management via Corsair's Link system, but under the hood it commands a 1200W rating at 50C with 80 PLUS Platinum certification. This allows for a minimum 89-92% efficiency at 115V and 90-94% at 230V. The AX1200i is completely modular, running the larger 200mm design, with a dual ball bearing 140mm fan to assist high-performance use. The AX1200i is designed to be a workhorse, with up to 8 PCIe connectors for suitable four-way GPU setups. The AX1200i also comes with a Zero RPM mode for the fan, which due to the design allows the fan to be switched off when the power supply is under 30% load.
Further Reading: AnandTech's Corsair AX1500i Power Supply Review

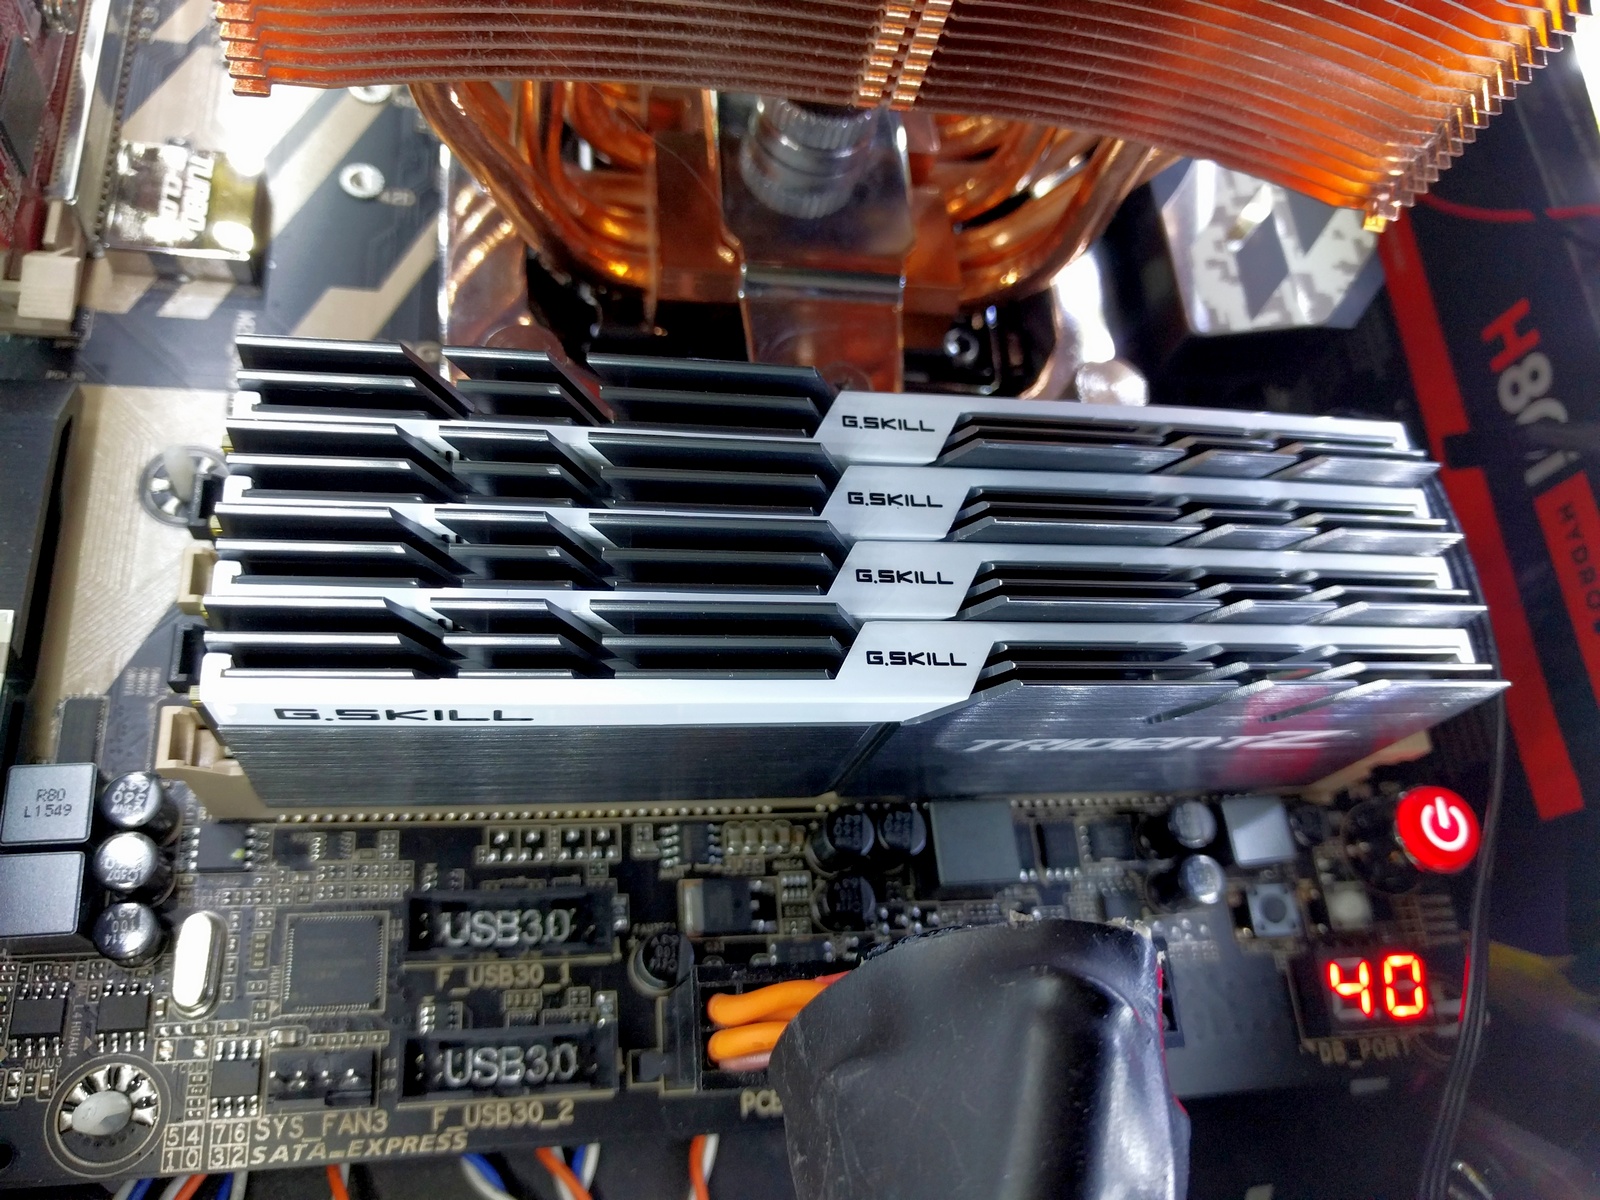
Thank you to G.Skill for providing us with memory. G.Skill has been a long-time supporter of AnandTech over the years, for testing beyond our CPU and motherboard memory reviews. We've reported on their high capacity and high-frequency kits, and every year at Computex G.Skill holds a world overclocking tournament with liquid nitrogen right on the show floor.
Further Reading: AnandTech's Memory Scaling on Haswell Review, with G.Skill DDR3-3000
CPU System Tests
Our first set of tests is our general system tests. These set of tests are meant to emulate more about what people usually do on a system, like opening large files or processing small stacks of data. This is a bit different to our office testing, which uses more industry standard benchmarks, and a few of the benchmarks here are relatively new and different.
All of our benchmark results can also be found in our benchmark engine, Bench.
FCAT Processing: link
One of the more interesting workloads that has crossed our desks in recent quarters is FCAT - the tool we use to measure stuttering in gaming due to dropped or runt frames. The FCAT process requires enabling a color-based overlay onto a game, recording the gameplay, and then parsing the video file through the analysis software. The software is mostly single-threaded, however because the video is basically in a raw format, the file size is large and requires moving a lot of data around. For our test, we take a 90-second clip of the Rise of the Tomb Raider benchmark running on a GTX 980 Ti at 1440p, which comes in around 21 GB, and measure the time it takes to process through the visual analysis tool.
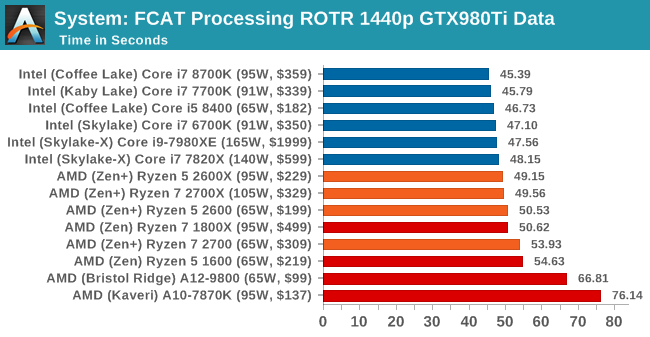
FCAT is a purely single threaded task, and it takes benefits from the top frequency parts and high IPC from Intel. On the AMD front, the Ryzen 5 parts are scoring better than the Ryzen 7 parts, but are within an error margin.
Dolphin Benchmark: link
Many emulators are often bound by single thread CPU performance, and general reports tended to suggest that Haswell provided a significant boost to emulator performance. This benchmark runs a Wii program that ray traces a complex 3D scene inside the Dolphin Wii emulator. Performance on this benchmark is a good proxy of the speed of Dolphin CPU emulation, which is an intensive single core task using most aspects of a CPU. Results are given in minutes, where the Wii itself scores 17.53 minutes (1052 seconds).
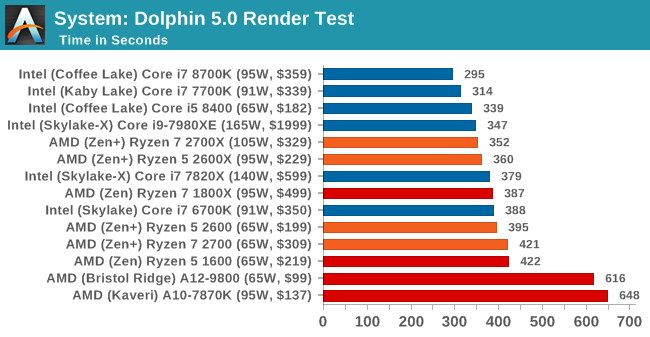
Dolphin is also a single threaded test, and has historically had benefits on Intel CPUs. The new Ryzen-2000 series, with extra IPC and frequency, are pushing ahead of Intel's Skylake parts.
3D Movement Algorithm Test v2.1: link
This is the latest version of the self-penned 3DPM benchmark. The goal of 3DPM is to simulate semi-optimized scientific algorithms taken directly from my doctorate thesis. Version 2.1 improves over 2.0 by passing the main particle structs by reference rather than by value, and decreasing the amount of double->float->double recasts the compiler was adding in. It affords a ~25% speed-up over v2.0, which means new data.
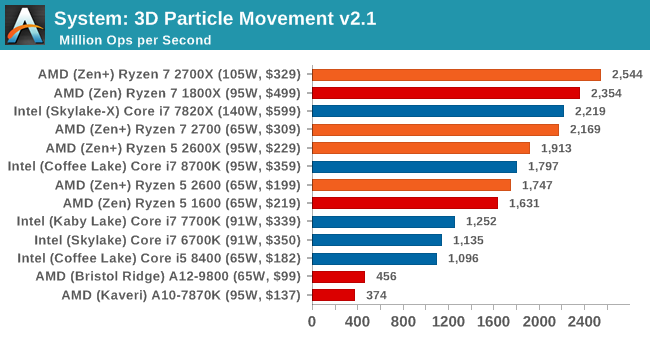
For this multi-threaded test, the new 8-core Ryzen 7 2700X pulls further head of Intel's 8-core Skylake-X compared to the 1800X. At six cores however, the Coffee Lake i7-8700K is sandwiched between the Ryzen 5 2600X and Ryzen 5 2600.
Agisoft Photoscan 1.3: link
Photoscan stays in our benchmark suite from the previous version, however now we are running on Windows 10 so features such as Speed Shift on the latest processors come into play. The concept of Photoscan is translating many 2D images into a 3D model - so the more detailed the images, and the more you have, the better the model. The algorithm has four stages, some single threaded and some multi-threaded, along with some cache/memory dependency in there as well. For some of the more variable threaded workload, features such as Speed Shift and XFR will be able to take advantage of CPU stalls or downtime, giving sizeable speedups on newer microarchitectures.
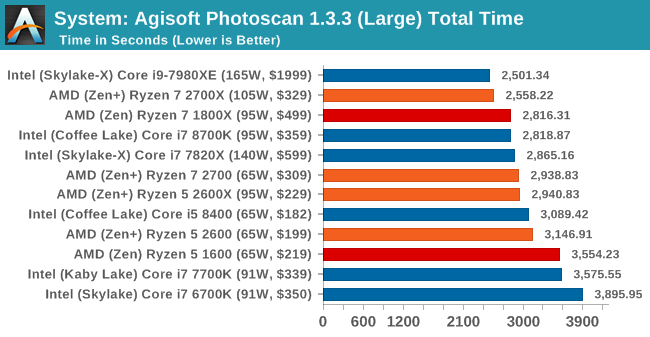
Photoscan is a variable threaded test, and time improvement from the 1800X to the 2700X shows the extra TDP and Precision Boost 2 can literally shave minutes from a test. Intel's slower mesh architecture of Skylake-X on the 8-core 7820X compared to the ring architecture of the Coffee Lake 8700K means that the two fewer cores on the 8700K allows them to draw level, but they are still four minutes or so behind the Ryzen 7 2700X. The big 18-core Intel CPU, the i9-7980XE, is needed to win here.
Civilization6 AI Test
Our Civilization AI test uses the steam version of Civilization 6 and runs the in-game AI test to process 25 rounds of an example end-game. We run the benchmark on our GTX 1080 at 1080p Medium to ensure that rendering is not a limiting factor, and the results are given as the geometric mean of the 25 rounds in the test, to give the average time to process one round of AI.
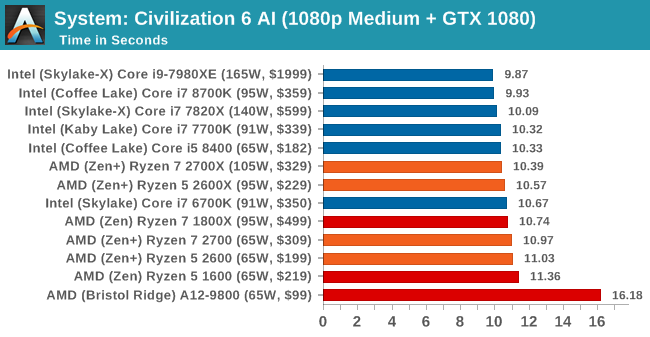
Parts of the AI test can use multiple threads, however the extra single core performance on Intel does push those parts into the lead.
CPU Rendering Tests
Rendering tests are a long-time favorite of reviewers and benchmarkers, as the code used by rendering packages is usually highly optimized to squeeze every little bit of performance out. Sometimes rendering programs end up being heavily memory dependent as well - when you have that many threads flying about with a ton of data, having low latency memory can be key to everything. Here we take a few of the usual rendering packages under Windows 10, as well as a few new interesting benchmarks.
All of our benchmark results can also be found in our benchmark engine, Bench.
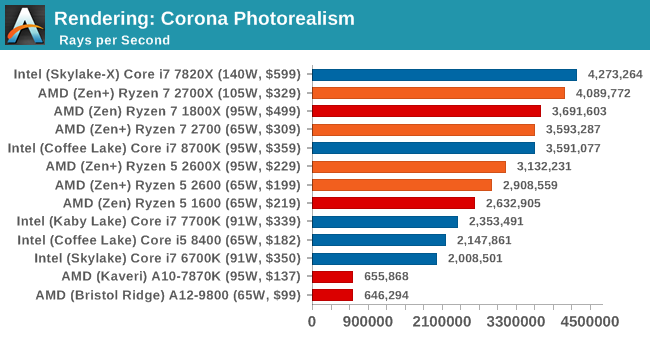
Corona 1.3: link
Corona is a standalone package designed to assist software like 3ds Max and Maya with photorealism via ray tracing. It's simple - shoot rays, get pixels. OK, it's more complicated than that, but the benchmark renders a fixed scene six times and offers results in terms of time and rays per second. The official benchmark tables list user submitted results in terms of time, however I feel rays per second is a better metric (in general, scores where higher is better seem to be easier to explain anyway). Corona likes to pile on the threads, so the results end up being very staggered based on thread count.
Blender 2.78: link
For a render that has been around for what seems like ages, Blender is still a highly popular tool. We managed to wrap up a standard workload into the February 5 nightly build of Blender and measure the time it takes to render the first frame of the scene. Being one of the bigger open source tools out there, it means both AMD and Intel work actively to help improve the codebase, for better or for worse on their own/each other's microarchitecture.
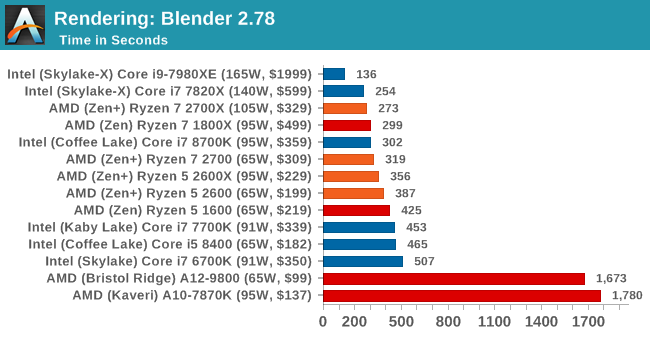
This is one multi-threaded test where the 8-core Skylake-based Intel processor wins against the new AMD Ryzen 7 2700X; the variable threaded nature of Blender means that the mesh architecture and memory bandwidth work well here. On a price/parity comparison, the Ryzen 7 2700X easily takes the win from the top performers. Users with the Core i7-6700K are being easily beaten by the Ryzen 5 2600.
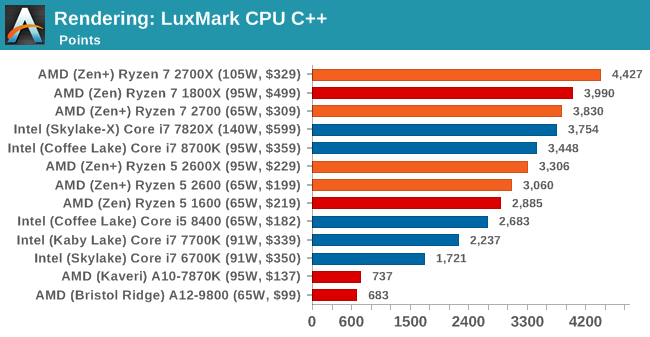
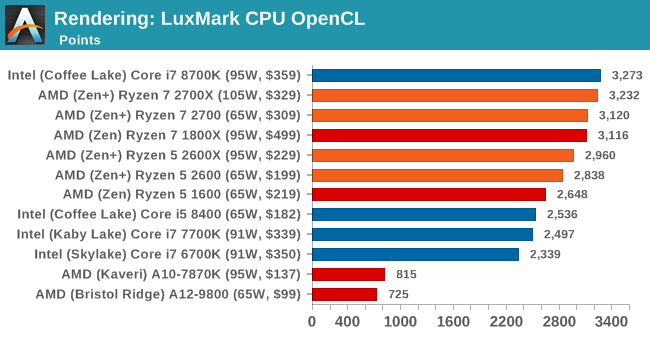
LuxMark v3.1: Link
As a synthetic, LuxMark might come across as somewhat arbitrary as a renderer, given that it's mainly used to test GPUs, but it does offer both an OpenCL and a standard C++ mode. In this instance, aside from seeing the comparison in each coding mode for cores and IPC, we also get to see the difference in performance moving from a C++ based code-stack to an OpenCL one with a CPU as the main host.
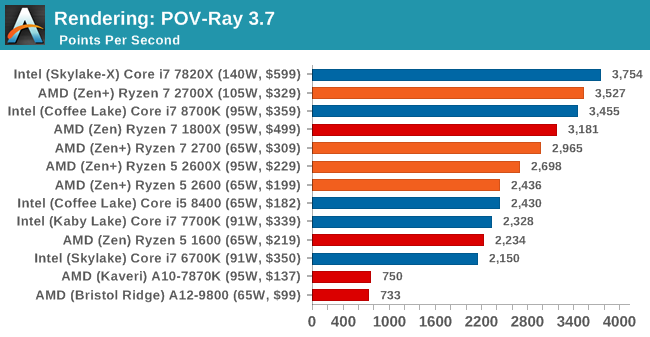
POV-Ray 3.7.1b4: link
Another regular benchmark in most suites, POV-Ray is another ray-tracer but has been around for many years. It just so happens that during the run up to AMD's Ryzen launch, the code base started to get active again with developers making changes to the code and pushing out updates. Our version and benchmarking started just before that was happening, but given time we will see where the POV-Ray code ends up and adjust in due course.
Cinebench R15: link
The latest version of CineBench has also become one of those 'used everywhere' benchmarks, particularly as an indicator of single thread performance. High IPC and high frequency gives performance in ST, whereas having good scaling and many cores is where the MT test wins out.

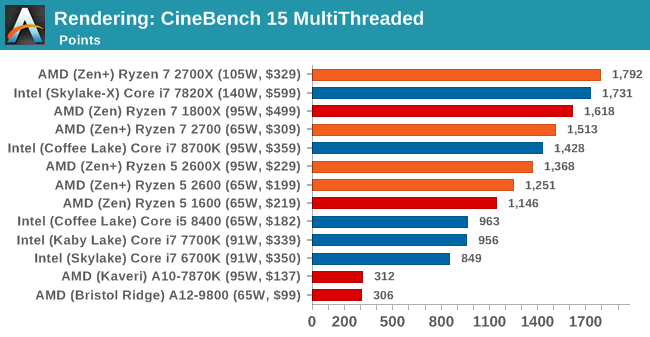
Intel is still the single thread champion in benchmarks like CineBench, but it would appear that the Ryzen 7 2700X is now taking the lead in the multithreaded test.
CPU Web Tests
One of the issues when running web-based tests is the nature of modern browsers to automatically install updates. This means any sustained period of benchmarking will invariably fall foul of the 'it's updated beyond the state of comparison' rule, especially when browsers will update if you give them half a second to think about it. Despite this, we were able to find a series of commands to create an un-updatable version of Chrome 56 for our 2017 test suite. While this means we might not be on the bleeding edge of the latest browser, it makes the scores between CPUs comparable.
All of our benchmark results can also be found in our benchmark engine, Bench.
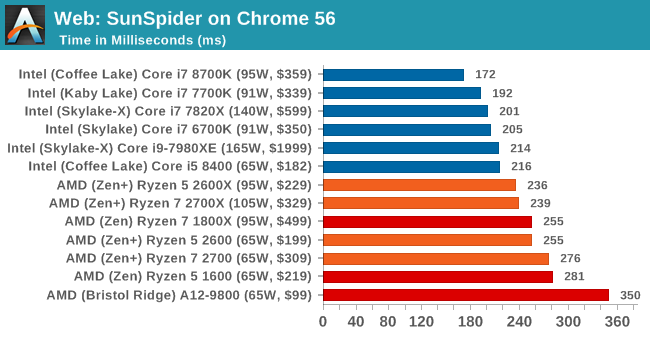
SunSpider 1.0.2: link
The oldest web-based benchmark in this portion of our test is SunSpider. This is a very basic javascript algorithm tool, and ends up being more a measure of IPC and latency than anything else, with most high-performance CPUs scoring around about the same. The basic test is looped 10 times and the average taken. We run the basic test 4 times.
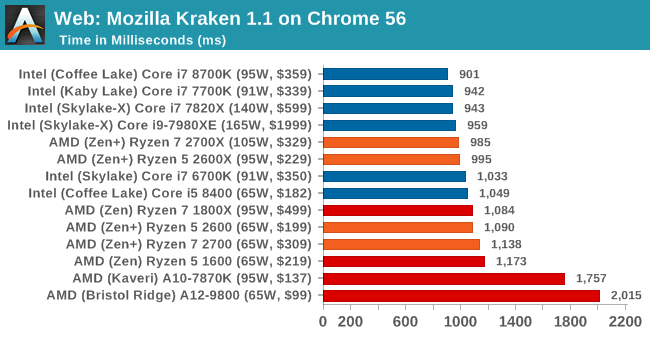
Mozilla Kraken 1.1: link
Kraken is another Javascript based benchmark, using the same test harness as SunSpider, but focusing on more stringent real-world use cases and libraries, such as audio processing and image filters. Again, the basic test is looped ten times, and we run the basic test four times.
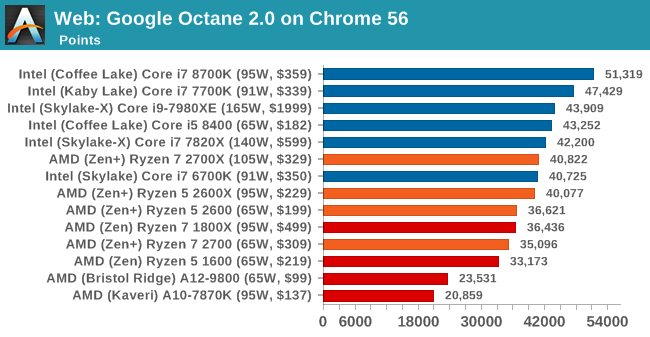
Google Octane 2.0: link
Along with Mozilla, as Google is a major browser developer, having peak JS performance is typically a critical asset when comparing against the other OS developers. In the same way that SunSpider is a very early JS benchmark, and Kraken is a bit newer, Octane aims to be more relevant to real workloads, especially in power constrained devices such as smartphones and tablets.
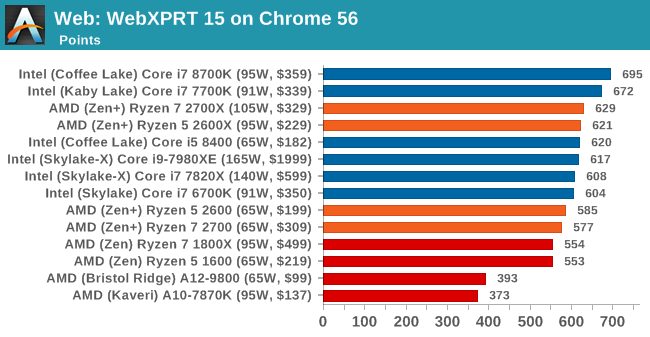
WebXPRT 2015: link
While the previous three benchmarks do calculations in the background and represent a score, WebXPRT is designed to be a better interpretation of visual workloads that a professional user might have, such as browser based applications, graphing, image editing, sort/analysis, scientific analysis and financial tools.
CPU Encoding Tests
One of the interesting elements on modern processors is encoding performance. This includes encryption/decryption, as well as video transcoding from one video format to another. In the encrypt/decrypt scenario, this remains pertinent to on-the-fly encryption of sensitive data - a process by which more modern devices are leaning to for software security. Video transcoding as a tool to adjust the quality, file size and resolution of a video file has boomed in recent years, such as providing the optimum video for devices before consumption, or for game streamers who are wanting to upload the output from their video camera in real-time. As we move into live 3D video, this task will only get more strenuous, and it turns out that the performance of certain algorithms is a function of the input/output of the content.
All of our benchmark results can also be found in our benchmark engine, Bench.
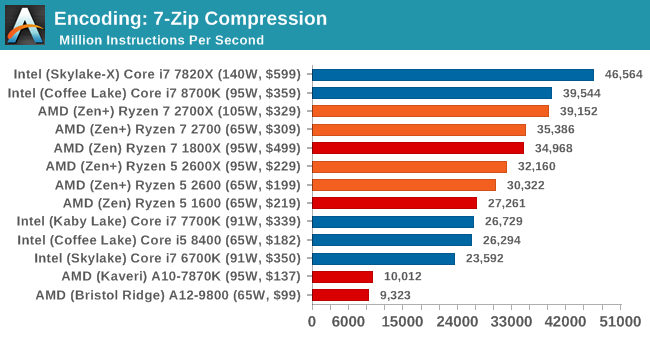
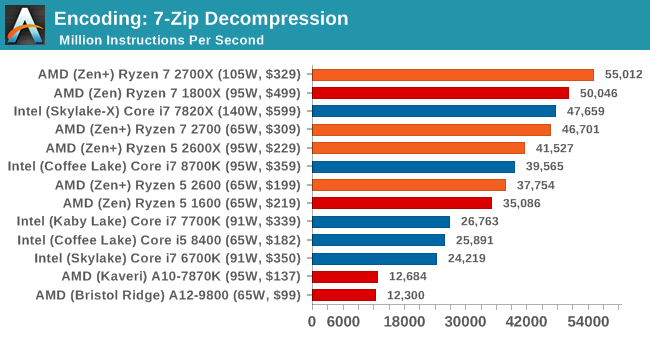
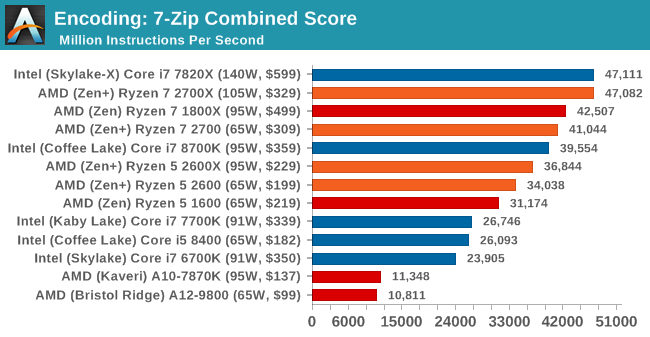
7-Zip 9.2: link
One of the freeware compression tools that offers good scaling performance between processors is 7-Zip. It runs under an open-source licence, is fast, and easy to use tool for power users. We run the benchmark mode via the command line for four loops and take the output score.
WinRAR 5.40: link
For the 2017 test suite, we move to the latest version of WinRAR in our compression test. WinRAR in some quarters is more user friendly that 7-Zip, hence its inclusion. Rather than use a benchmark mode as we did with 7-Zip, here we take a set of files representative of a generic stack (33 video files in 1.37 GB, 2834 smaller website files in 370 folders in 150 MB) of compressible and incompressible formats. The results shown are the time taken to encode the file. Due to DRAM caching, we run the test 10 times and take the average of the last five runs when the benchmark is in a steady state.
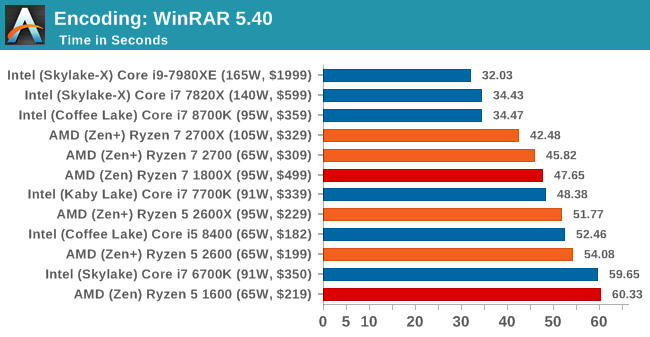
WinRAR requires a good memory base, so we see the quad-channel processors heading up the pack. The high IPC of the Core i7-8700K also does well.
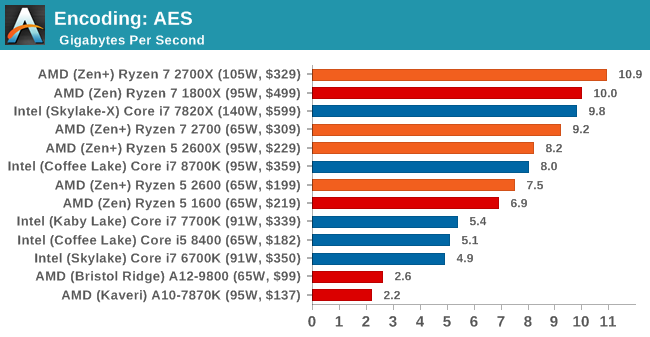
AES Encoding
Algorithms using AES coding have spread far and wide as a ubiquitous tool for encryption. Again, this is another CPU limited test, and modern CPUs have special AES pathways to accelerate their performance. We often see scaling in both frequency and cores with this benchmark. We use the latest version of TrueCrypt and run its benchmark mode over 1GB of in-DRAM data. Results shown are the GB/s average of encryption and decryption.
HandBrake v1.0.2 H264 and HEVC: link
As mentioned above, video transcoding (both encode and decode) is a hot topic in performance metrics as more and more content is being created. First consideration is the standard in which the video is encoded, which can be lossless or lossy, trade performance for file-size, trade quality for file-size, or all of the above can increase encoding rates to help accelerate decoding rates. Alongside Google's favorite codec, VP9, there are two others that are taking hold: H264, the older codec, is practically everywhere and is designed to be optimized for 1080p video, and HEVC (or H265) that is aimed to provide the same quality as H264 but at a lower file-size (or better quality for the same size). HEVC is important as 4K is streamed over the air, meaning less bits need to be transferred for the same quality content.
Handbrake is a favored tool for transcoding, and so our test regime takes care of three areas.
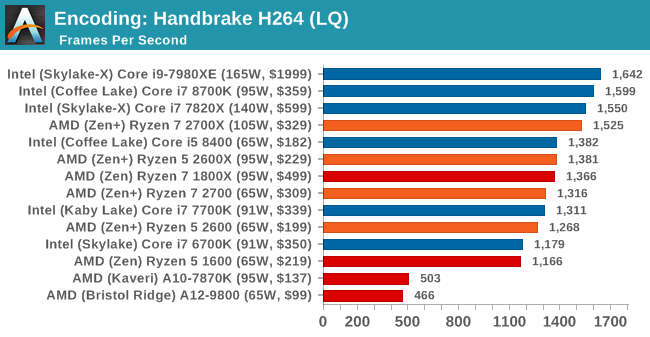
Low Quality/Resolution H264: Here we transcode a 640x266 H264 rip of a 2 hour film, and change the encoding from Main profile to High profile, using the very-fast preset.
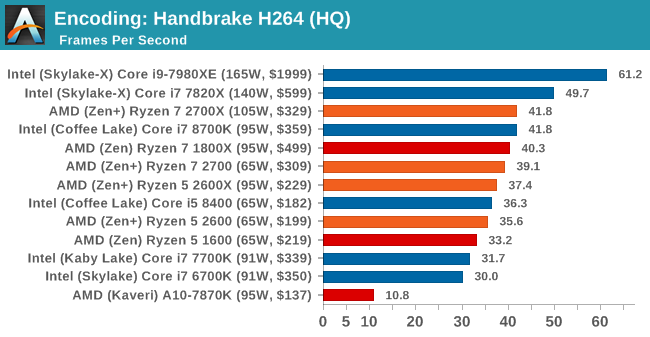
High Quality/Resolution H264: A similar test, but this time we take a ten-minute double 4K (3840x4320) file running at 60 Hz and transcode from Main to High, using the very-fast preset.
HEVC Test: Using the same video in HQ, we change the resolution and codec of the original video from 4K60 in H264 into 4K60 HEVC.
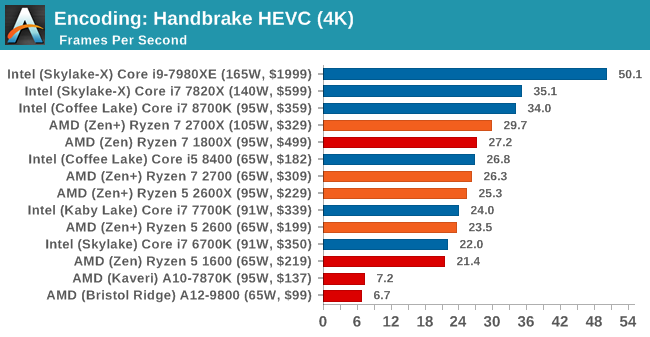
For HandBrake video encoding of large frames, there is a bump with the new Ryzen-2000 series processors over the previous generation, however there is still a gap up to the Core i7-8700K. The Core i5-8400 puts in a good showing here, above all but the best Ryzen parts.
CPU Office Tests
The office programs we use for benchmarking aren't specific programs per-se, but industry standard tests that hold weight with professionals. The goal of these tests is to use an array of software and techniques that a typical office user might encounter, such as video conferencing, document editing, architectural modelling, and so on and so forth.
All of our benchmark results can also be found in our benchmark engine, Bench.
Chromium Compile (v56)
Our new compilation test uses Windows 10 Pro, VS Community 2015.3 with the Win10 SDK to combile a nightly build of Chromium. We've fixed the test for a build in late March 2017, and we run a fresh full compile in our test. Compilation is the typical example given of a variable threaded workload - some of the compile and linking is linear, whereas other parts are multithreaded.
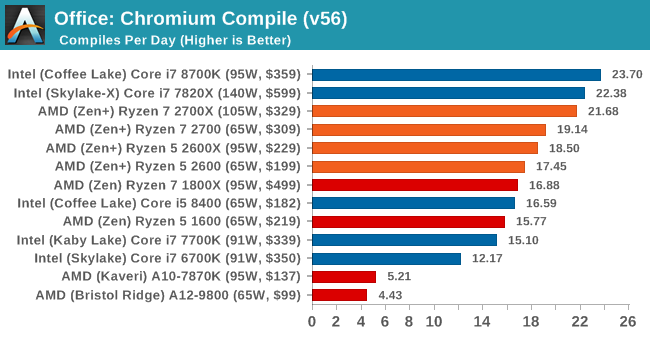
Having redone our compile testing, we can see that the new Ryzen-2000 series parts do provide a good uplift over the first generation, likely due to the decreased cache latencies and better precision boost. Performance per dollar between the 8700K and the 2700X would seem to be about equal as well.
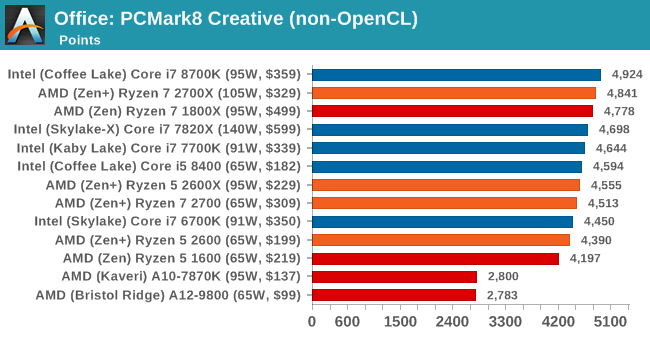
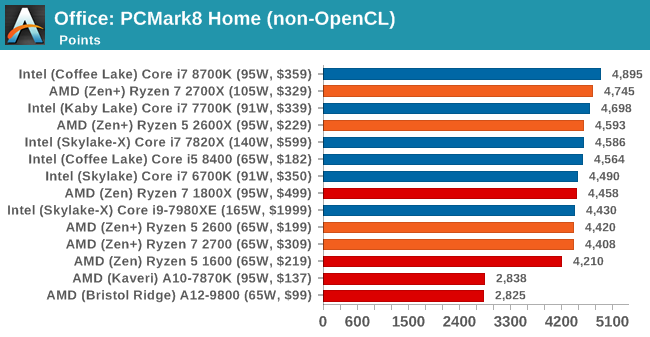
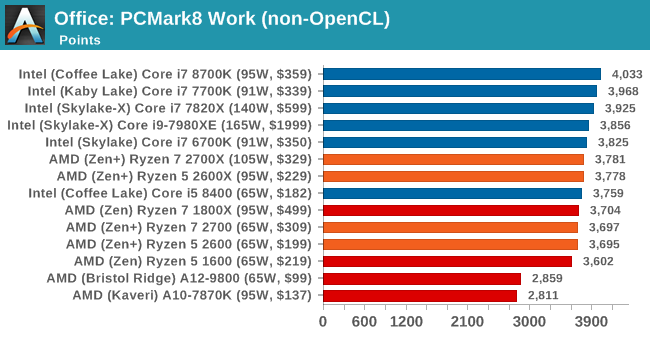
PCMark8: link
Despite originally coming out in 2008/2009, Futuremark has maintained PCMark8 to remain relevant in 2017. On the scale of complicated tasks, PCMark focuses more on the low-to-mid range of professional workloads, making it a good indicator for what people consider 'office' work. We run the benchmark from the commandline in 'conventional' mode, meaning C++ over OpenCL, to remove the graphics card from the equation and focus purely on the CPU. PCMark8 offers Home, Work and Creative workloads, with some software tests shared and others unique to each benchmark set.
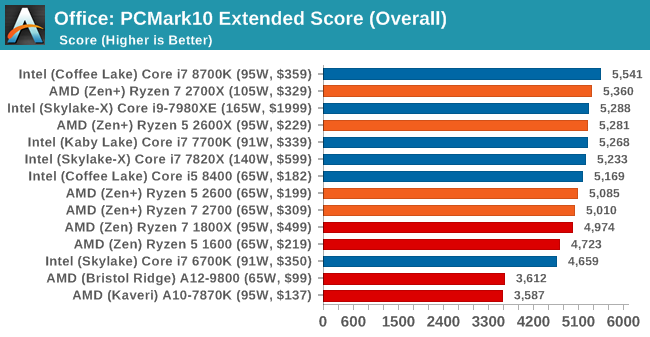
PCMark 10
GeekBench4
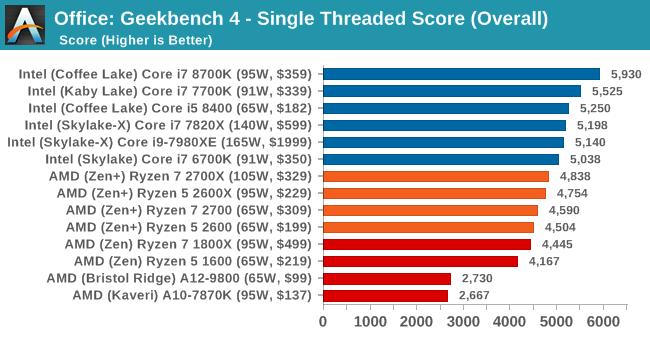
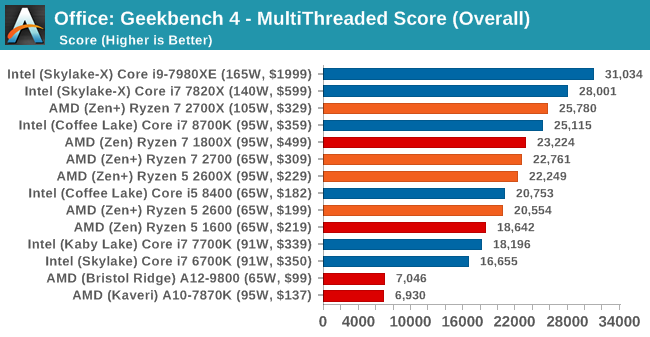
If you live and breathe GeekBench 4, then the single threaded results put Intel firmly in first place. For the multi-threaded tests, the top Intel and AMD mainstream parts are going at it almost neck-and-neck, however it is clear that the previous generation quad-cores are falling behind.
CPU Legacy Tests
Our legacy tests represent benchmarks that were once at the height of their time. Some of these are industry standard synthetics, and we have data going back over 10 years. All of the data here has been rerun on Windows 10, and we plan to go back several generations of components to see how performance has evolved.
All of our benchmark results can also be found in our benchmark engine, Bench.
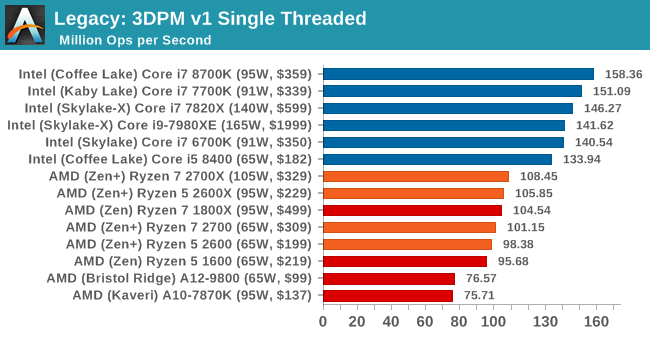
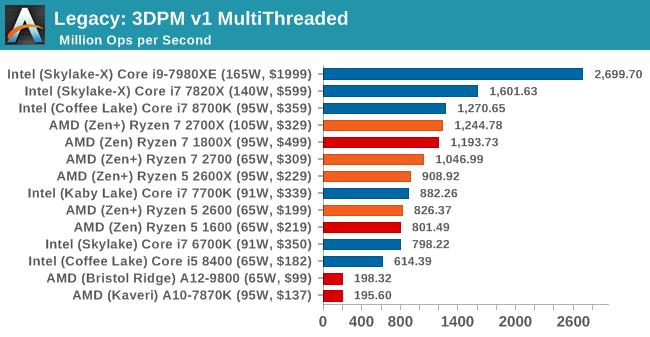
3D Particle Movement v1
3DPM is a self-penned benchmark, taking basic 3D movement algorithms used in Brownian Motion simulations and testing them for speed. High floating point performance, MHz and IPC wins in the single thread version, whereas the multithread version has to handle the threads and loves more cores. This is the original version, written in the style of a typical non-computer science student coding up an algorithm for their theoretical problem, and comes without any non-obvious optimizations not already performed by the compiler, such as false sharing.
CineBench 11.5 and 10
Cinebench is a widely known benchmarking tool for measuring performance relative to MAXON's animation software Cinema 4D. Cinebench has been optimized over a decade and focuses on purely CPU horsepower, meaning if there is a discrepancy in pure throughput characteristics, Cinebench is likely to show that discrepancy. Arguably other software doesn't make use of all the tools available, so the real world relevance might purely be academic, but given our large database of data for Cinebench it seems difficult to ignore a small five minute test. We run the modern version 15 in this test, as well as the older 11.5 and 10 due to our back data.
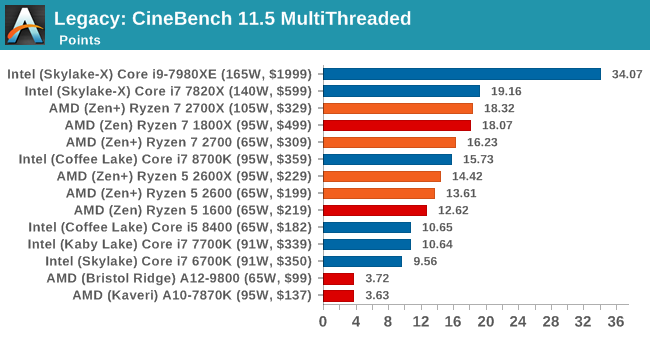
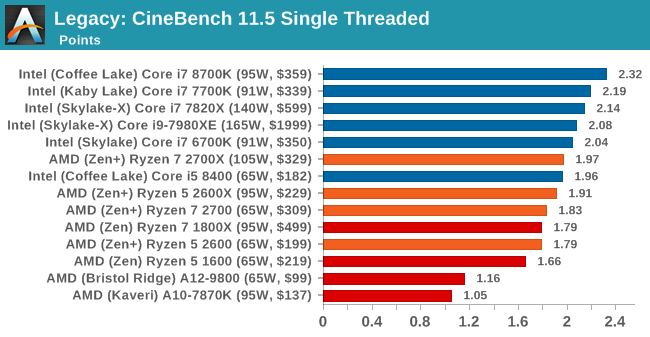
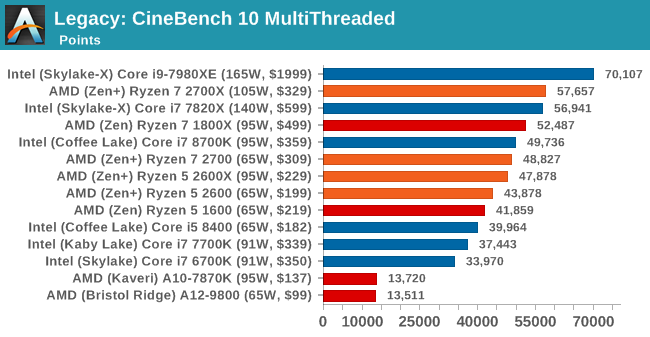
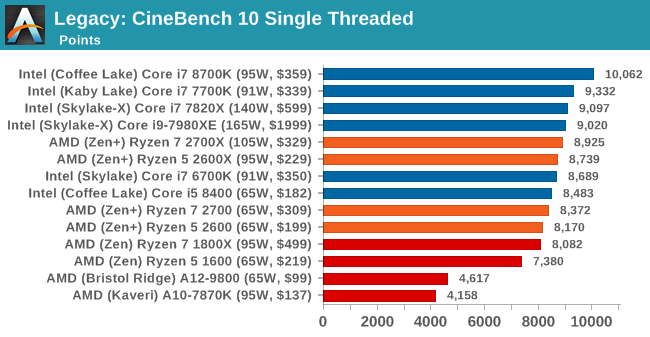
x264 HD 3.0
Similarly, the x264 HD 3.0 package we use here is also kept for historic regressional data. The latest version is 5.0.1, and encodes a 1080p video clip into a high quality x264 file. Version 3.0 only performs the same test on a 720p file, and in most circumstances the software performance hits its limit on high end processors, but still works well for mainstream and low-end. Also, this version only takes a few minutes, whereas the latest can take over 90 minutes to run.
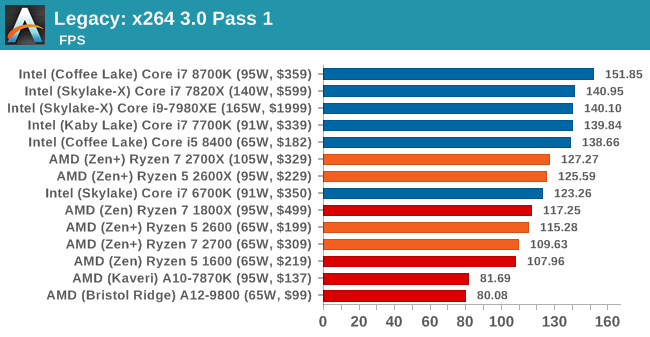
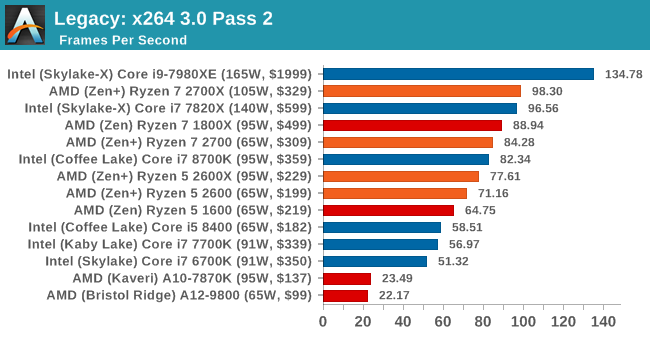
Civilization 6
First up in our CPU gaming tests is Civilization 6. Originally penned by Sid Meier and his team, the Civ series of turn-based strategy games are a cult classic, and many an excuse for an all-nighter trying to get Gandhi to declare war on you due to an integer overflow. Truth be told I never actually played the first version, but every edition from the second to the sixth, including the fourth as voiced by the late Leonard Nimoy, it a game that is easy to pick up, but hard to master.

Benchmarking Civilization has always been somewhat of an oxymoron – for a turn based strategy game, the frame rate is not necessarily the important thing here and even in the right mood, something as low as 5 frames per second can be enough. With Civilization 6 however, Firaxis went hardcore on visual fidelity, trying to pull you into the game. As a result, Civilization can taxing on graphics and CPUs as we crank up the details, especially in DirectX 12.
Perhaps a more poignant benchmark would be during the late game, when in the older versions of Civilization it could take 20 minutes to cycle around the AI players before the human regained control. The new version of Civilization has an integrated ‘AI Benchmark’, although it is not currently part of our benchmark portfolio yet, due to technical reasons which we are trying to solve. Instead, we run the graphics test, which provides an example of a mid-game setup at our settings.
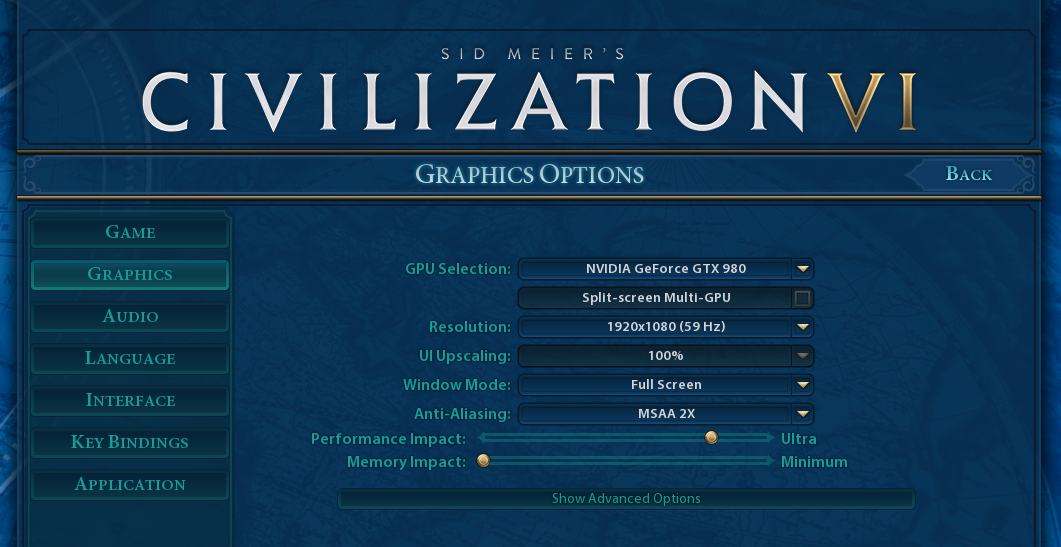
At both 1920x1080 and 4K resolutions, we run the same settings. Civilization 6 has sliders for MSAA, Performance Impact and Memory Impact. The latter two refer to detail and texture size respectively, and are rated between 0 (lowest) to 5 (extreme). We run our Civ6 benchmark in position four for performance (ultra) and 0 on memory, with MSAA set to 2x.
For reviews where we include 8K and 16K benchmarks (Civ6 allows us to benchmark extreme resolutions on any monitor) on our GTX 1080, we run the 8K tests similar to the 4K tests, but the 16K tests are set to the lowest option for Performance.
All of our benchmark results can also be found in our benchmark engine, Bench.
MSI GTX 1080 Gaming 8G Performance
1080p
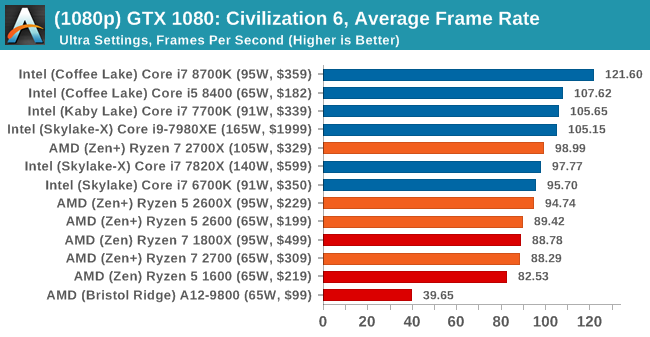


4K


8K


16K


Shadow of Mordor
The next title in our testing is a battle of system performance with the open world action-adventure title, Middle Earth: Shadow of Mordor (SoM for short). Produced by Monolith and using the LithTech Jupiter EX engine and numerous detail add-ons, SoM goes for detail and complexity. The main story itself was written by the same writer as Red Dead Redemption, and it received Zero Punctuation’s Game of The Year in 2014.

A 2014 game is fairly old to be testing now, however SoM has a stable code and player base, and can still stress a PC down to the ones and zeroes. At the time, SoM was unique, offering a dynamic screen resolution setting allowing users to render at high resolutions that are then scaled down to the monitor. This form of natural oversampling was designed to let the user experience a truer vision of what the developers wanted, assuming you had the graphics hardware to power it but had a sub-4K monitor.
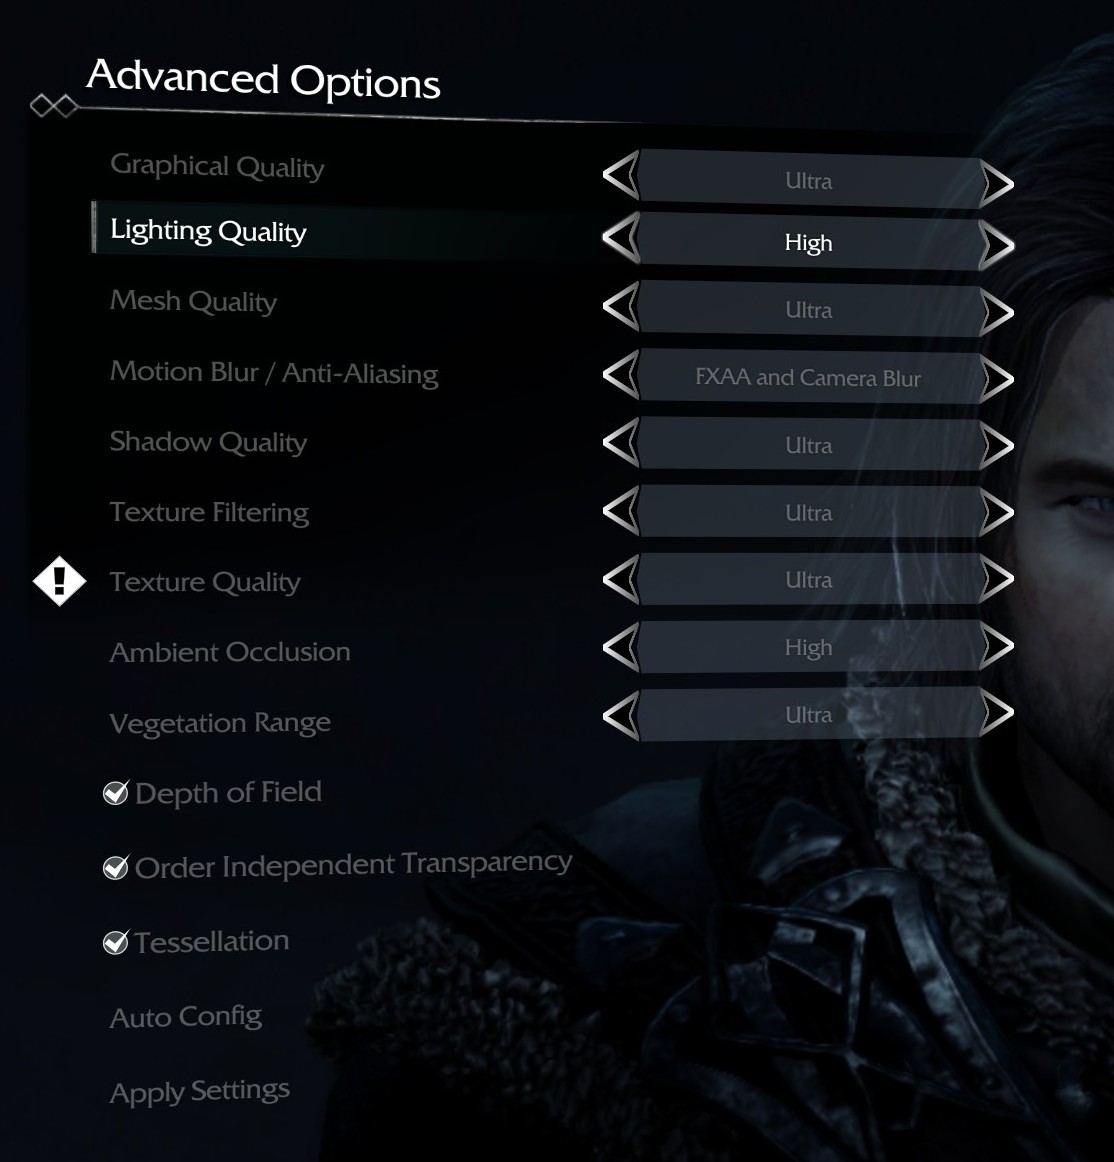
The title has an in-game benchmark, for which we run with an automated script implement the graphics settings, select the benchmark, and parse the frame-time output which is dumped on the drive. The graphics settings include standard options such as Graphical Quality, Lighting, Mesh, Motion Blur, Shadow Quality, Textures, Vegetation Range, Depth of Field, Transparency and Tessellation. There are standard presets as well.
We run the benchmark at 1080p and a native 4K, using our 4K monitors, at the Ultra preset. Results are averaged across four runs and we report the average frame rate, 99th percentile frame rate, and time under analysis.
All of our benchmark results can also be found in our benchmark engine, Bench.
MSI GTX 1080 Gaming 8G Performance
1080p

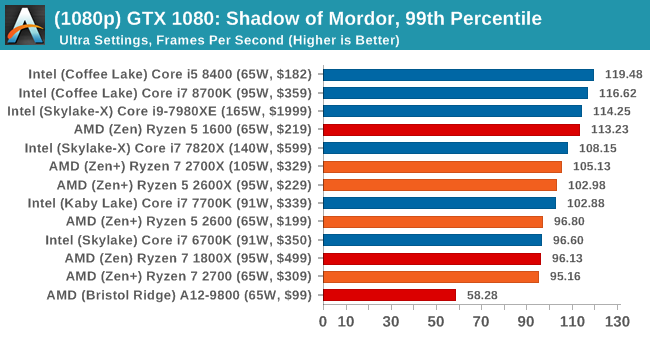

4K
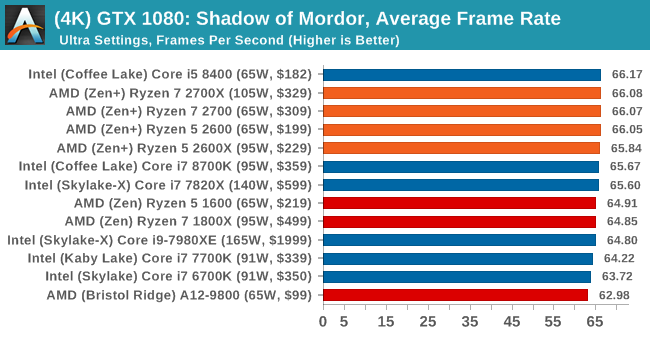
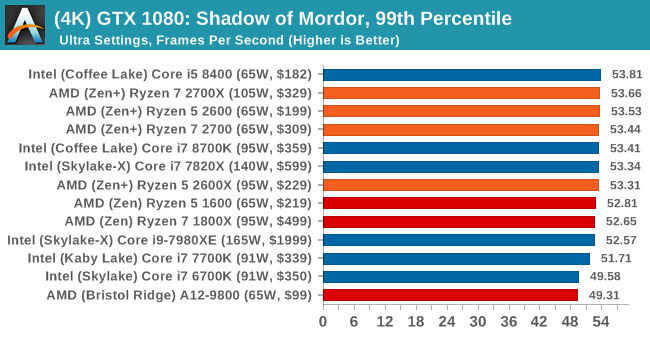
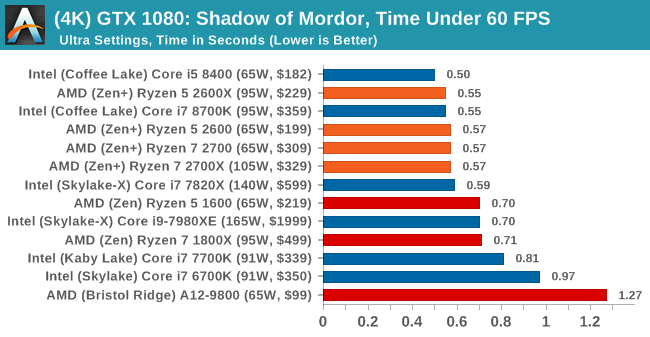

Rise of the Tomb Raider
One of the newest games in the gaming benchmark suite is Rise of the Tomb Raider (RoTR), developed by Crystal Dynamics, and the sequel to the popular Tomb Raider which was loved for its automated benchmark mode. But don’t let that fool you: the benchmark mode in RoTR is very much different this time around.
Visually, the previous Tomb Raider pushed realism to the limits with features such as TressFX, and the new RoTR goes one stage further when it comes to graphics fidelity. This leads to an interesting set of requirements in hardware: some sections of the game are typically GPU limited, whereas others with a lot of long-range physics can be CPU limited, depending on how the driver can translate the DirectX 12 workload.

Where the old game had one benchmark scene, the new game has three different scenes with different requirements: Geothermal Valley (1-Valley), Prophet’s Tomb (2-Prophet) and Spine of the Mountain (3-Mountain) - and we test all three. These are three scenes designed to be taken from the game, but it has been noted that scenes like 2-Prophet shown in the benchmark can be the most CPU limited elements of that entire level, and the scene shown is only a small portion of that level. Because of this, we report the results for each scene on each graphics card separately.
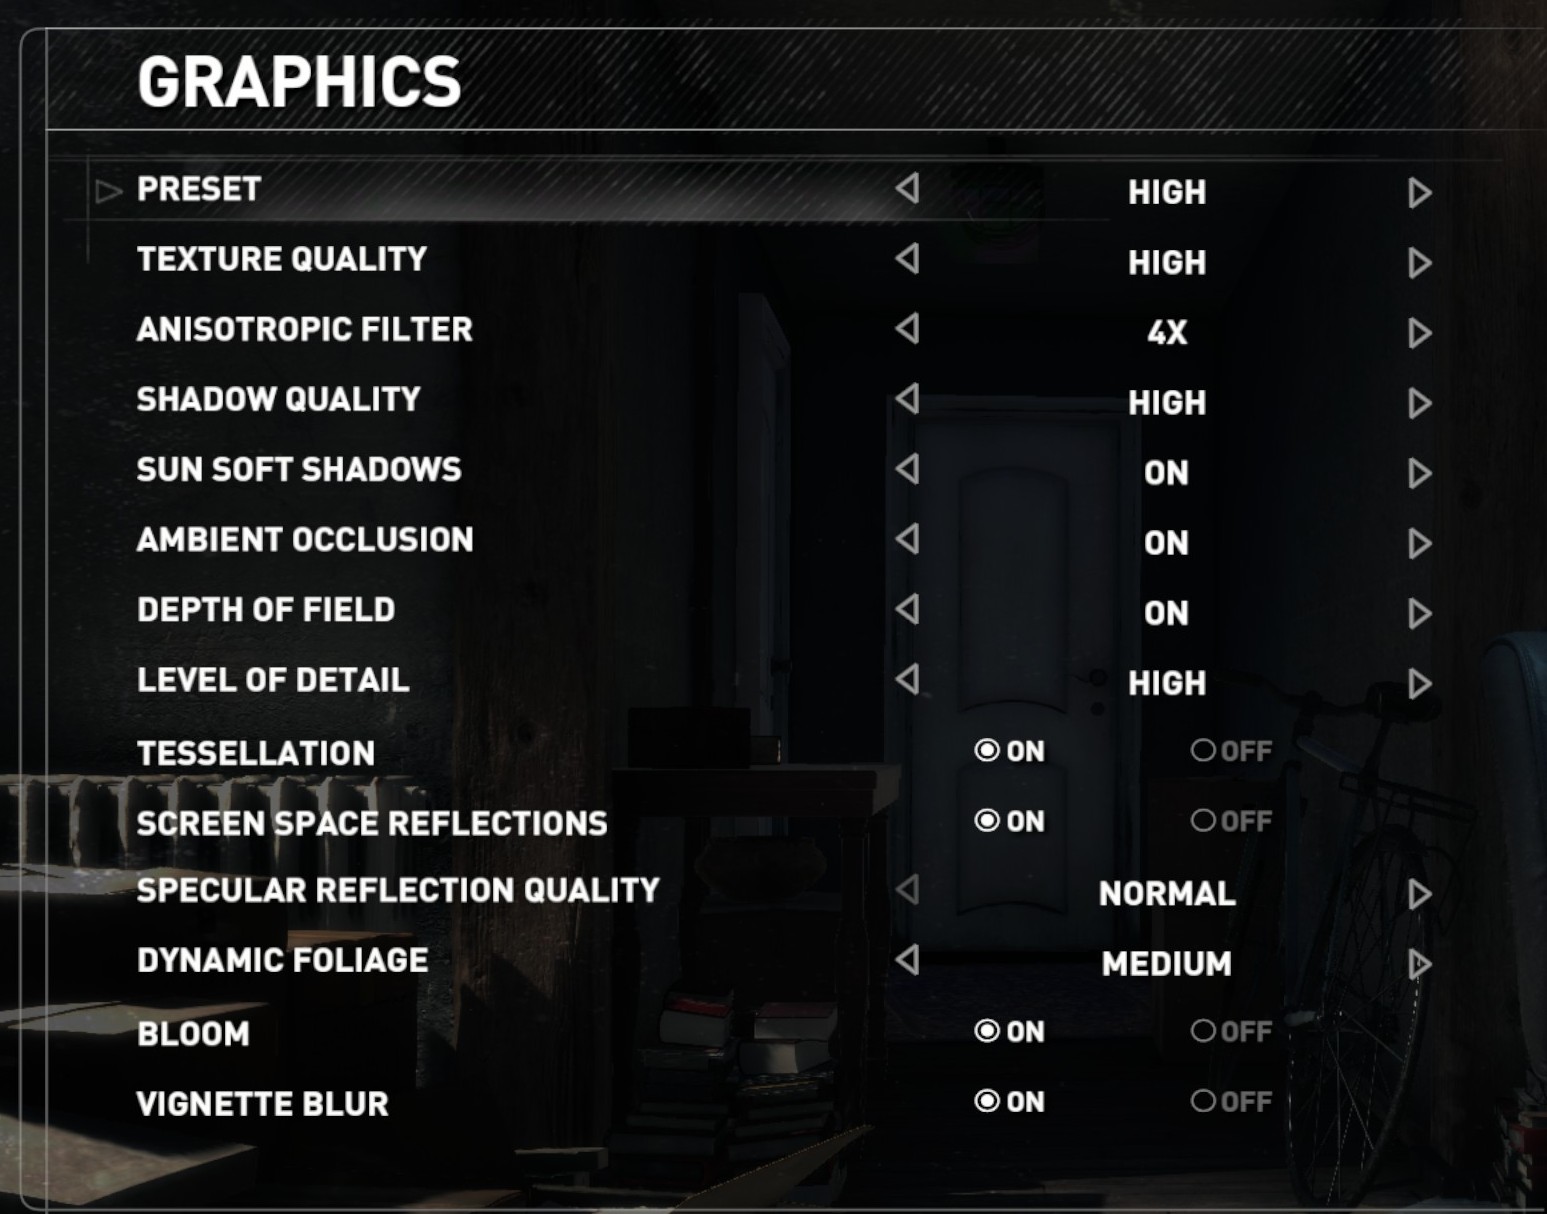
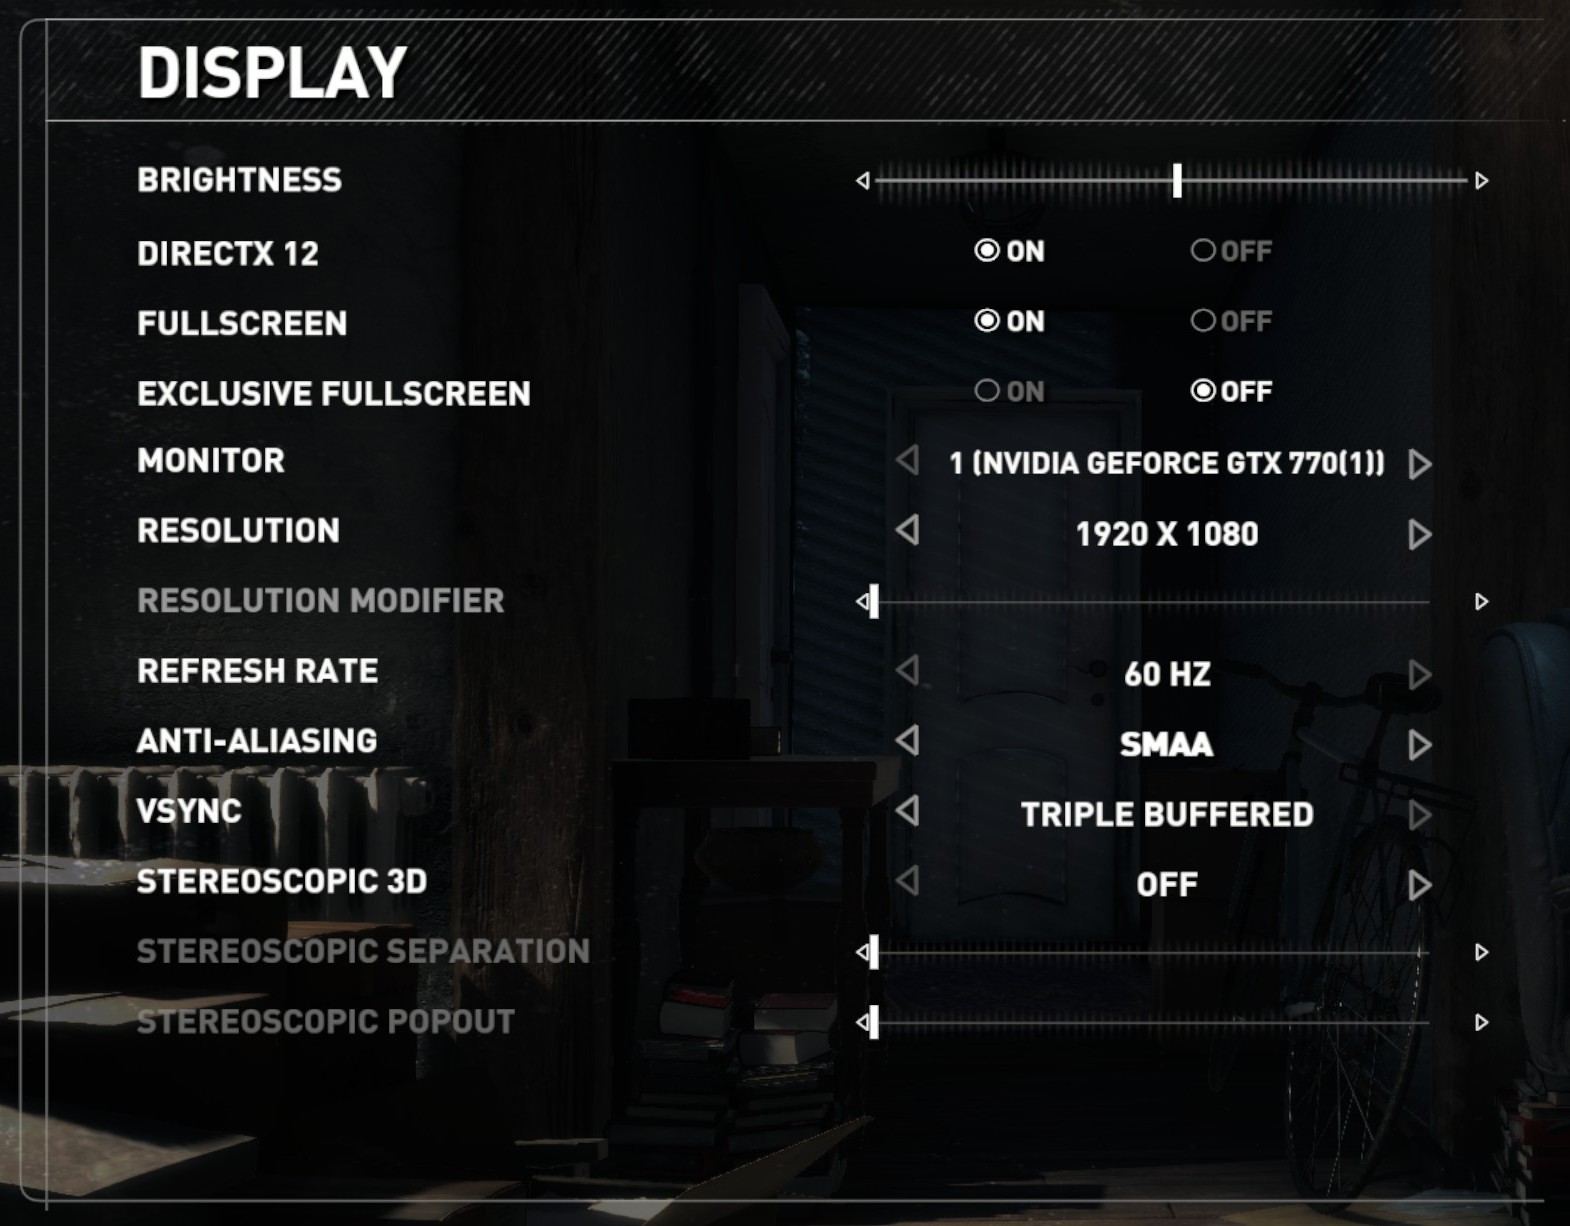
Graphics options for RoTR are similar to other games in this type, offering some presets or allowing the user to configure texture quality, anisotropic filter levels, shadow quality, soft shadows, occlusion, depth of field, tessellation, reflections, foliage, bloom, and features like PureHair which updates on TressFX in the previous game.
Again, we test at 1920x1080 and 4K using our native 4K displays. At 1080p we run the High preset, while at 4K we use the Medium preset which still takes a sizable hit in frame rate.
It is worth noting that RoTR is a little different to our other benchmarks in that it keeps its graphics settings in the registry rather than a standard ini file, and unlike the previous TR game the benchmark cannot be called from the command-line. Nonetheless we scripted around these issues to automate the benchmark four times and parse the results. From the frame time data, we report the averages, 99th percentiles, and our time under analysis.
All of our benchmark results can also be found in our benchmark engine, Bench.
1080p
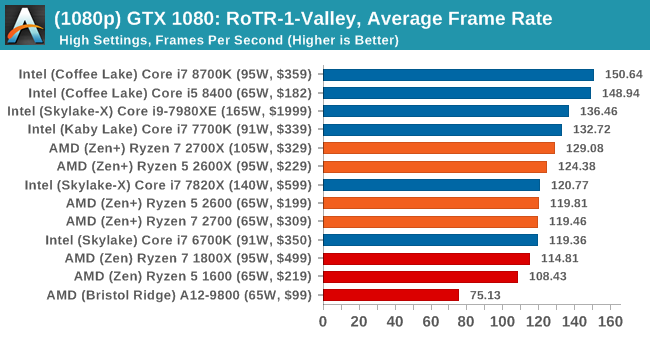
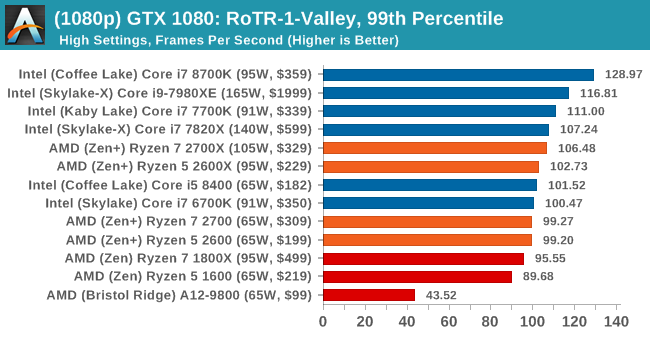

4K


Rocket League
Hilariously simple pick-up-and-play games are great fun. I'm a massive fan of the Katamari franchise for that reason — passing start on a controller and rolling around, picking up things to get bigger, is extremely simple. Until we get a PC version of Katamari that I can benchmark, we'll focus on Rocket League.
Rocket League combines the elements of pick-up-and-play, allowing users to jump into a game with other people (or bots) to play football with cars with zero rules. The title is built on Unreal Engine 3, which is somewhat old at this point, but it allows users to run the game on super-low-end systems while still taxing the big ones. Since the release in 2015, it has sold over 5 million copies and seems to be a fixture at LANs and game shows. Users who train get very serious, playing in teams and leagues with very few settings to configure, and everyone is on the same level. Rocket League is quickly becoming one of the favored titles for e-sports tournaments, especially when e-sports contests can be viewed directly from the game interface.

Based on these factors, plus the fact that it is an extremely fun title to load and play, we set out to find the best way to benchmark it. Unfortunately for the most part automatic benchmark modes for games are few and far between. Partly because of this, but also on the basis that it is built on the Unreal 3 engine, Rocket League does not have a benchmark mode. In this case, we have to develop a consistent run and record the frame rate.
Read our initial analysis on our Rocket League benchmark on low-end graphics here.
With Rocket League, there is no benchmark mode, so we have to perform a series of automated actions, similar to a racing game having a fixed number of laps. We take the following approach: Using Fraps to record the time taken to show each frame (and the overall frame rates), we use an automation tool to set up a consistent no-bot match on easy, with the system applying a series of inputs throughout the run, such as switching camera angles and driving around.
It turns out that this method is nicely indicative of a real match, driving up walls, boosting and even putting in the odd assist, save and/or goal, as weird as that sounds for an automated set of commands. To maintain consistency, the commands we apply are not random but time-fixed, and we also keep the map the same (Aquadome, known to be a tough map for GPUs due to water/transparency) and the car customization constant. We start recording just after a match starts, and record for 4 minutes of game time (think 5 laps of a DIRT: Rally benchmark), with average frame rates, 99th percentile and frame times all provided.
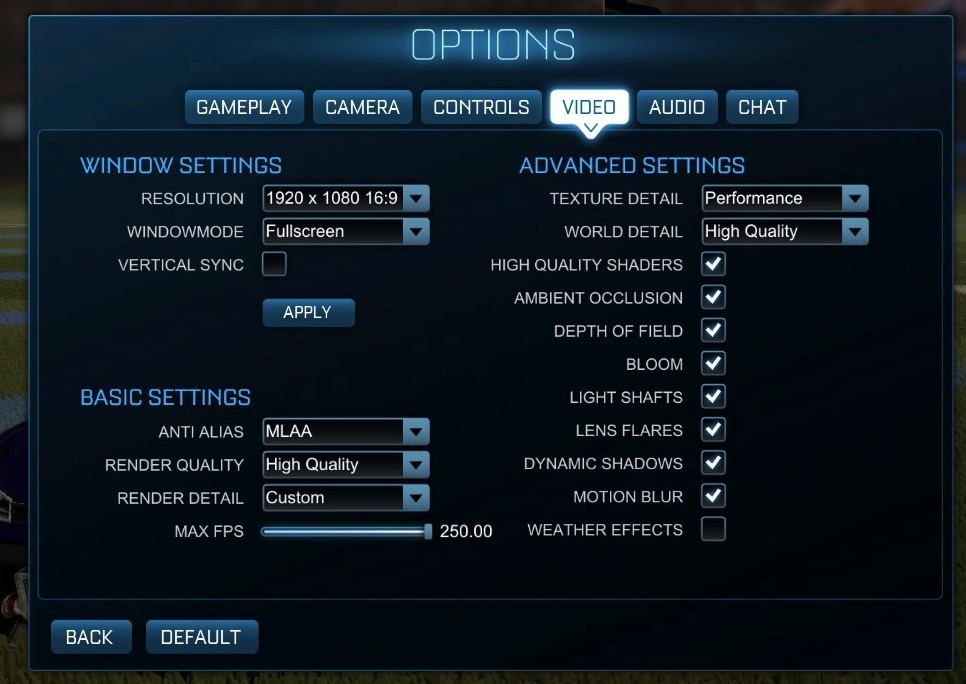
The graphics settings for Rocket League come in four broad, generic settings: Low, Medium, High and High FXAA. There are advanced settings in place for shadows and details; however, for these tests, we keep to the generic settings. For both 1920x1080 and 4K resolutions, we test at the High preset with an unlimited frame cap.
All of our benchmark results can also be found in our benchmark engine, Bench.
MSI GTX 1080 Gaming 8G Performance
1080p


4K


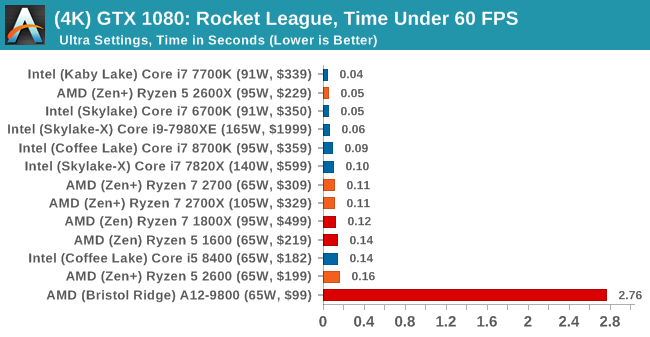

Grand Theft Auto
The highly anticipated iteration of the Grand Theft Auto franchise hit the shelves on April 14th 2015, with both AMD and NVIDIA in tow to help optimize the title. GTA doesn’t provide graphical presets, but opens up the options to users and extends the boundaries by pushing even the hardest systems to the limit using Rockstar’s Advanced Game Engine under DirectX 11. Whether the user is flying high in the mountains with long draw distances or dealing with assorted trash in the city, when cranked up to maximum it creates stunning visuals but hard work for both the CPU and the GPU.
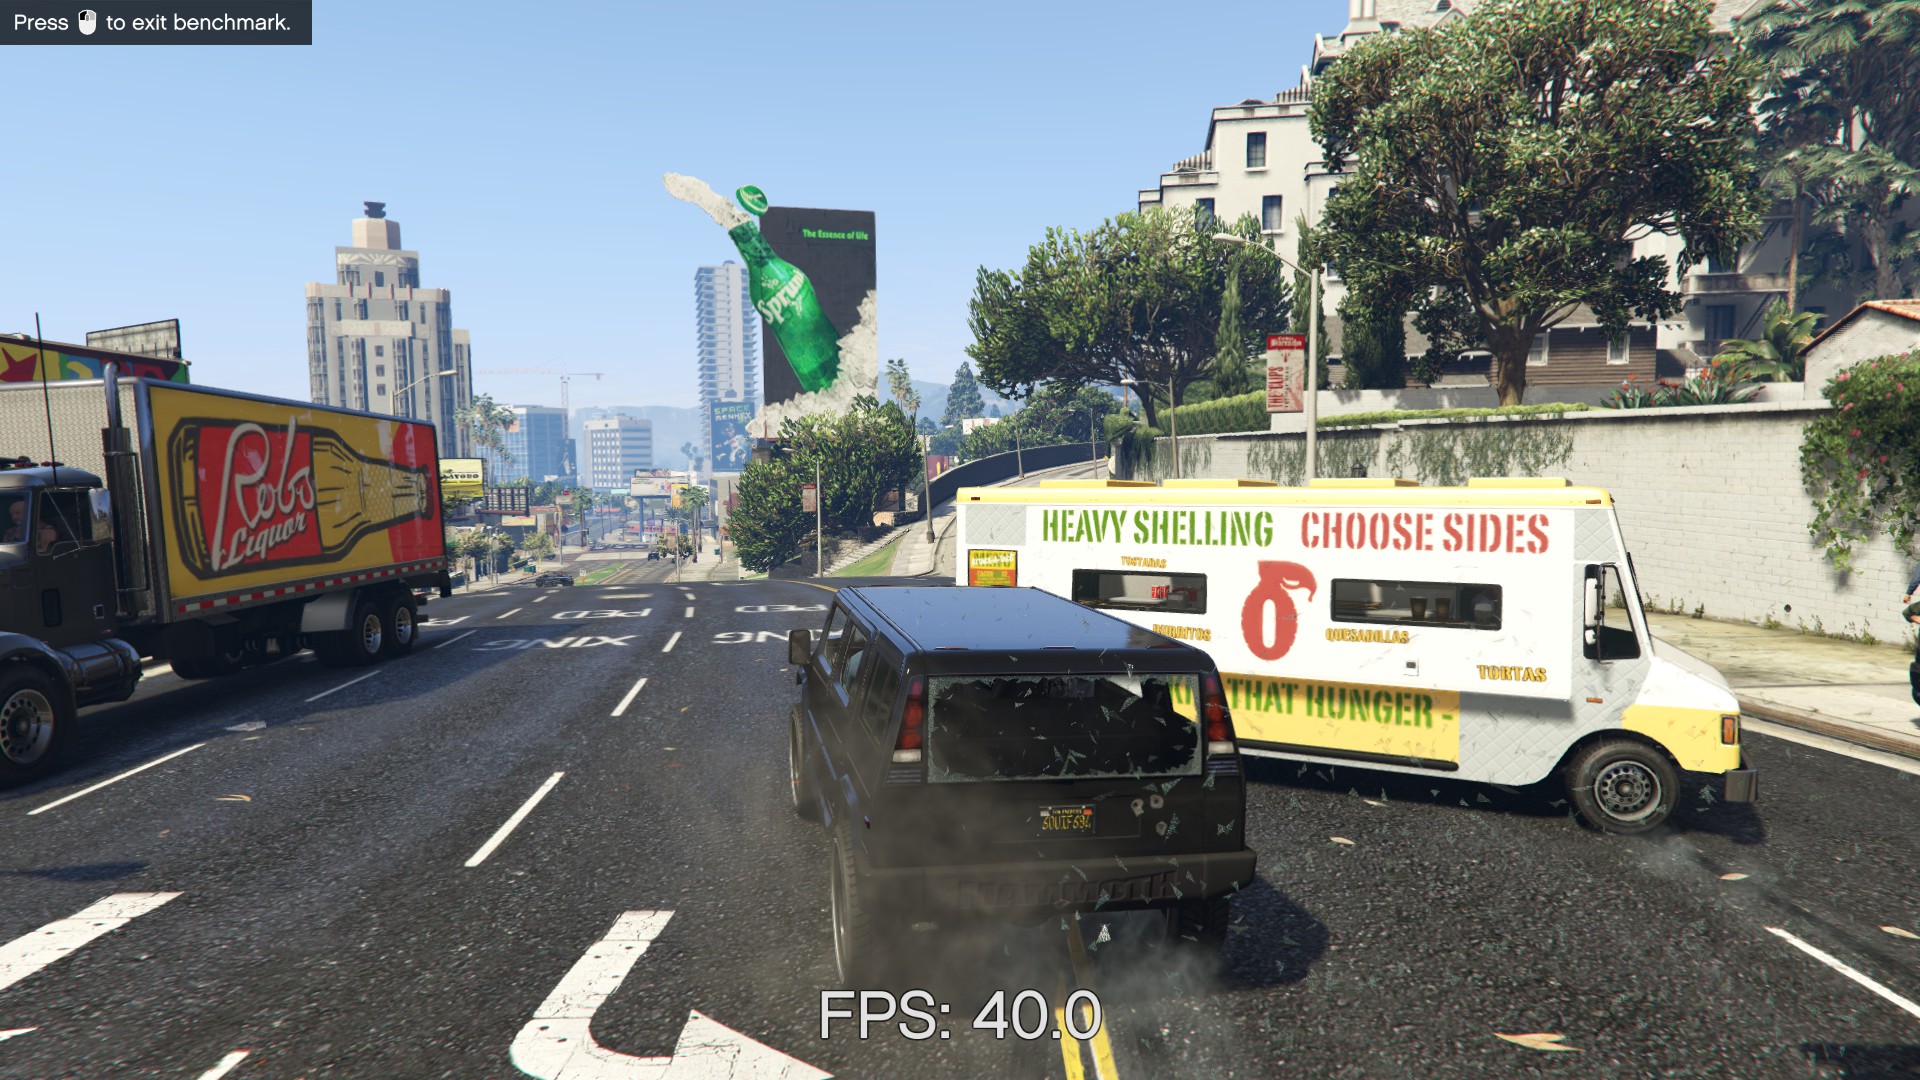
For our test we have scripted a version of the in-game benchmark. The in-game benchmark consists of five scenarios: four short panning shots with varying lighting and weather effects, and a fifth action sequence that lasts around 90 seconds. We use only the final part of the benchmark, which combines a flight scene in a jet followed by an inner city drive-by through several intersections followed by ramming a tanker that explodes, causing other cars to explode as well. This is a mix of distance rendering followed by a detailed near-rendering action sequence, and the title thankfully spits out frame time data.
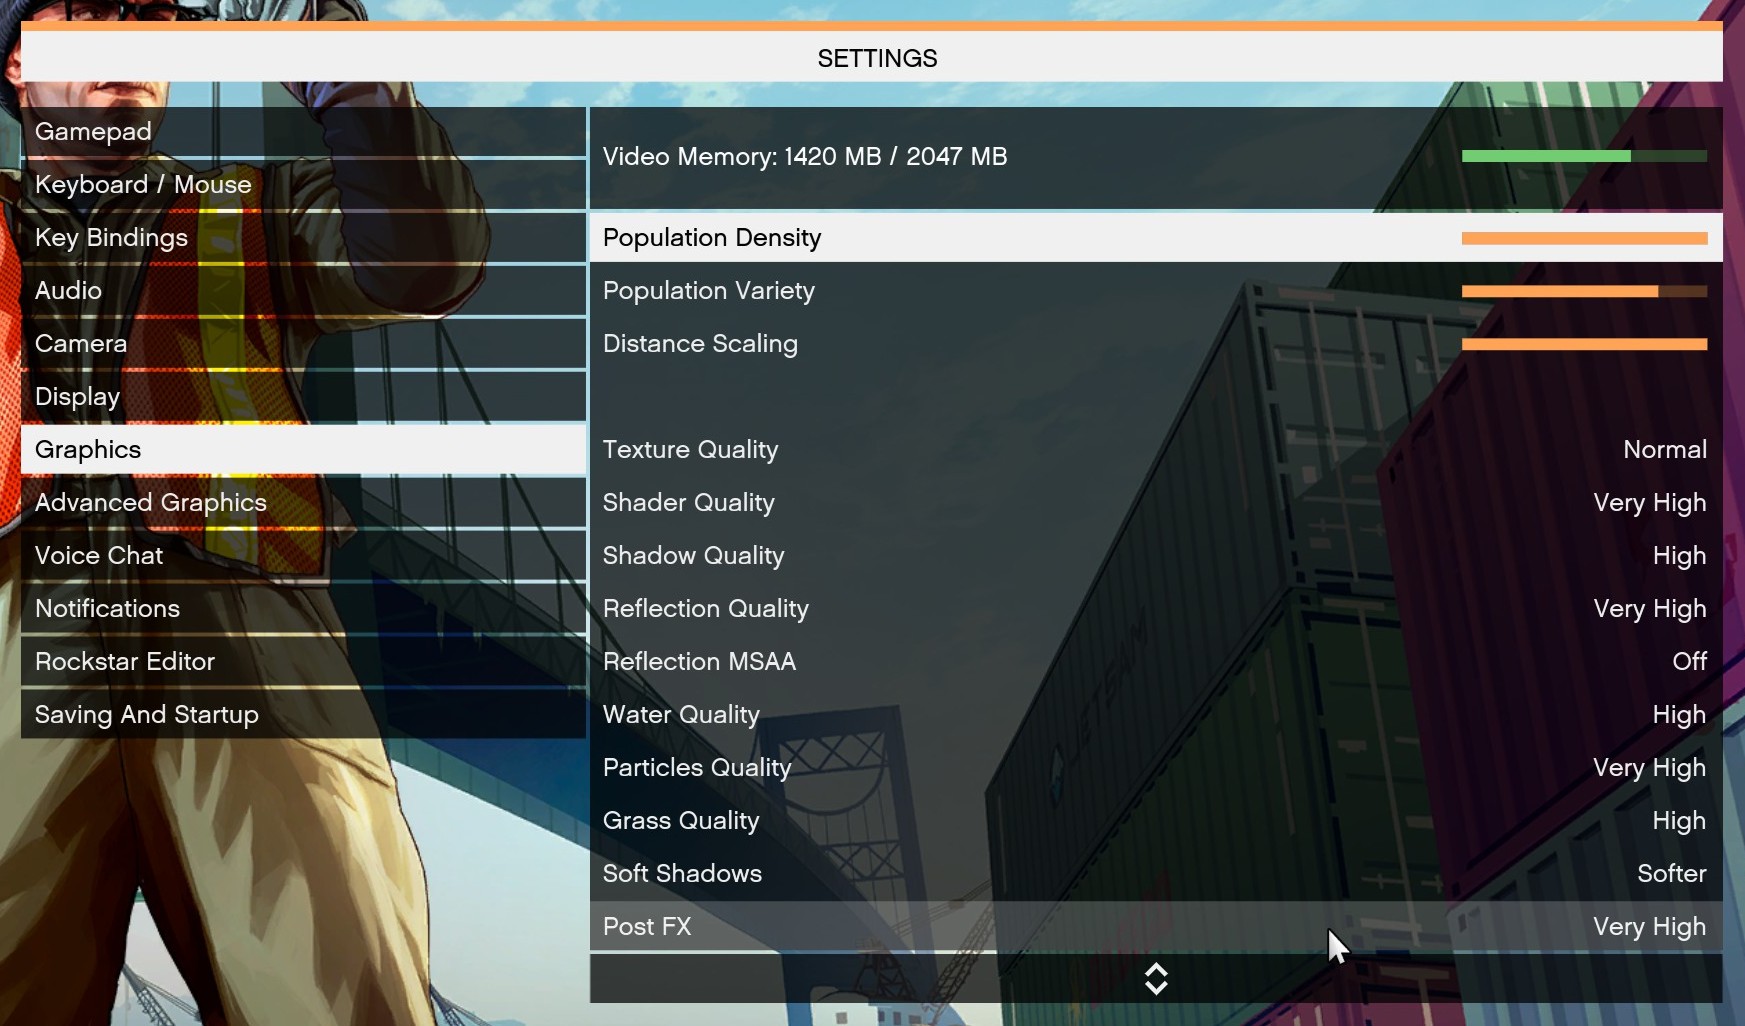
There are no presets for the graphics options on GTA, allowing the user to adjust options such as population density and distance scaling on sliders, but others such as texture/shadow/shader/water quality from Low to Very High. Other options include MSAA, soft shadows, post effects, shadow resolution and extended draw distance options. There is a handy option at the top which shows how much video memory the options are expected to consume, with obvious repercussions if a user requests more video memory than is present on the card (although there’s no obvious indication if you have a low end GPU with lots of GPU memory, like an R7 240 4GB).
To that end, we run the benchmark at 1920x1080 using an average of Very High on the settings, and also at 4K using High on most of them. We take the average results of four runs, reporting frame rate averages, 99th percentiles, and our time under analysis.
All of our benchmark results can also be found in our benchmark engine, Bench.
MSI GTX 1080 Gaming 8G Performance
1080p


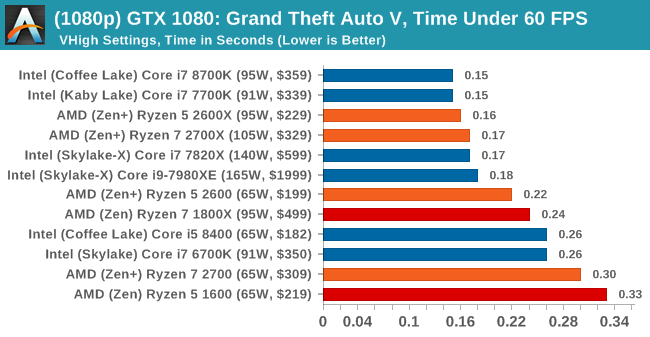
4K


Conclusion: Catching the Incumbent
Throughout AMD’s journey with Zen, the goal of high-performance x86 compute has two goals: be competitive, and be the best. Without a doubt the first generation of Ryzen certainly succeeded in being competitive, with analysts and outlets showing Ryzen processors in top selling lists, and review benchmarks putting the top AMD chips competitively against Intel’s high-end desktop parts. The goal, for the next few years, is to grab that low hanging microarchitectural fruit, and to taking advantage of new process nodes as time goes on. First stage is Ryzen’s second generation, known as the Ryzen-2000 series.
In this review we’ve shown that AMD met its goal of an additional 3% raw performance gain, with our benchmarks showing +3.1%. Combining this with the frequency increases derived from the GlobalFoundries 12nm manufacturing process, and turbo features such as Precision Turbo Boost making the most of thermal limits in an intuitive way, AMD also hit its 10% performance gain between generations. This doesn’t sound like much in all honesty, as on the surface this seems little more than an improved manufacturing bump plus some intelligent reduction in cache latency – if this was Intel, we’d be crying out for a big and brash gain in performance, but AMD is still riding the Zen design train and the focus is on the next full microarchitectural update in Zen 2, so most users and journalists are giving AMD a certifiable thumbs up at this point hoping to see a bigger jump next time around.
4K Gaming Analysis
However, everyone wants to know about the Ryzen 2000-series results. We start with gaming, and first up in our Performance/Price graphs is the high-end 4K gaming results. Our results take the R7 1800X as the base ‘100%’ and we take the geometric mean over all of our gaming tests at 4K.
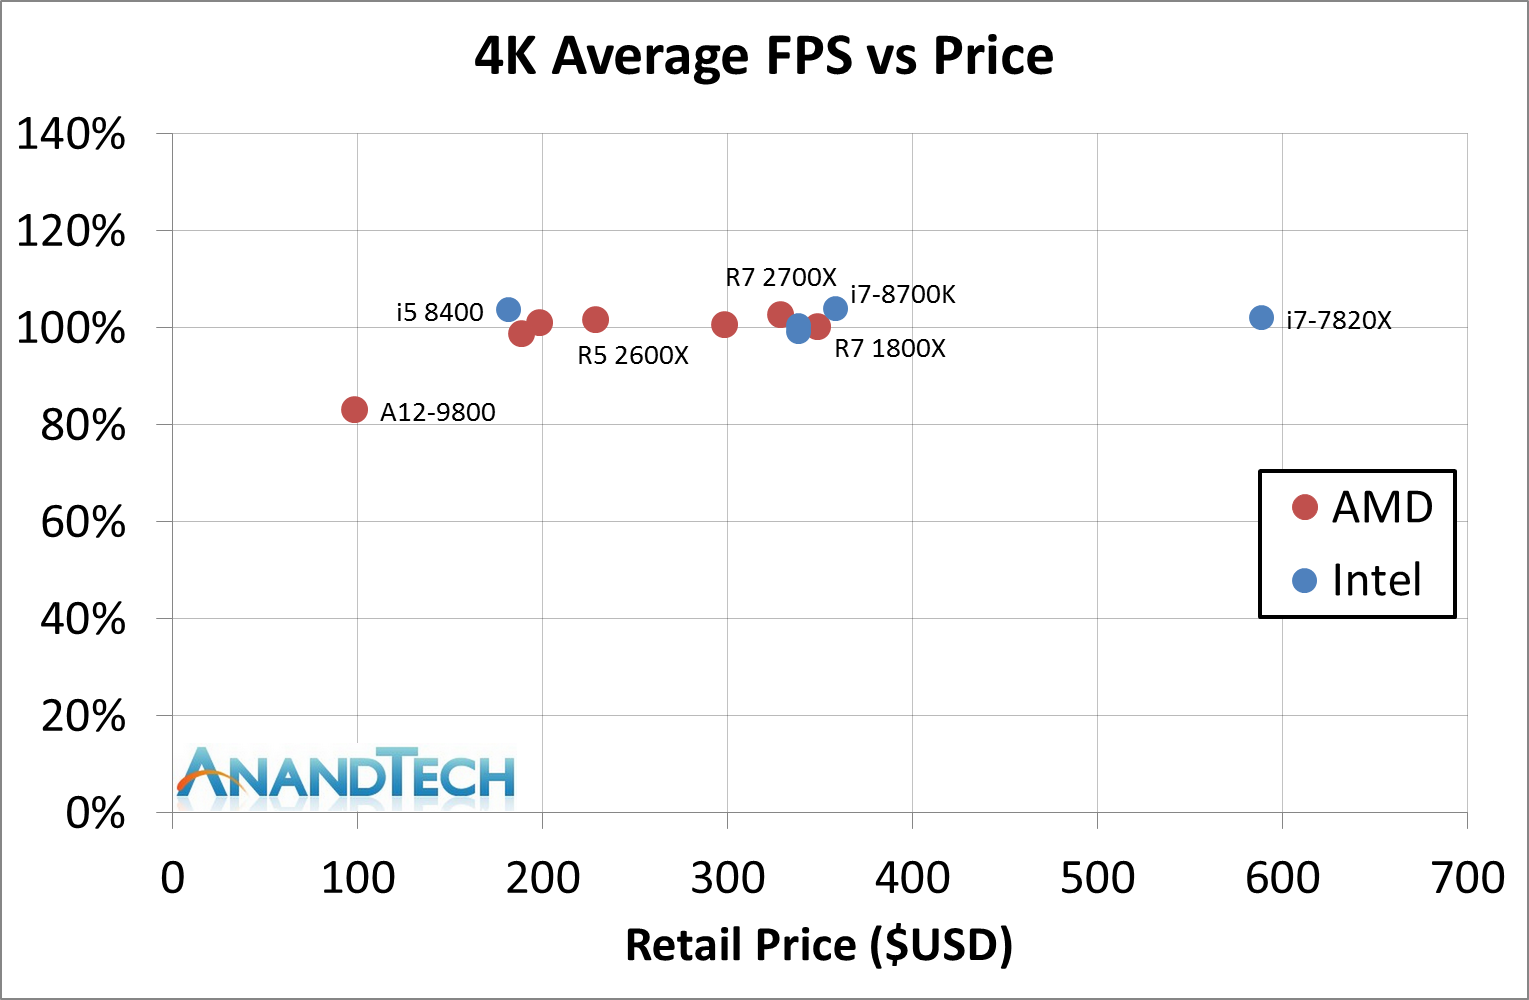
Across the board, the new Ryzen 2000-series processors improved over the Ryzen 7 1800X, even the Ryzen 5 2600, from 1-3%. The Intel processors were 0-4% ahead of the 1800X, with both Coffee Lake processors being at that top 4%. In a GPU limited scenario here, there is some benefit to that single core performance for sure, however all the modern CPUs at a reasonable frequency seem plenty to get through.
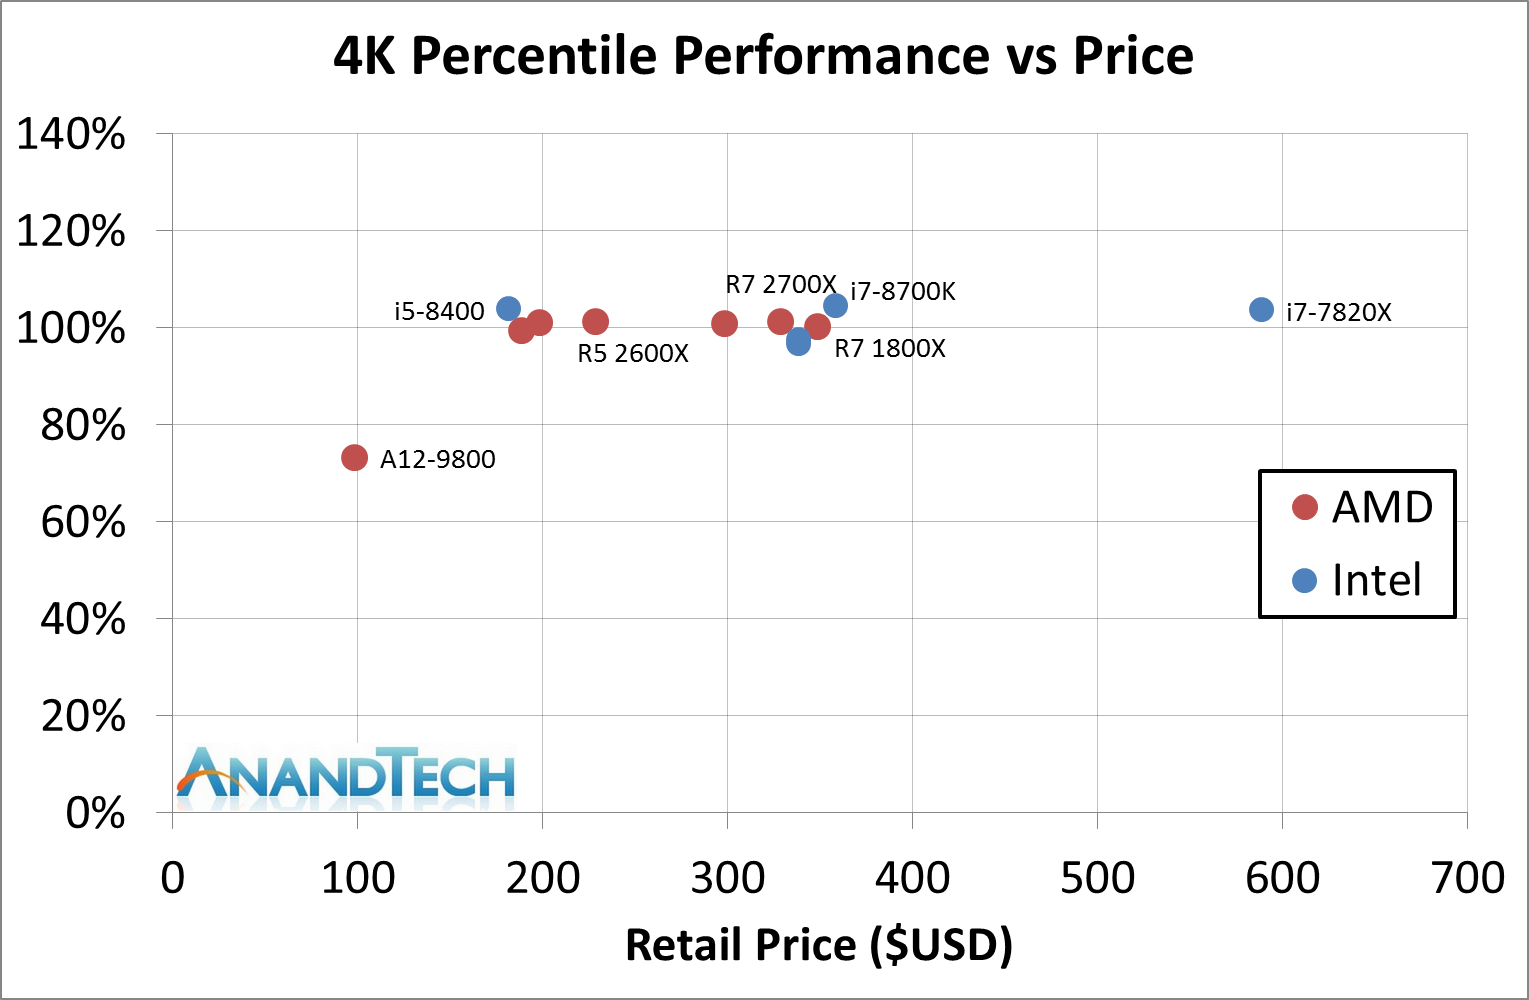
For 99th percentile graphs, the new AMD processors either draw level or narrowly beat the Ryzen 1000-series. For our Intel tests, the 6700K/7700K previous generations are both down 3% over the 1800X, but the others are up 4% over the 1800X. Intel pushing Coffee Lake has helped it get that top spot, but all the processors (except Bristol Ridge, the A12-9800) perform pretty much equal again.
1080p Gaming Analysis
The key aspect for some users is in the lower resolution gaming: 1920x1080 is still the resolution that dominates the gaming charts, no matter how much us enthusiasts like to push for more pixels. Some readers reached out to us stating that they still buy the best graphics card but run at 200+ FPS at low resolutions, just for responsiveness. Running at lower resolution is a poor indication of future CPU performance, but what matters is the real world numbers that we are seeing today.
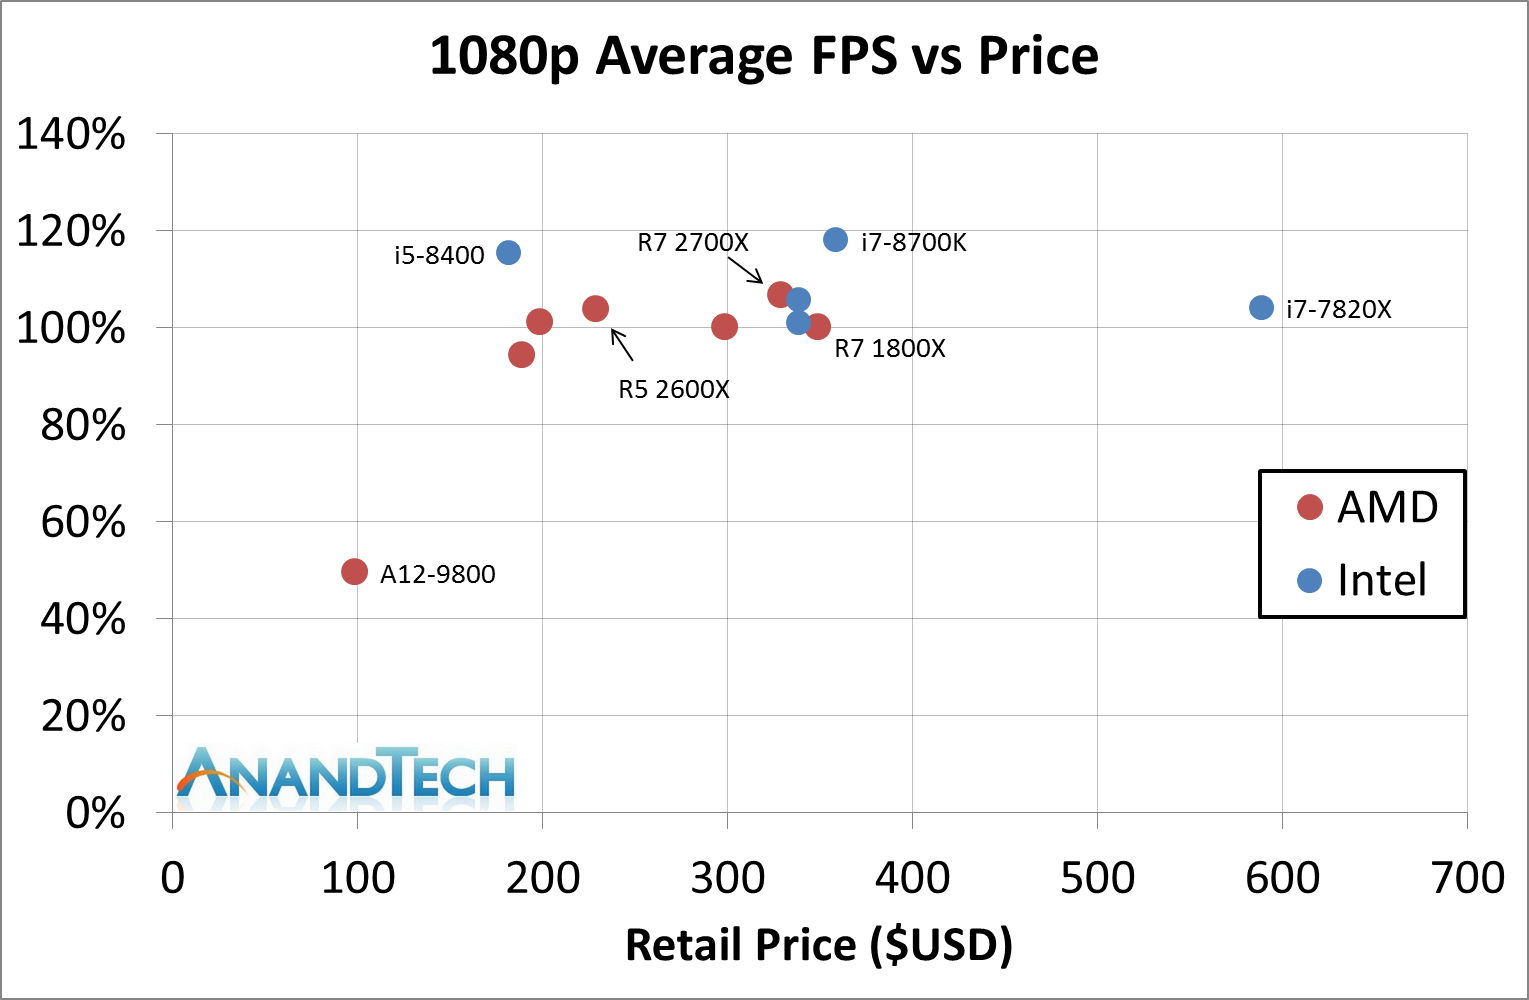
At this resolution, the Ryzen 7 2700X pushes an average +7% over the previous generation 1800X, and the new 65W parts easily matching the 1800X as well. Users who were looking at the budget friendly Ryzen 5 1600, the best seller for AMD last year according to some reports, can now look at the 2600 for +7% or 2600X for a +10% gain over the 1600.
However, Intel pulls out a win here. Through the higher IPC and clock speed, the Coffee Lake processors are 8-10% over Ryzen 7 2700X, ranging from +3% to +25% depending on the title. By contrast, our results do show that the Ryzen 7 2700X blasts past the older Intel generation processors, maing the 2700X win by a small margin to Kaby Lake and a 5%+ margin to Skylake.
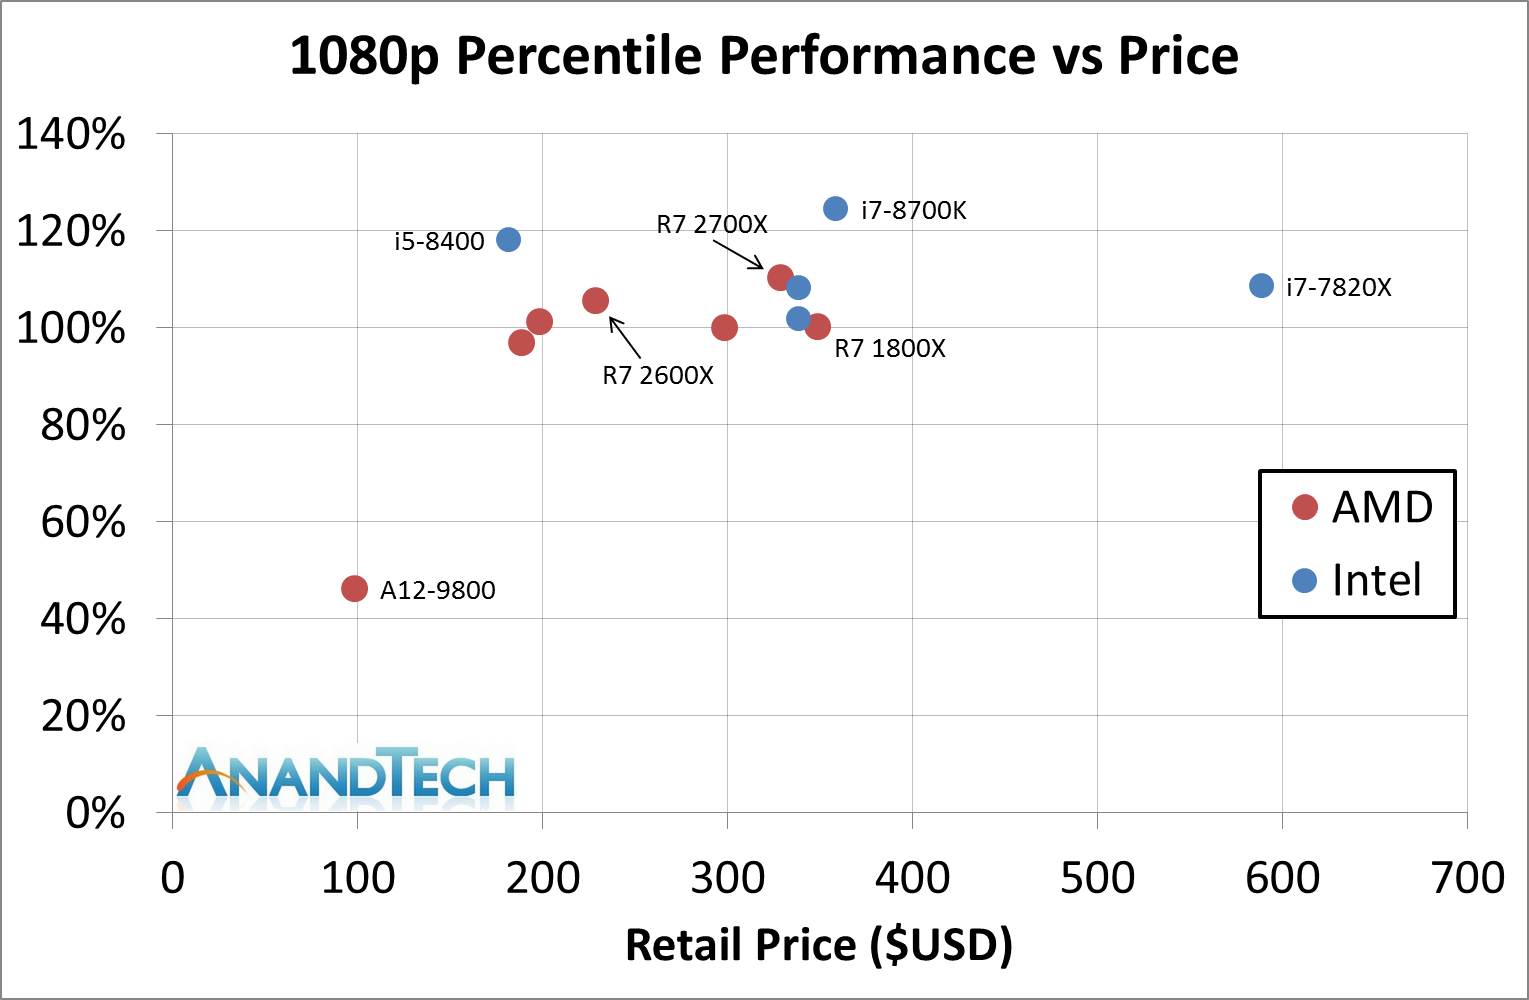
The 99th percentile graph at 1080p looks like a stretched out version of the average frame rate graph, and this is broadly accurate: the processors better at 1080p perform even better on percentiles. Out of all the metrics AMD needs to be competitive on, this is the one where the new performance boost works best, but there is still work to do. This will, in all honesty, look better if and when AMD can match Intel on frequency. AMD also has a deficit in main memory DRAM latency, which we have cited as a factor in previous testing for 99th percentile frame rates. It will be interesting if AMD pushes ahead with a higher supported memory frequency quicker than Intel, because that would help here.
Workstation Analysis
For mainstream processor lines, with Ryzen-1000, AMD put eight cores and sixteen threads against Intel’s Kaby Lake with four cores and eight threads. This time around Intel has moved up to six cores with Coffee Lake, making it 12 on Intel vs. 16 on AMD, and pumped some more turbo frequency as well, but Intel is pushing the power budget beyond the box rating by a considerable margin by comparison. In the mid-range, where it was four threads against twelve, it is now six against twelve, however again Intel hits the higher frequencies.
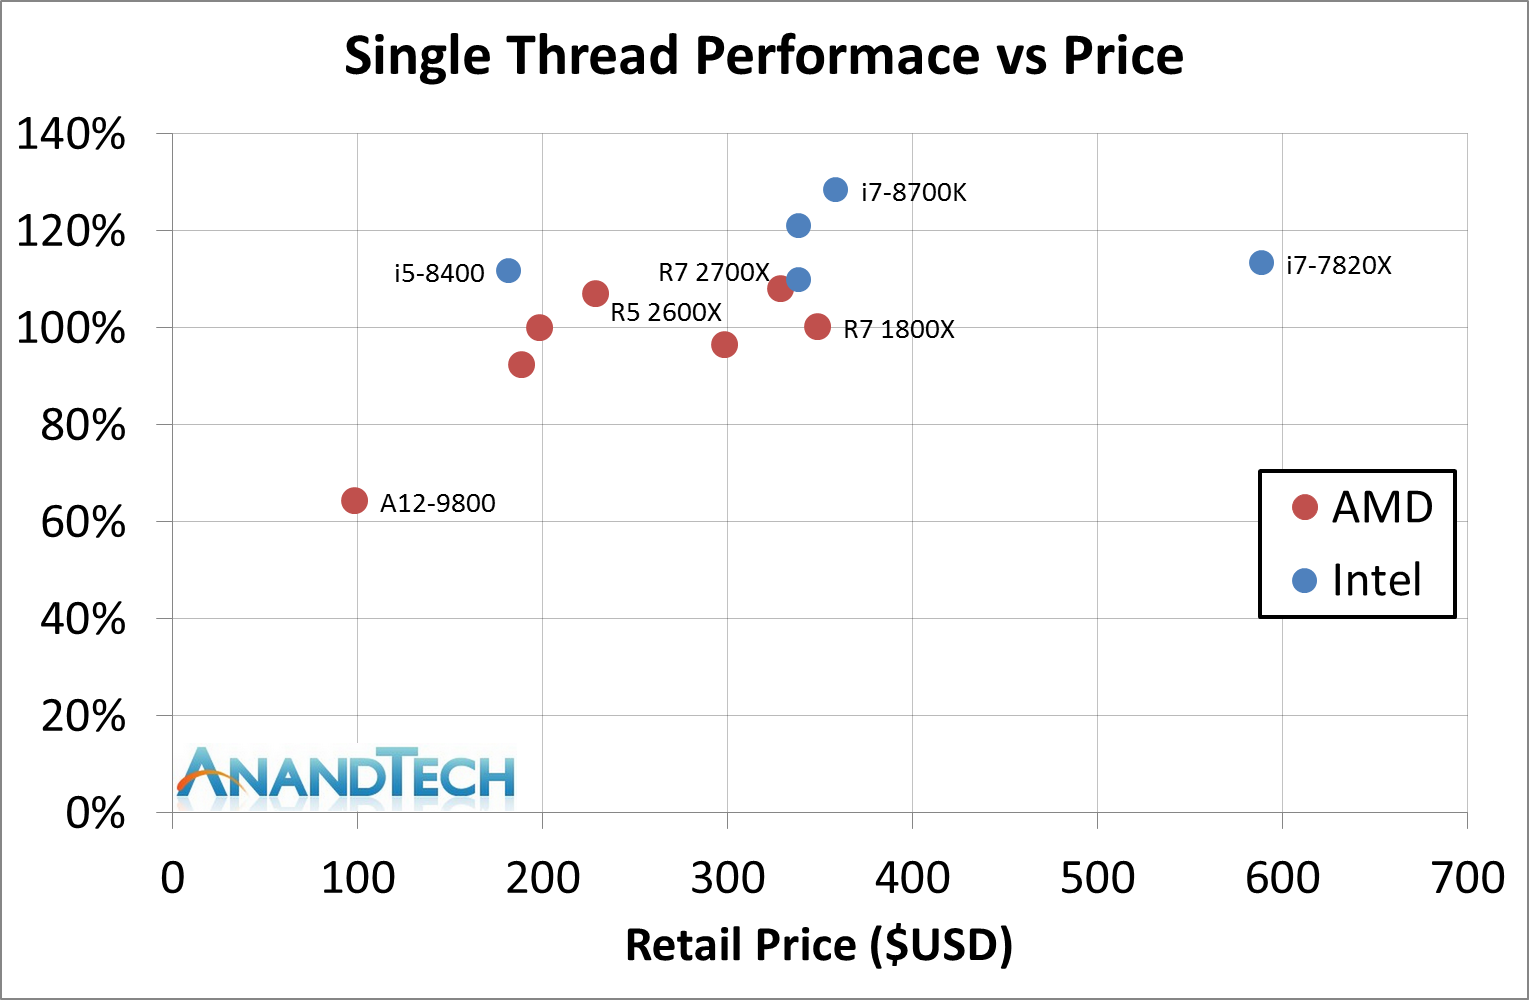
In our single threaded benchmarks, the new Ryzen-2000 series now does match Intel’s Skylake processors for performance. In the last round of comparisons, Intel still had some advantage, but now the two are equal. Unfortunately for AMD, Intel is two further ‘generations’ ahead, through Kaby Lake and Coffee Lake, which mainly add in single core performance through additional frequency. This means that a Core i5-8400 does beat the best AMD has in single thread, and the Core i7-8770K rules the roost.
In multi-threaded workloads, a number of additional variables come into play. The nature of the threading in each core, such as which parts of the core are dynamic or statically partitioned, come into play, along with how memory and cache are managed. Here AMD has been aggressive in low level cache latency and size, however the AMD L3 non-inclusive cache is transposed against Intel’s L3 write-back cache which is more useful, as well as lower latency main memory.
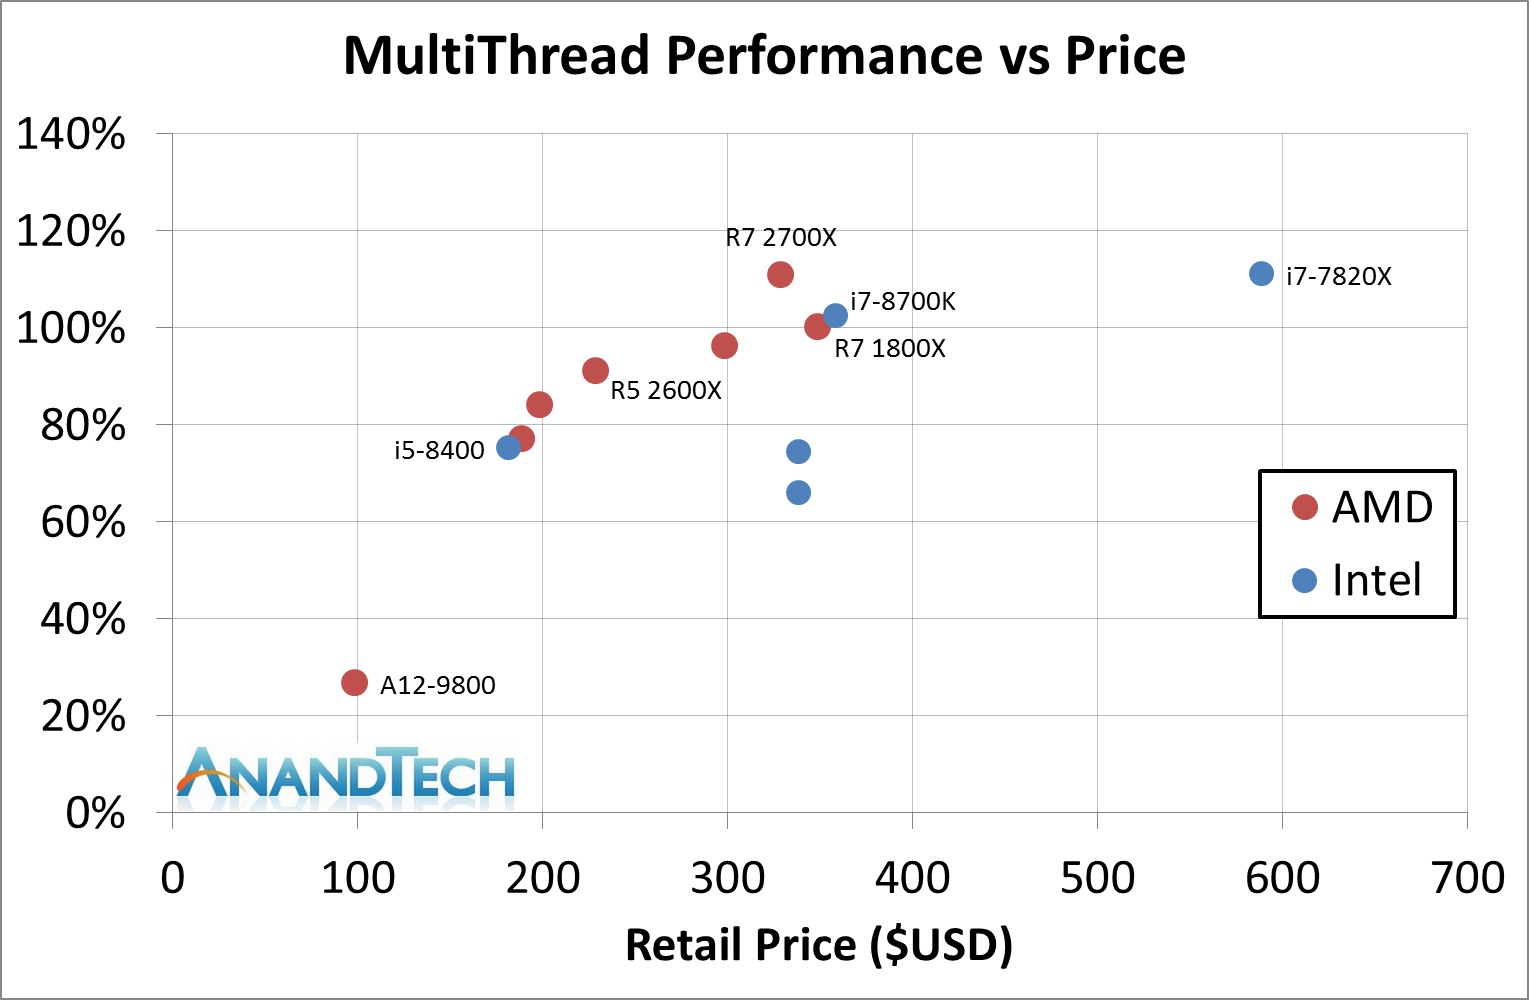
What we see here on the AMD side is that only the Ryzen 7 2700X eclipses the old Ryzen 7 1800X, with the 2700 close behind. In this price bracket, the higher thread count of the AMD chip gives it a healthy lead over the Coffee Lake i7-8700K, and it also eclipses the eight-core Skylake-X Core i7-7820X in most tests. What is very clear however is that the previous generation Intel parts, the i7-6700K and i7-7700K, sit very much behind the competition, and even behind AMD’s cheapest second generation Ryzen processor, the Ryzen 5 2600.
If someone had said a few years ago that AMD would design a second generation Ryzen processor in 2018 that would eclipse all of Intel’s Skylake and Kaby Lake processors, I would have laughed. But here we are, and it speaks to AMD’s execution. If a user wants a chip for a multi-threaded workload, the $199 Ryzen 5 2600 is the best budget performer on the market today.
In that mid-range price battle, the Ryzen 5 2600 also gives a swift kick to the Core i5-8400. It is a non-contest.
Overall Thoughts
You Win Some, You Lose Some, But Customers Win
When competition exists, each product needs to put its best foot forward. Tackling an incumbent is hard, with their existing relationships and high budgets, but forcing them to react is seen as a win for customers. A criticism levied at Intel in recent years is stagnation – minor process updates while waiting for a new process node; with so many eggs in the basket for future generation products, anything equally competitive can start to look attractive in the market. Those inside the industry can tell that while Intel is iterating on similar 14nm designs each year while waiting for 10nm to come to market, AMD is putting its best foot forward with Zen and Ryzen on 14nm, now with Ryzen 2 on GF 12nm.
Boiling down to simple recommendations this time around is actually going to be fairly easy.
Any users that would like high single threaded performance, or high performing 1080p gaming using a mid-range GPU, then Intel’s Core i5-8400 is going to fit the bill.
For hardcore enthusiasts, running high-end graphics at 4K or like getting their general compute on, the Ryzen 2000-series is looking the best choice. At each price point AMD can fit anyone’s 4K gaming needs and win in raw instruction throughput.
AMD also bundles a half-decent stock cooler in the box, something Intel has neglected in recent years, making the product even more attractive.


