Original Link: https://www.anandtech.com/show/4902/intel-ssd-710-200gb-review
The Intel SSD 710 (200GB) Review
by Anand Lal Shimpi on September 30, 2011 8:53 PM EST- Posted in
- Storage
- SSDs
- Intel
- Intel SSD 710
When Intel entered the SSD market one of its declared goals was to bring the technology into the mainstream. The goal was so important to Intel that its consumer drive was branded X25-M, with the M standing for mainstream. Intel's desire for SSD ubiquity wasn't entirely altruistic however. Mechanical storage acted as a potential gate to increasing CPU performance. Eventually, without significant improvements in IO performance, CPU improvements would be less visible to most users. SSDs would help alleviate this bottleneck.
It wouldn't be untrue to say that Intel accomplished its mission. The client SSD market was in a state of disarray before Intel arrived on the scene. Although we still have problems today, there are a number of affordable options for end users and lots of competition. Samsung, Marvell, Indilinx, JMicron and even SanDisk are now vying for control of the market.
With healthy competition, significant performance improvements and (hopefully) improved reliability in the consumer SSD space, Intel will actually begin defocusing itself from this market over the coming years. Intel needs to keep margins as high as possible to appease shareholders, and the consumer SSD business is in a race to the bottom. Dollars per GB are all that matter here once you deliver a certain level of performance and reliability.
Intel won't abandon the consumer SSD market completely, it will still compete in the high end space but there's a good reason that the mainstream moniker has been dropped from Intel's product names. Intel will shift more of its attention to the enterprise space, bringing that technology to the high end desktop/workstation users where it can (e.g. Cherryville will be focused on both enterprise and enthusiast desktop users). But as you have already seen, I wouldn't expect Intel to actively compete in driving mainstream SSD pricing down further. That market now belongs to the players I mentioned above.
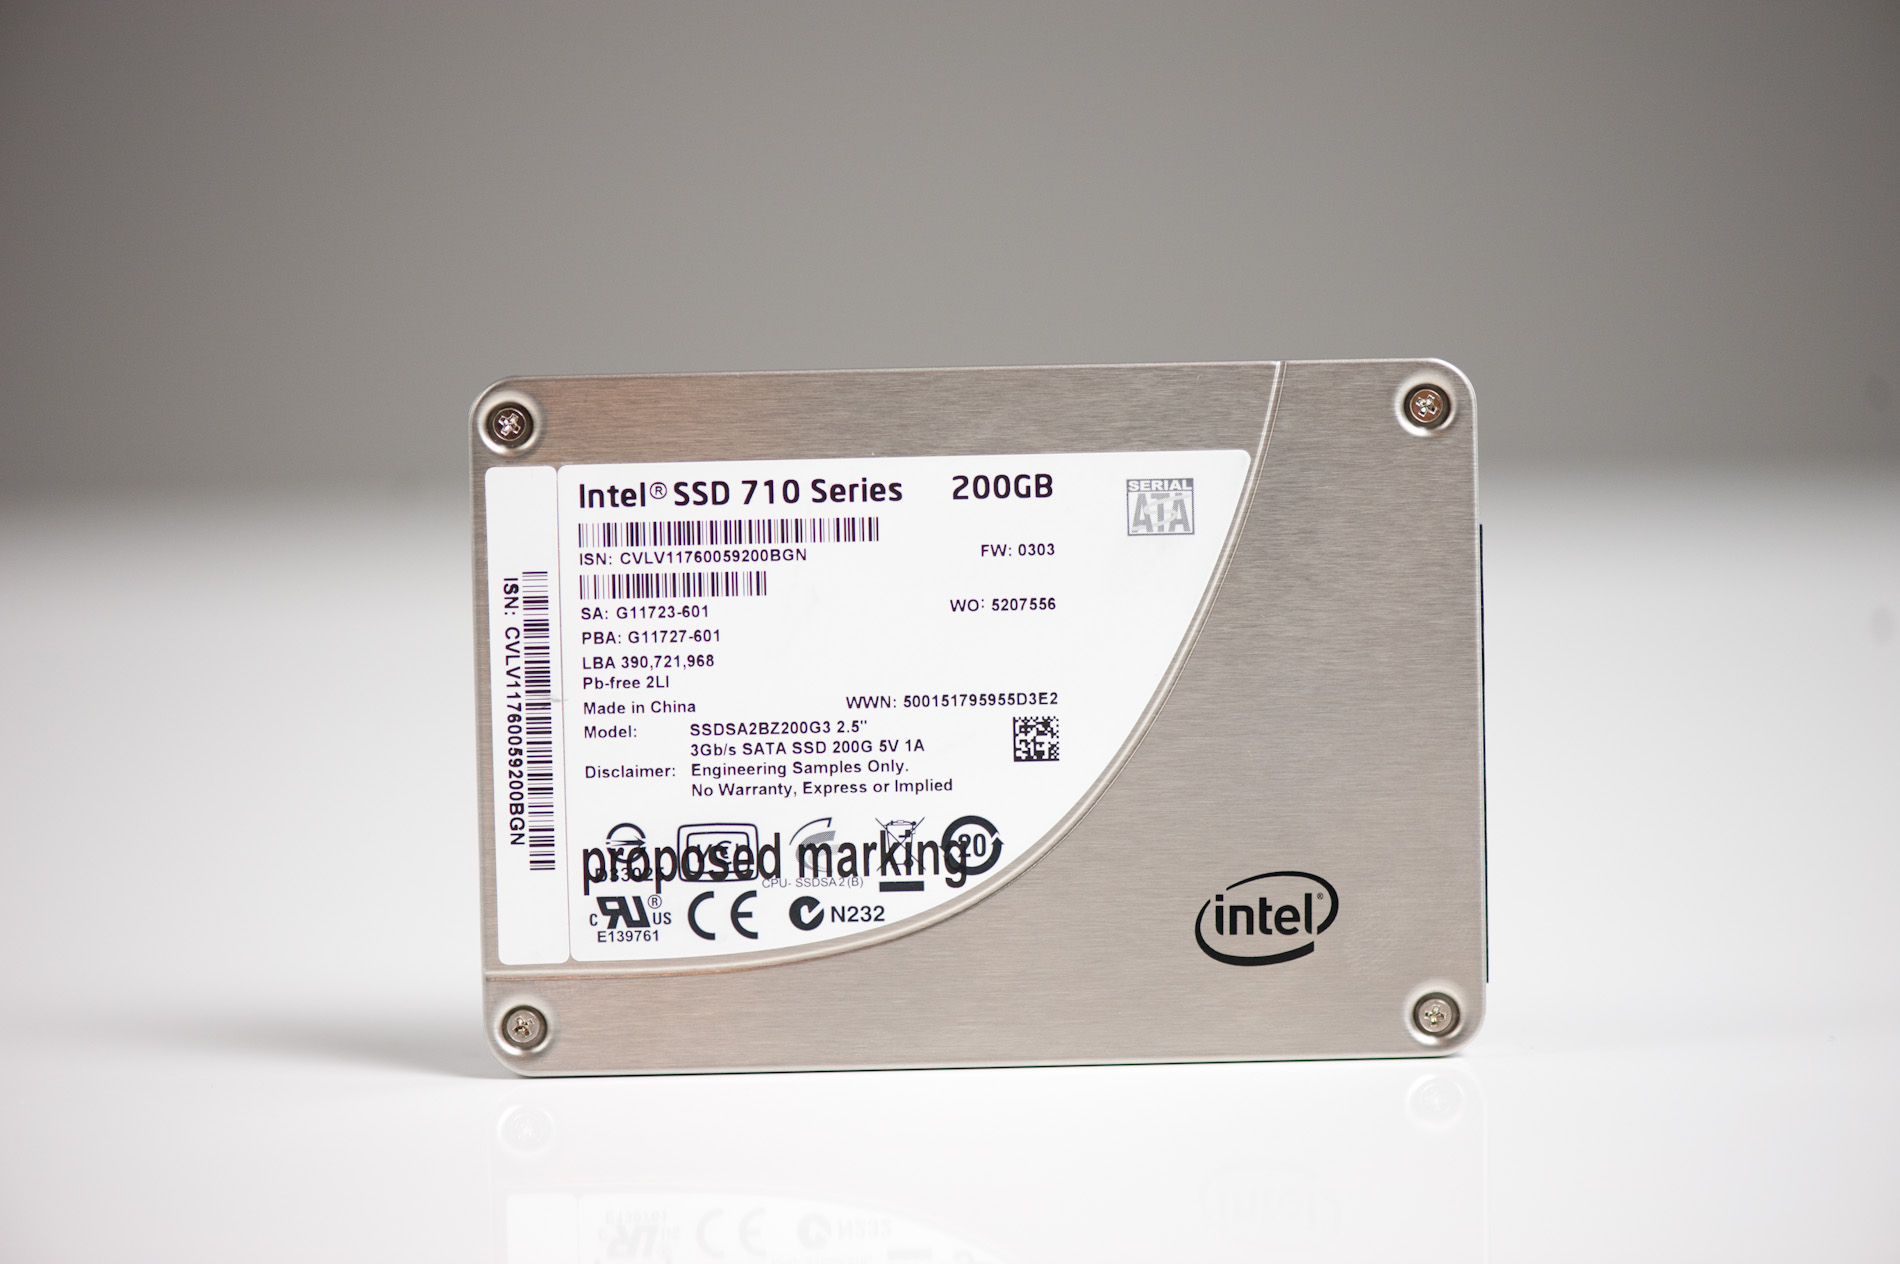
What better way to kick off the shift in focus than with a new enterprise drive: Intel's SSD 710, the long awaited successor to the X25-E. Unlike previous Intel SSDs however the 710 isn't aimed at significantly improving performance. Instead the 710 attempts to offer larger capacities than the X25-E, at similar endurance and performance levels. That's right, the 710 shouldn't outperform the X25-E, it'll just be cheaper.
At first glance that's not a very impressive claim. The X25-E came out in 2008 (available in early 2009) and hasn't been updated since. Delivering performance similar to that of a three-year-old SSD doesn't sound all that exciting. If huge performance gains are what you're after, the SSD 710 isn't for you.
The 710 is built off the same architecture as the Intel SSD 320. It uses the same controller but with a newer firmware revision. The firmware is obviously also tuned for enterprise workloads.
| Enterprise SSD Comparison | |||||
| Intel SSD 710 | Intel X25-E | Intel SSD 320 | |||
| Capacities | 100 / 200 / 300GB | 32 / 64GB | 80 / 120 / 160 / 300 / 600GB | ||
| NAND | 25nm HET MLC | 50nm SLC | 25nm MLC | ||
| Max Sequential Performance (Reads/Writes) | 270 / 210 MBps | 250 / 170 MBps | 270 / 220 MBps | ||
| Max Random Performance (Reads/Writes) | 38.5K / 2.7K IOPS | 35K / 3.3K IOPS | 39.5K / 600 IOPS | ||
| Endurance (Max Data Written) | 500TB - 1.5PB | 1 - 2PB | 5 - 60TB | ||
| Encryption | AES-128 | - | AES-128 | ||
| Power Safe Write Cache | Y | N | Y | ||
| Temp Sensor | Y | N | N | ||
Since it uses the same controller as the 320, you get the same benefits. There's still no 6Gbps support, but you do get full disk encryption (enabled via ATA password). Intel also outfits the 710 with capacitors to ensure any data stored in the controller's caches can be committed to NAND in the event of a power failure. The 710 also includes surplus NAND arrays (and data redundancy). In the event of a full NAND die failure, you shouldn't see any data loss.
What Intel promises with the 710 is reliability and a clear upgrade path from the X25-E. The idea here is most enterprise workloads exist on mechanical drives today. Moving to a small array of SSDs quickly alleviates any IO bottlenecks, then the only issues that remain are cost, capacity and reliability. It's the three of these areas that the SSD 710 looks to address.
Don't get too excited about the cost angle though. While the Intel SSD 710 drives cost-per-GB down much lower than the old X25-E, it is still an enterprise drive so expect to pay more than what you'd find as a consumer.
The pricing breakdown is below:
| Intel SSD 710 Pricing Comparison | ||||||
| X25-E 64GB | 100GB | 200GB | 300GB | |||
| Price | $790 | $650 | $1250 | $1900 | ||
| Price per GB | $12.34 | $6.50 | $6.25 | $6.33 | ||
At $6.50/GB the 710 is significantly cheaper than the outgoing X25-E which is still priced at over $11/GB today. When it first launched the X25-E commanded over $15/GB. Regardless of performance, these prices alone are enough to drive away consumers. If you haven't gotten the hint by now, the 710 is strictly for enterprise customers.
Capacities are also significantly higher. While the X25-E topped out at 64GB, the 710 will take you all the way up to 300GB.
Reliability wasn't an issue with the X25-E, thus it mustn't be an issue with the 710 either. There's just one problem: the X25-E could depend on 50nm SLC NAND, boasting an endurance rating of 100,000 program/erase cycles per cell, the 710 however needs to somehow equal that with 25nm MLC NAND. As a reference, consumer-grade MLC NAND is good for 3000 - 5000 p/e cycles.
Why use MLC NAND? The shift to MLC is what gives the 710 its cost and capacity advantages over the X25-E. How does Intel have its cake and eat it too? By using something it calls MLC-HET NAND.
NAND Recap
Flash memory is non-volatile storage and in that sense it's similar to a hard drive. Once you write to a NAND flash cell it can store that data for an extended period of time without power.
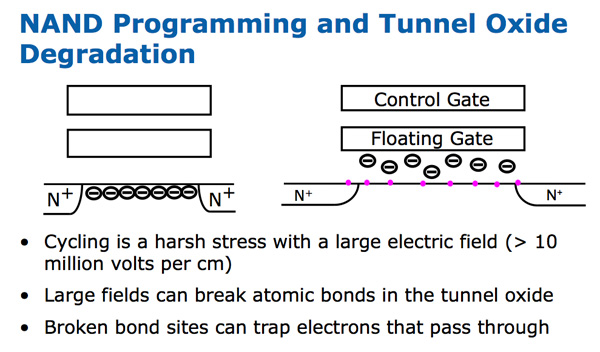
You write to NAND through a quantum tunneling process. Apply a high enough voltage across a floating-gate transistor and some electrons will actually tunnel through an insulating oxide layer and remain on the floating gate, even when the voltage is removed. Repeated tunneling can weaken the bonds of the oxide, eventually allowing electrons to freely leave the floating gate. It's this weakening that's responsible for a lot of NAND endurance issues, although there are other elements at play.
NAND is programmed and read by seeing how each cell responds to various voltages. This chart shows the difference between MLC (multi-level-cell) and SLC (single-level-cell) NAND:
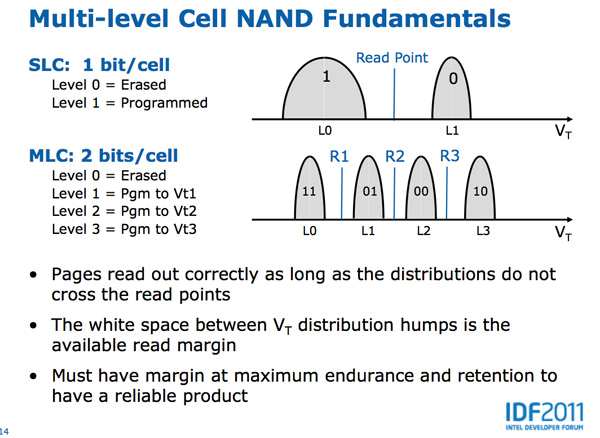
Both types of NAND are identical architecturally, it's just a question of how many voltages you map to bits on the cell. MLC (2-bit-per-cell ) has four different voltage levels that correspond to values while SLC only has two. Note that each value can correspond to a distribution of voltages. As long as the threshold voltage falls within that range, the corresponding value is programmed or read.
The white space in between each voltage distribution is the margin you have to work with. Those blue lines above are read points. As long as the voltage distributions don't cross the read points, data is accessed correctly. The bigger the margin between these points, the more write cycles you'll get out of your NAND. The smaller the margin, the easier it is to produce the NAND. It's easier to manufacture NAND that doesn't require such precise voltages to store and read data from each cell. Over time physical effects can cause these voltage distributions to shift, which ultimately leads to cell failure.
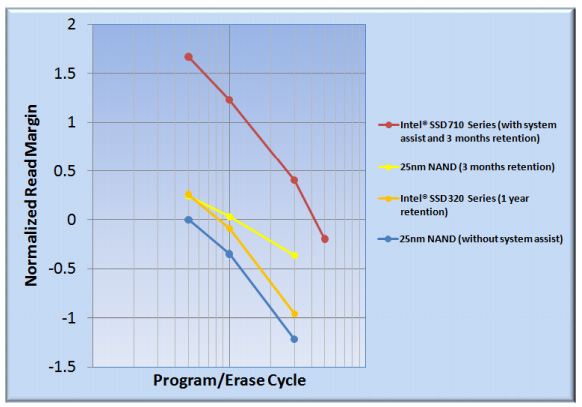
As MLC NAND gets close to the end of its life, these margins start narrowing considerably. Continuously programming and erasing NAND cells weakens the oxide, eventually allowing electrons to become stuck in the oxide itself. This phenomenon alters the threshold voltage of the transistor, which in turn shifts bit placements:
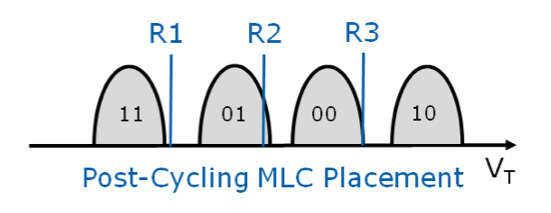
There's now ambiguity between bits which, if this cell were allowed to remain active in an SSD, would mean that when you go to read a file on your drive there's a chance that you won't actually get the data you're requesting. A good SSD should mark these bits bad at this point.
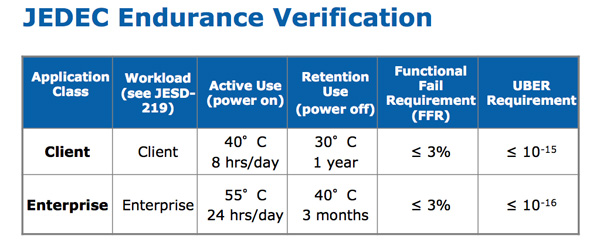
There's a JEDEC spec that defines what should happen to the NAND once its cells get to this point. For consumer applications, the NAND should remain in a read-only state that can guarantee data availability for 12 months at 30C with the drive powered off. Manufacturers must take this into account when they test and qualify their NAND. If you're curious, JEDEC also offers guidelines on how to cycle test the NAND to verify that it's compliant.
By now we all know the numbers. At 50nm Intel's MLC NAND was rated for 10,000 program/erase cycles per cell. That number dropped to 5,000 at 34nm and remained at the same level with the move to 25nm. Across the industry 3,000 - 5,000 p/e cycles for 2x-nm 2-bit-per-cell MLC (2bpc) NAND is pretty common.
For desktop workloads, even the lower end of that range is totally fine. The SSD in your desktop or notebook is more likely to die because of some silly firmware bug or manufacturing issue than you wearing out the NAND. For servers with tons of random writes, even 5K p/e cycles isn't enough. To meet the needs of these applications, Intel outfitted the 710 with MLC-HET (High Endurance Technology) more commonly known as eMLC.
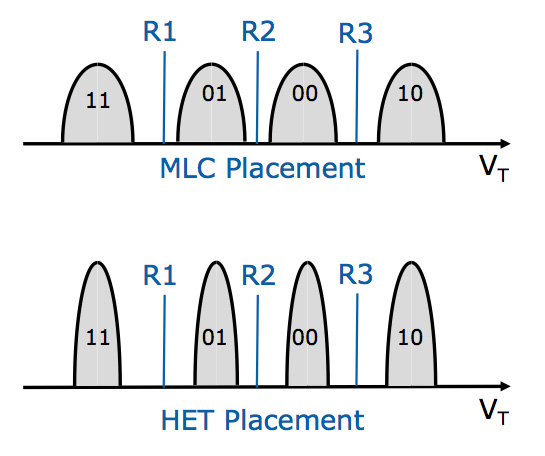
Fundamentally, Intel's MLC-HET is just binned MLC NAND. SLC NAND gets away with having ultra high p/e cycle counts by only having two bit levels to worry about. The voltage distributions for those two levels can be very far apart and remain well defined over time as a result. I suspect only the highest quality NAND was used as SLC to begin with, also contributing to its excellent endurance.
Intel takes a similar approach with MLC-HET. Placements are much more strict in MLC-HET. Remember what I said earlier, narrow ranges of voltages mapping to each bit level reduces the number of NAND die that will qualify, but you build in more margin as you cycle the NAND. If placements do shift however, Intel's SSD 710 can actually shift read points as long as the placements aren't overlapping.
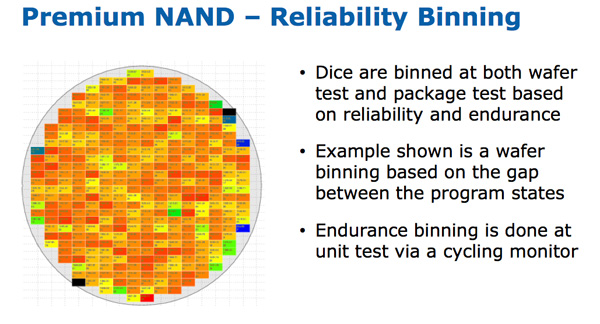
Similar to frequency binning CPUs, the highest quality NAND with the tightest margins gets binned into MLC-HET while everything else is shipped as standard MLC. And just like with frequency binning, there's a good chance you'll get standard MLC that will last a lot longer than it's supposed to. In fact, I've often heard from manufacturers that hitting up to 30K p/e cycles on standard MLC NAND isn't unrealistic. With its MLC-HET Intel also more frequently/thoroughly refreshes idle NAND cells to ensure data integrity over periods of extended use.
Intel performs one other optimization on MLC-HET. After you've exceeded all available p/e cycles on standard MLC, JEDEC requires that the NAND retain your data in a power-off state for a minimum of 12 months. For MLC-HET, the minimum is reduced to 3 months. In the consumer space you need that time to presumably transfer your data over. In the enterprise world, a dying drive is useless and the data is likely mirrored elsewhere. Apparently this tradeoff also helps Intel guarantee more cycles during the drive's useful life.
At IDF Intel told us the MLC-HET in the SSD 710 would be good for around 30x the write cycles of standard (presumably 25nm) MLC. If we use 3,000 as a base for MLC, that works out to be 90K p/e cycles for Intel's 25nm MLC-HET.
Total Bytes Written & Spare Area
90K p/e cycles seems a bit high and I can't find any Intel documentation that actually quotes that number, it's just what I heard at the 710 briefing in San Francisco. Luckily Intel has another metric it likes to use: total bytes written.
You don't get TBW for client drives, but for enterprise drives Intel will tell you exactly how many tera or petabytes of random 4KB or 8KB data you can write to the drive. These values are "up to" of course as actual lifespan will depend on the specific workloads.
| Intel SSD Endurance Comparison | |||||||
| X25-E 32GB | X25-E 64GB | 710 100GB | 710 200GB | 710 300GB | |||
| 4KB Random Writes | 1.0 PB | 2.0 PB | 500 TB | 1.0 PB | 1.1 PB | ||
| w/ +20% Spare Area | - | - | 900 TB | 1.5 PB | 1.5 PB | ||
Doing the math these values work out to be about 5K writes per cell (~5243), however that's assuming no write amplification. Performing a 100% random write across all LBAs for a full petabyte of data is going to generate some serious write amplification. The controller in the 710 tends to see write amplification of around 12x for 4KB random writes, which would put the rated cycle count at just under 63,000.
There's just one problem. The 200GB 710 I'm basing these calculations on doesn't actually have 200GB of NAND on-board, it has 320GB.
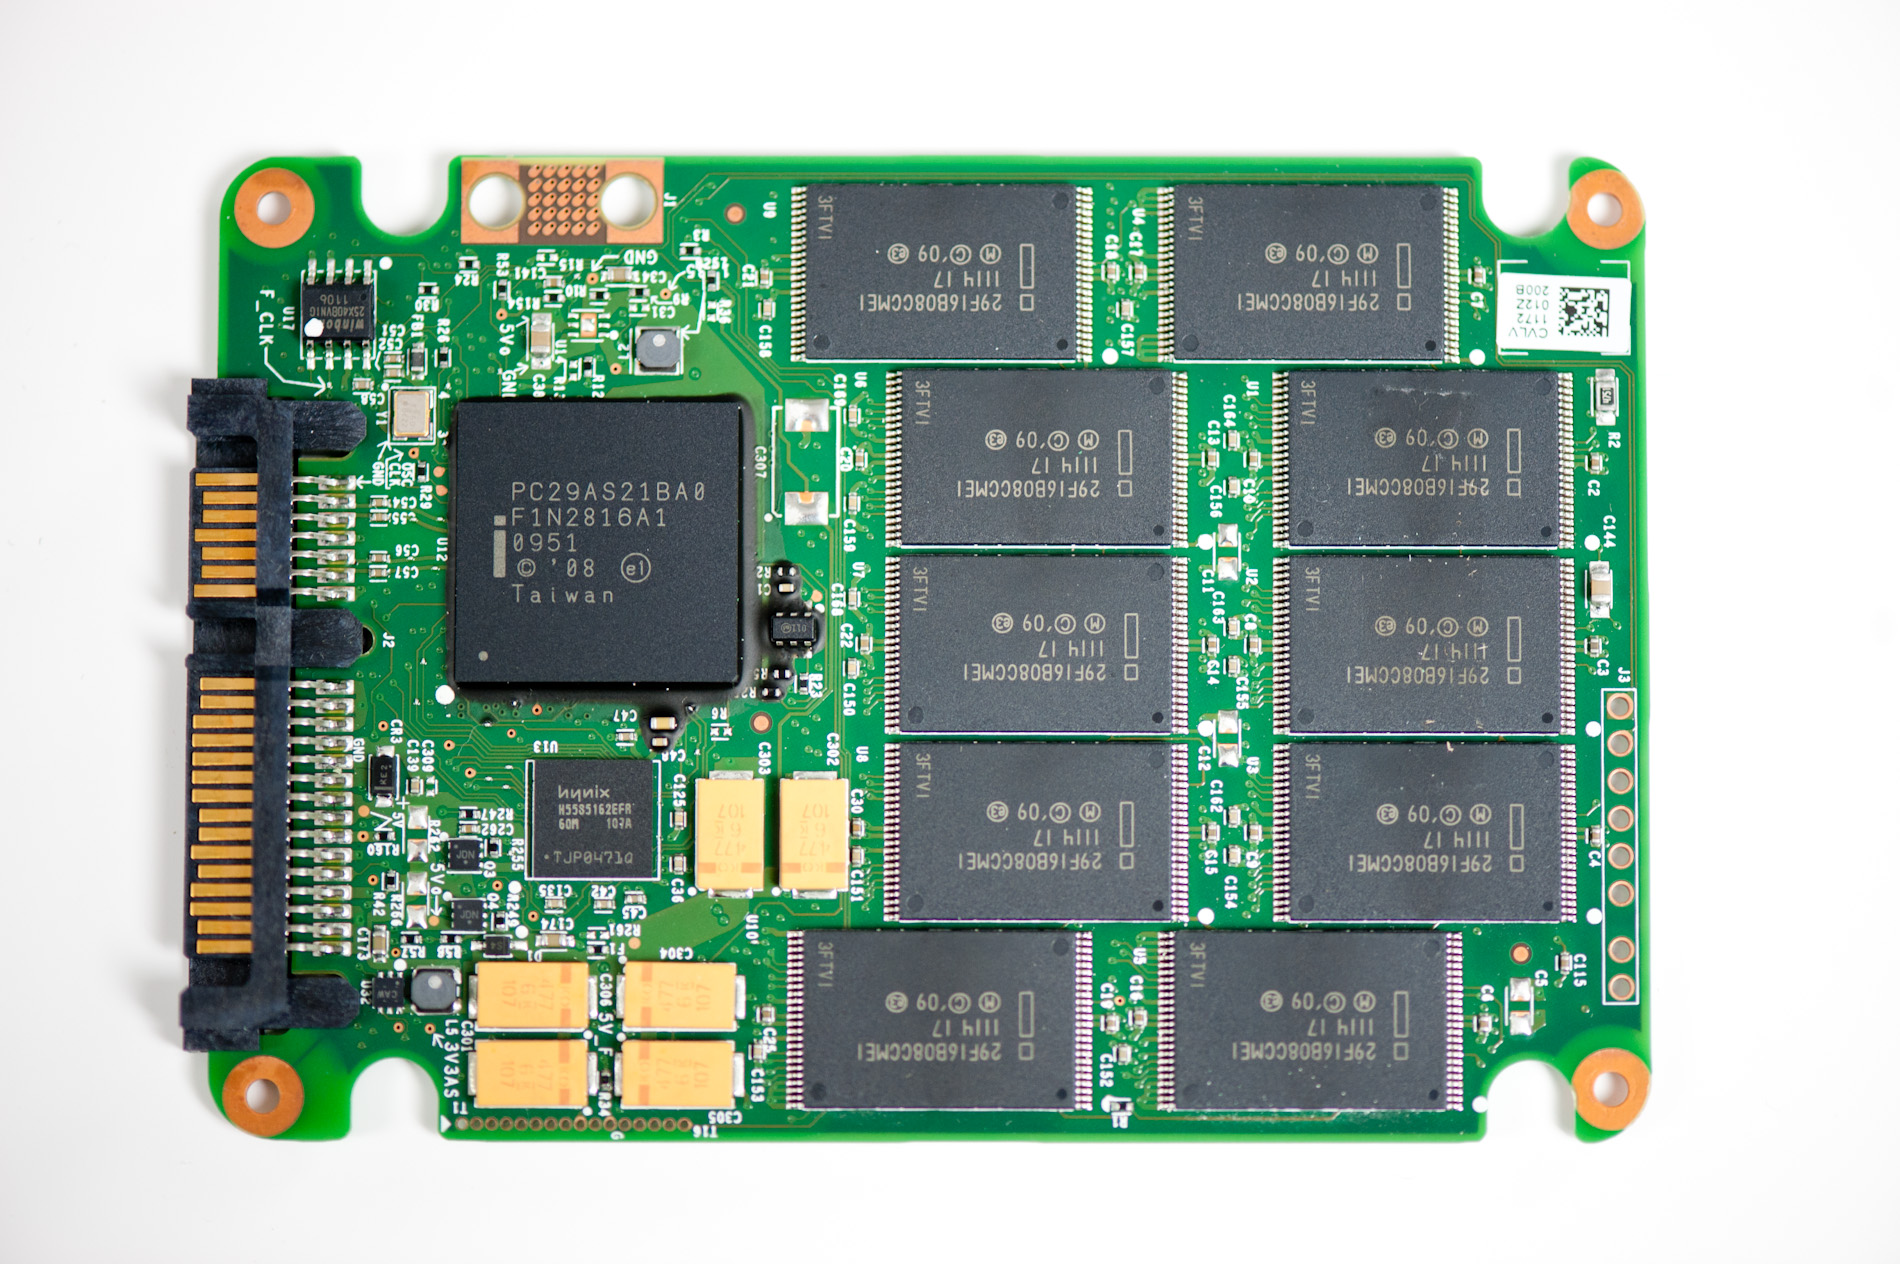
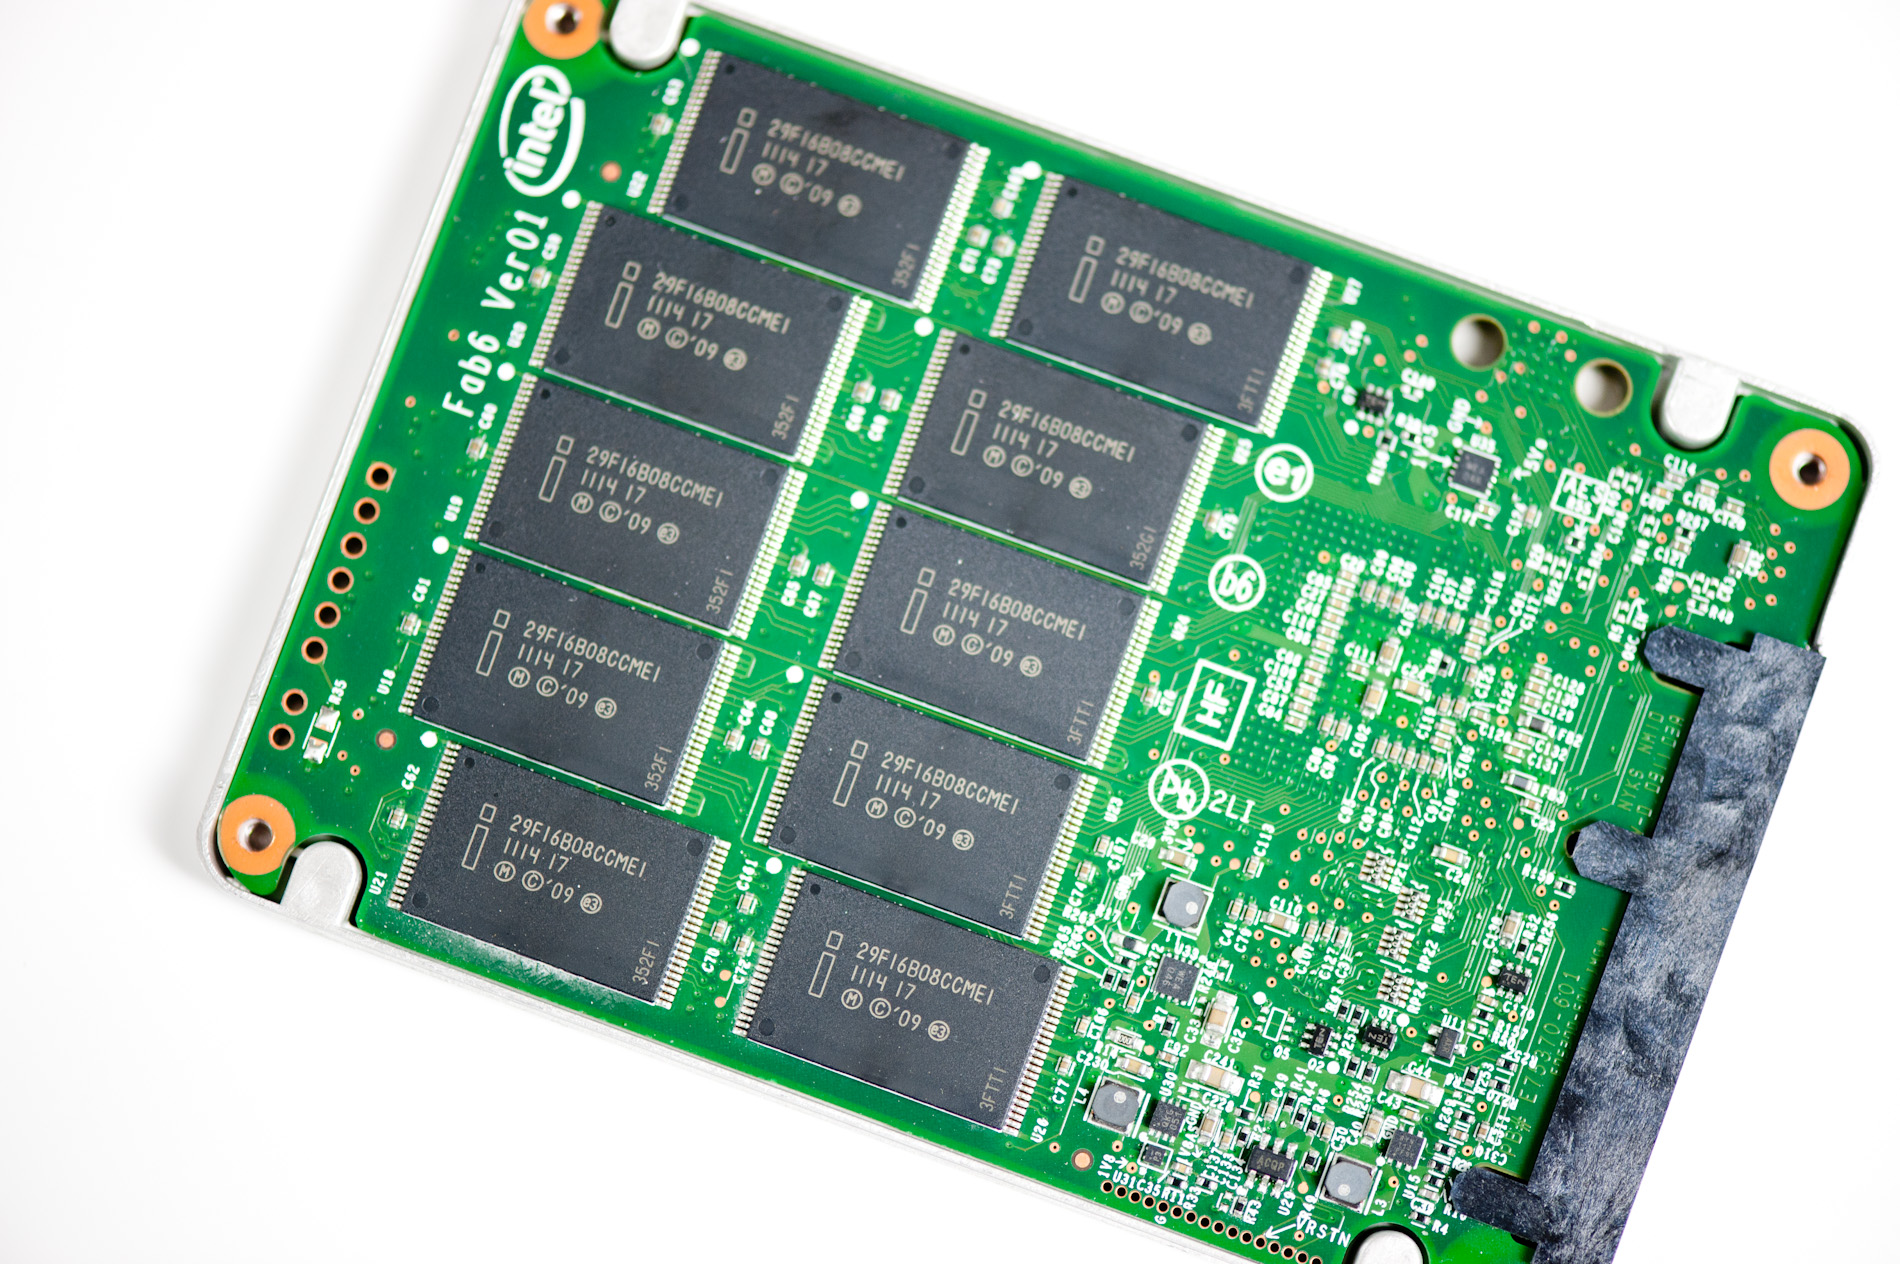
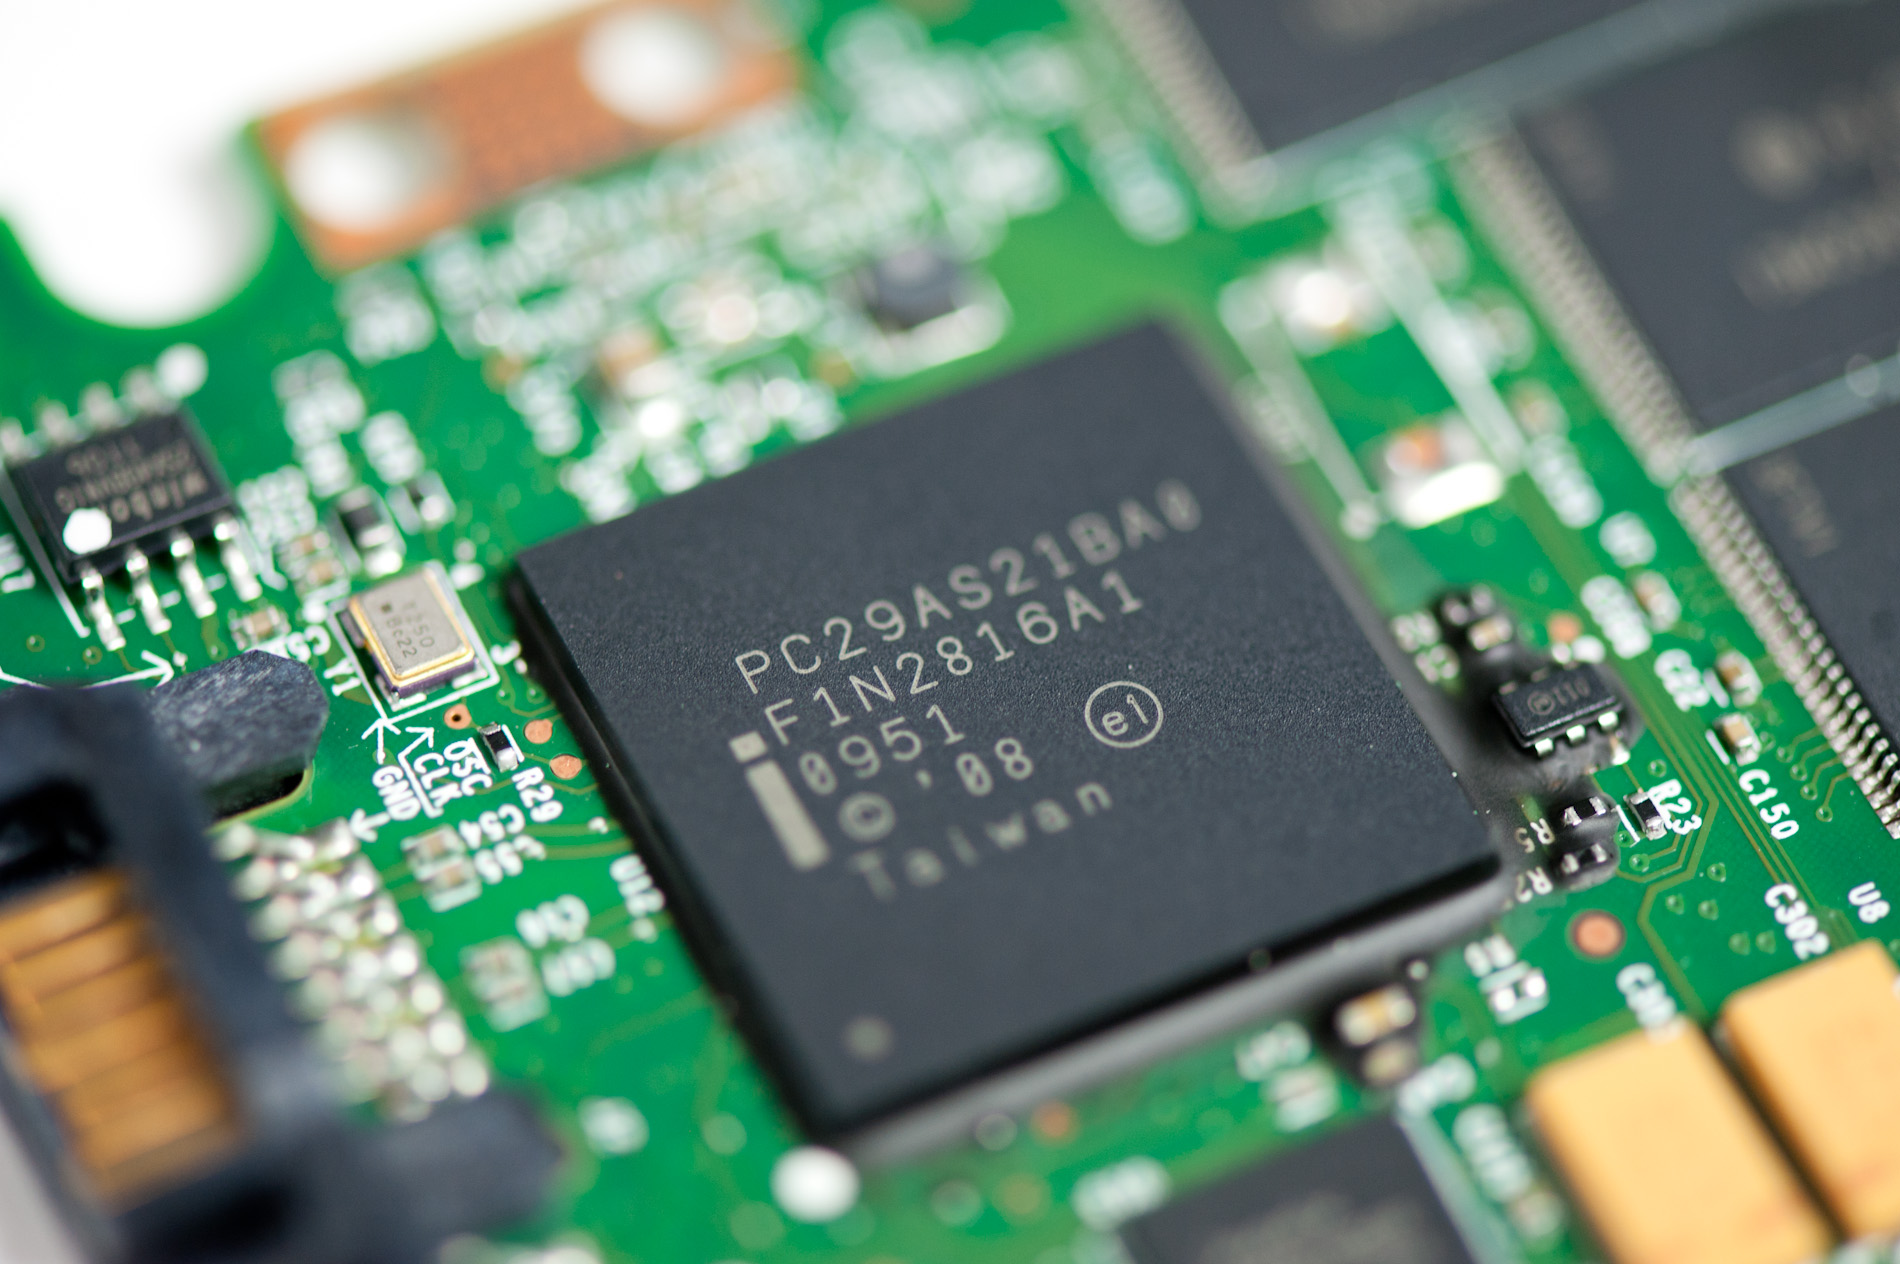
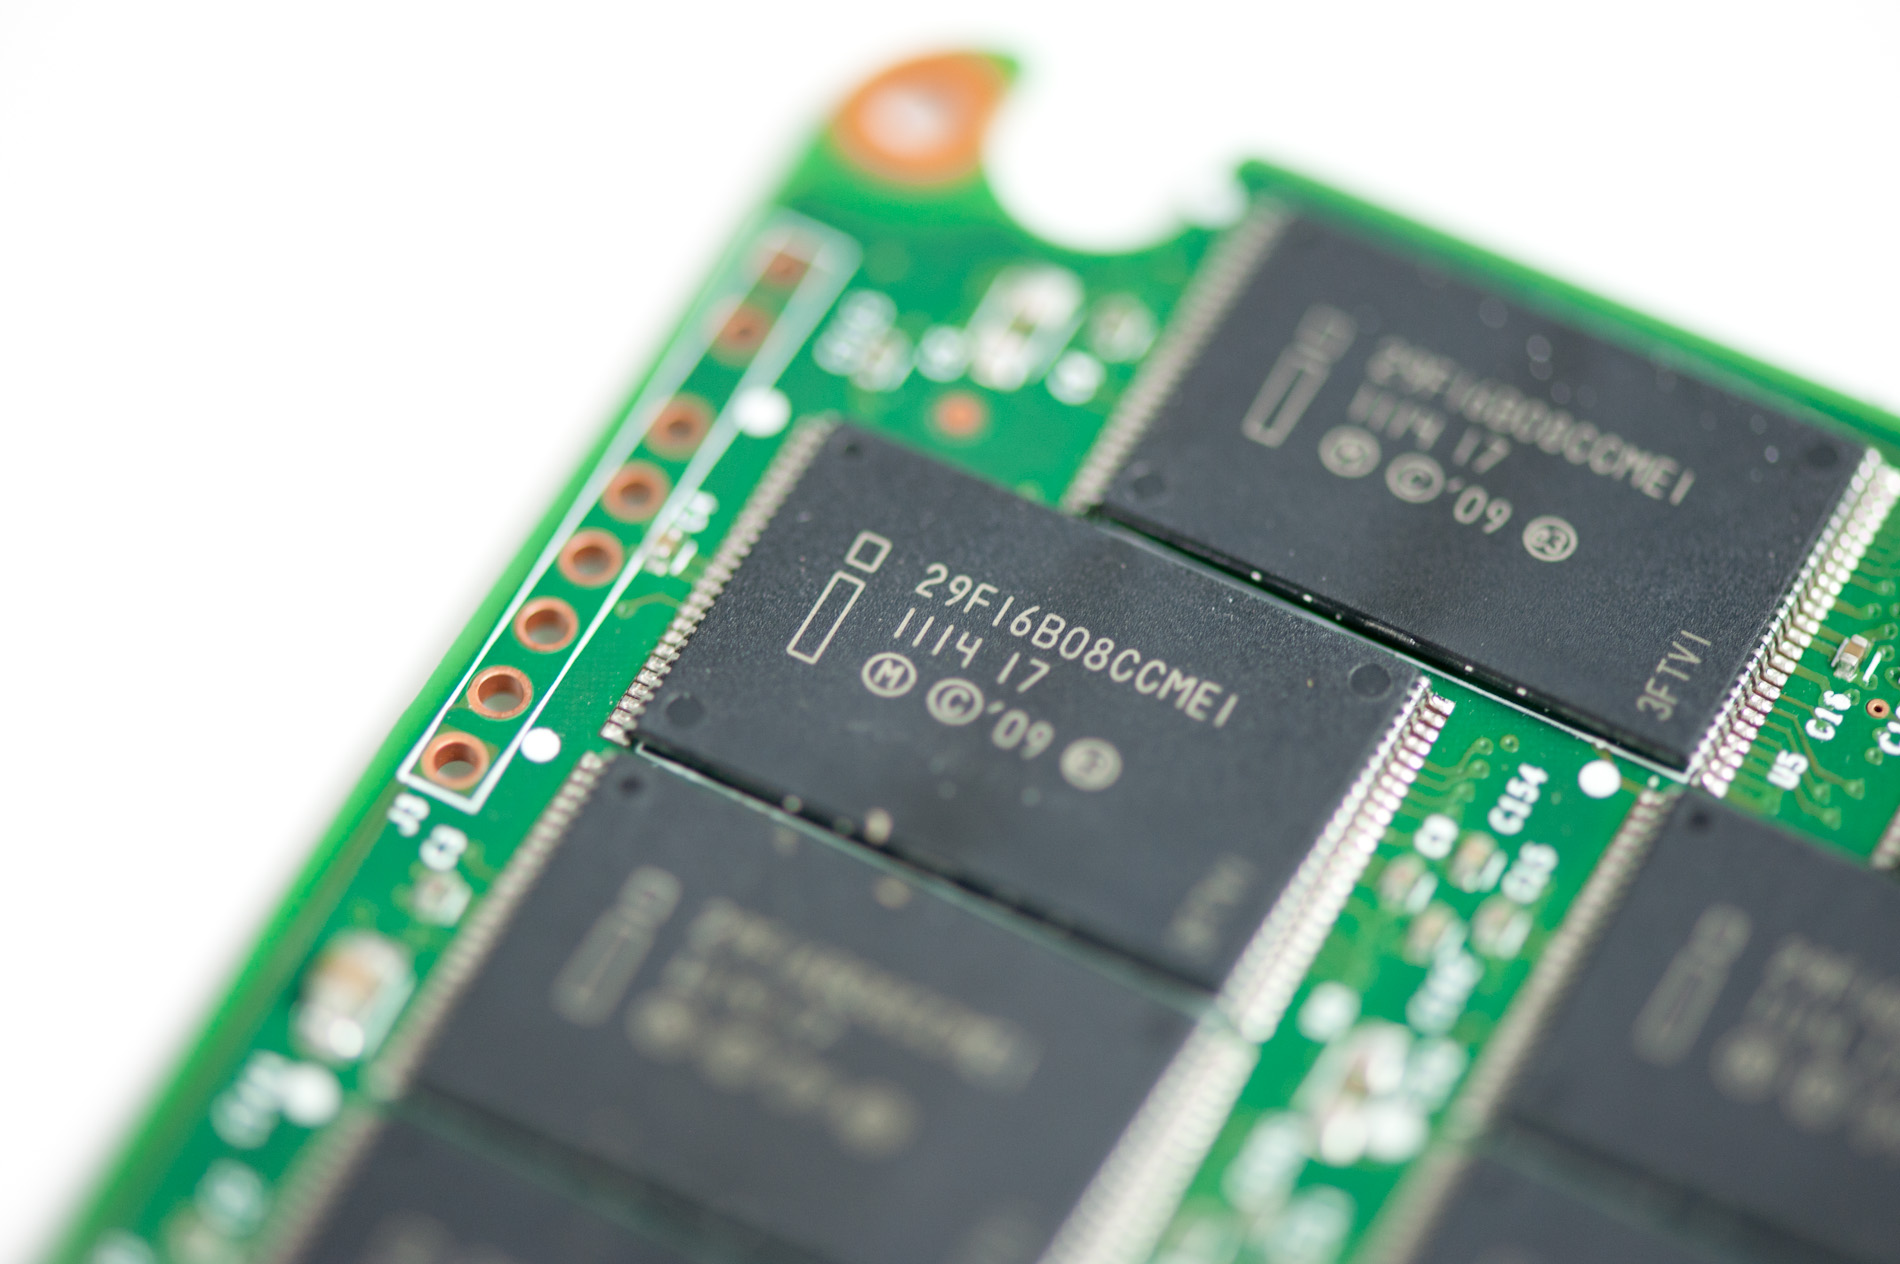
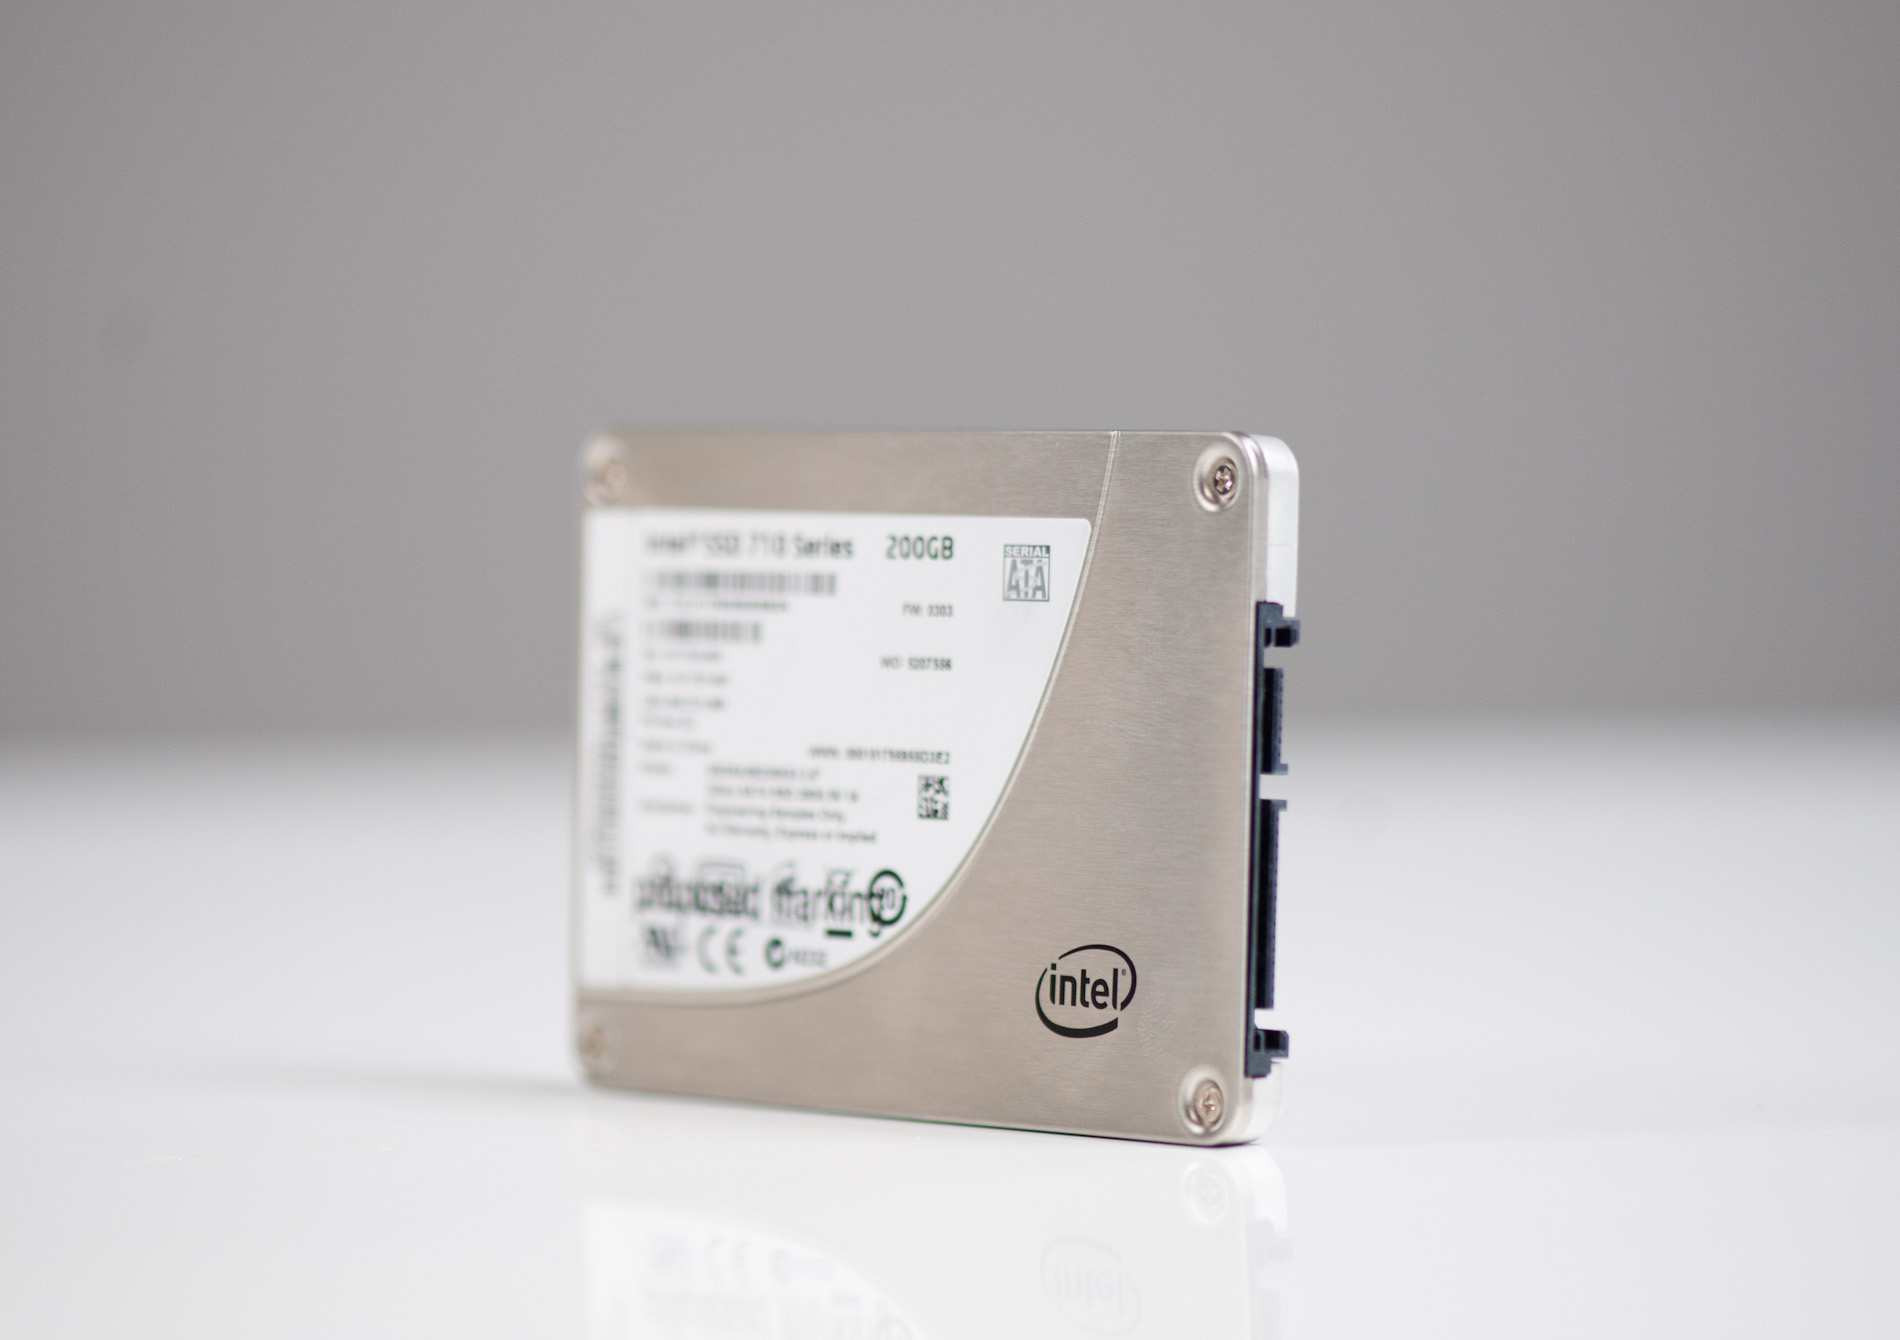
Opening up the 710 that Intel sent me I found a total of 20 NAND packages on-board. This isn't surprising as Intel's controllers have always supported 10 parallel NAND channels, in this case the 710 uses two packages per channel and interleaves requests to them. Each NAND package however has 128Gbit (16GBytes) of NAND inside in the form of 2 x 8GB 25nm MLC-HET die. Multiply all of that out and you get 320GB of NAND inside this 200GB drive.
Of course 200GB is defined as 200,000,000,000,000 bits, so actual binary storage capacity is 186.3GiB. This is absolutely insane: over 41% of the NAND on the 710's PCB is set aside as spare area. We have never reviewed an SSD with anywhere near this much spare area before.
If we run the p/e count with 320GB as the actual amount of NAND available, it works out to be just under 40K p/e cycles per cell. The significant spare area on the 710 increases the drive's projected lifespan by 55%! Intel even recommends setting aside another 20% of the drive if you need a longer lifespan. An extra 20% spare area will give you another 50% increase in total bytes written. Tinkering with spare area just helps reduce write amplification, it doesn't magically make the NAND cells last longer.
If we believe Intel's specifications, MLC-HET actually sounds pretty decent. You get endurance in the realm of the X25-E but at significantly lower cost and with more reasonable capacity options.
Thankfully we don't need to just take Intel's word, we can measure ourselves. For the past couple of years Intel has included a couple of counters in the SMART data of its SSDs. SMART attribute E2h gives you an accurate count of how much wear your current workload is putting on the drive's NAND. To measure all you need to do is reset the workload timer (E4h) and run your workload on the drive for at least 60 minutes. Afterwards, take the raw value in E2h, divide by 1024 and you get the percentage of wear your workload put on the drive's NAND. I used smartmontools to reset E4h before running a 60 minute loop of our SQL benchmarks on the drive, simulating about a day of our stats DB workload.
Once the workloads finished looping I measured 0.0145% wear on the drive for a day of our stats DB workload. That works out to be 5.3% of wear per year or around 18.9 years before the NAND is done for. I'd be able to find more storage in my pocket before the 710 died due to NAND wear running our stats DB.
For comparison I ran the same test on an Intel SSD 320 and ended up with a much shorter 4.6 year lifespan. Our stats DB does much more than just these two tasks however - chances are we'd see failure much sooner than 4.6 years on the 320. An even heavier workload would quickly favor the 710's MLC-HET NAND.
But what about performance? SLC write speeds are much higher than MLC, but Intel's MLC performance has come a long way since the old X25-E. Let's get to the benchmarks.
The Test
We're still building up our Enterprise Bench data so forgive the lack of comparison data here. We included a number of consumer drives simply as a reference point.
| CPU |
Intel Core i7 2600K running at 3.4GHz (Turbo & EIST Disabled) |
| Motherboard: |
Intel H67 Motherboard |
| Chipset: |
Intel H67 |
| Chipset Drivers: |
Intel 9.1.1.1015 + Intel RST 10.2 |
| Memory: | Qimonda DDR3-1333 4 x 1GB (7-7-7-20) |
| Video Card: | eVGA GeForce GTX 285 |
| Video Drivers: | NVIDIA ForceWare 190.38 64-bit |
| Desktop Resolution: | 1920 x 1200 |
| OS: | Windows 7 x64 |
Random Read/Write Speed
Random Read/Write Speed
The four corners of SSD performance are as follows: random read, random write, sequential read and sequential write speed. Random accesses are generally small in size, while sequential accesses tend to be larger and thus we have the four Iometer tests we use in all of our reviews.
Our first test writes 4KB in a completely random pattern over an 8GB space of the drive to simulate the sort of random access that you'd see on an OS drive (even this is more stressful than a normal desktop user would see). I perform three concurrent IOs and run the test for 3 minutes. The results reported are in average MB/s over the entire time. We use both standard pseudo randomly generated data for each write as well as fully random data to show you both the maximum and minimum performance offered by SandForce based drives in these tests. The average performance of SF drives will likely be somewhere in between the two values for each drive you see in the graphs. For an understanding of why this matters, read our original SandForce article.
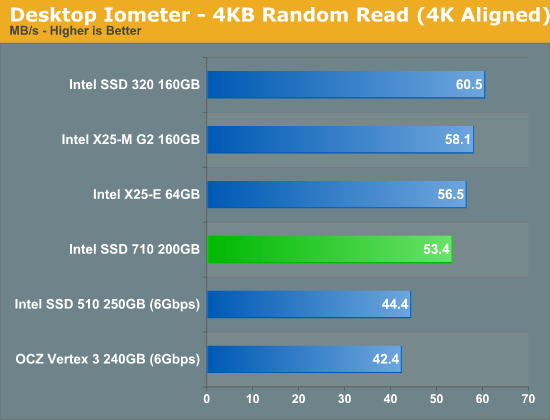
Random read performance is actually a bit behind the SSD 320 and old X25-M G2, but still within the same ballpark and comparable to the X25-E. Note that random read performance has always been a strong suite of Intel's, which is very important to many database workloads.
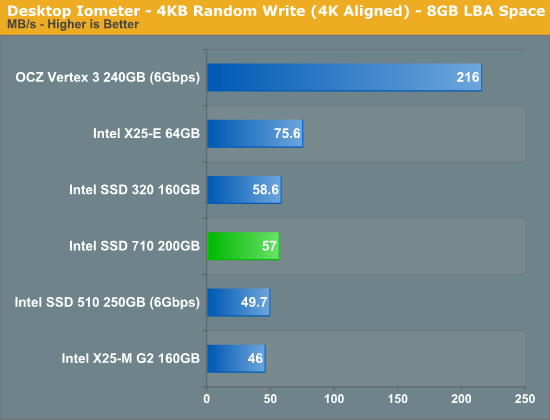
Random write performance is in the same ballpark as the other Intel MLC SSDs, however the X25-E is noticeably faster. SLC NAND is always easier to write to, and we see that advantage clearly here. Although the 710 does ok here, newer controllers from SandForce have raised the bar for highly compressible random write performance by a significant margin.
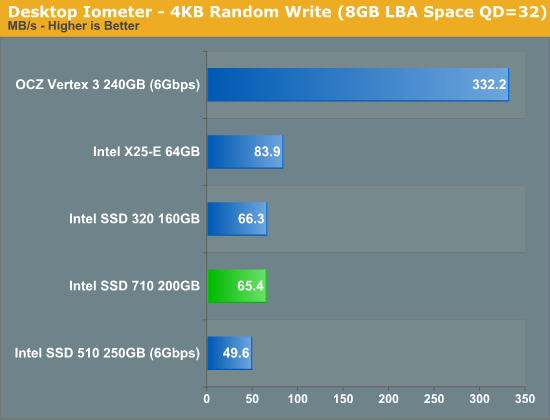
At high queue depths the X25-E is still significantly faster. Given the random nature of many enterprise server workloads, the 710 could end up slower than the X25-E.
Sequential Read/Write Speed
To measure sequential performance I ran a 1 minute long 128KB sequential test over the entire span of the drive at a queue depth of 1. The results reported are in average MB/s over the entire test length. These results are going to be the best indicator of large file copy performance.
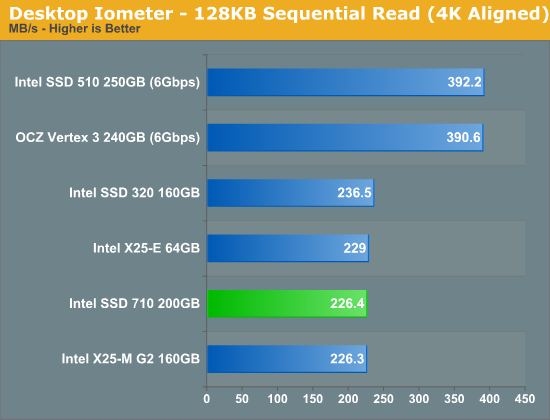
Sequential speed is also quite similar to other Intel drives. Note the slight drop in performance compared to the SSD 320. With the type of workloads the 710 is aimed at, I don't expect large file sequential performance to be a limiting factor. Once again we see that newer 6Gbps controllers from Marvell and SandForce offer much better performance here.
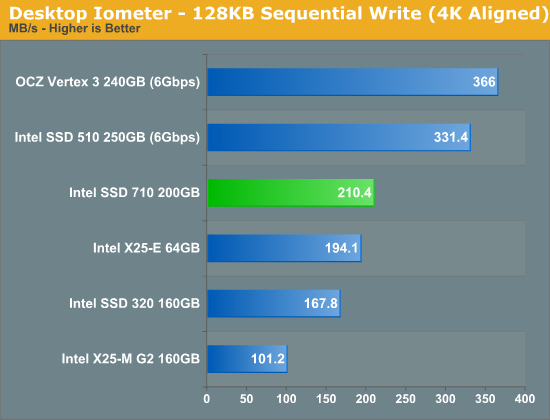
Sequential write performance is up quite a bit over the previous generation drives. The additional spare area is part of the story here, though the 6Gbps controllers still maintain their lead.
AS-SSD Incompressible Sequential Performance
The AS-SSD sequential benchmark uses incompressible data for all of its transfers. The result is a pretty big reduction in sequential write speed on SandForce based controllers.
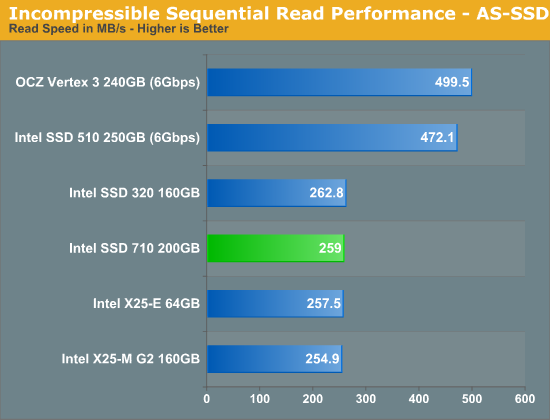
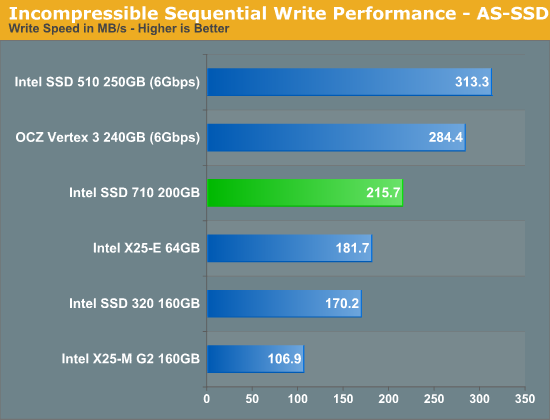
As a 3Gbps drive the 710 is pretty much limited by the SATA interface for the sequential read test. Sequential write speed is definitely improved over the X25-E, which may help narrow the performance gap in some enterprise workloads. Let's get to the real tests shall we?
Enterprise Storage Bench - Oracle Swingbench
We begin with a popular benchmark from our server reviews: the Oracle Swingbench. This is a pretty typical OLTP workload that focuses on servers with a light to medium workload of 100 - 150 concurrent users. The database size is fairly small at 10GB, however the workload is absolutely brutal.
Swingbench consists of over 1.28 million read IOs and 3.55 million writes. The read/write GB ratio is nearly 1:1 (bigger reads than writes). Parallelism in this workload comes through aggregating IOs as 88% of the operations in this benchmark are 8KB or smaller. This test is actually something we use in our CPU reviews so its queue depth averages only 1.33. We will be following up with a version that features a much higher queue depth in the coming weeks.
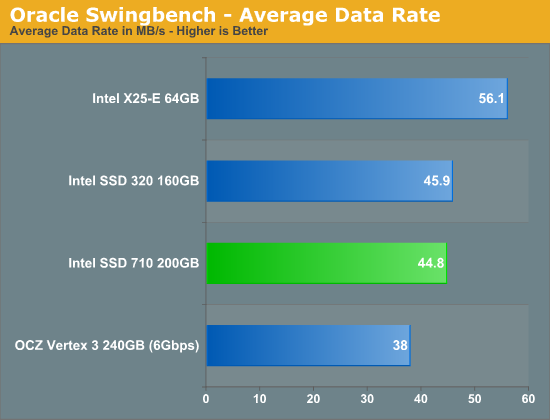
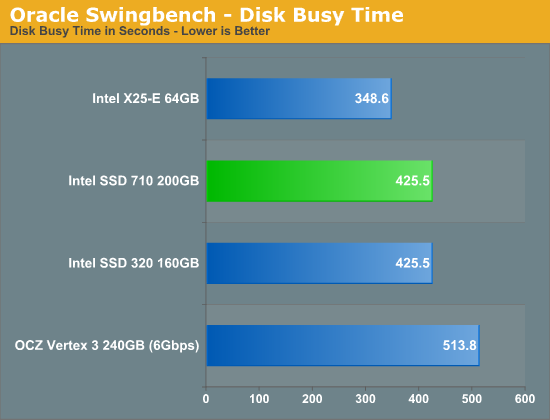
The X25-E offers 25% higher performance than the SSD 710 in our first enterprise benchmark. Here the 710 is actually about the same speed as the 320, which isn't surprising given the two drives share the same controller. The 710 obviously has the endurance advantage over the 320. Note that even SandForce's SF-2281 isn't able to outperform the 710 in our Swingbench test. As we discovered in our Z-Drive R4 review, average service time is a better indicator of heavy load performance than simply looking at average data rate in this benchmark:
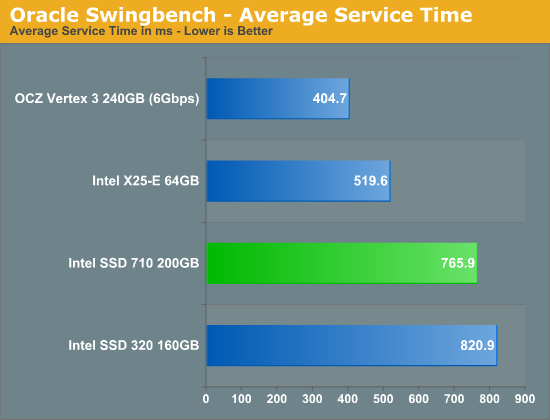
Here we see that the Vertex 3 manages to chew through IOs much quicker than the 710, despite lower overall throughput. SandForce's real-time data compression/dedupe likely plays a major role here. The 710 does pull ahead of the 320, likely due to firmware optimizations for server rather than client workloads. The X25-E continues to hold onto a significant performance advantage over the 710 thanks to its higher random write performance.
Enterprise Storage Bench - Microsoft SQL UpdateDailyStats
Our next two tests are taken from our own internal infrastructure. We do a lot of statistics tracking at AnandTech - we record traffic data to all articles as well as aggregate traffic for the entire site (including forums) on a daily basis. We also keep track of a running total of traffic for the month. Our first benchmark is a trace of the MS SQL process that does all of the daily and monthly stats processing for the site. We run this process once a day as it puts a fairly high load on our DB server. Then again, we don't have a beefy SSD array in there yet :)
The UpdateDailyStats procedure is mostly reads (3:1 ratio of GB reads to writes) with 431K read operations and 179K write ops. Average queue depth is 4.2 and only 34% of all IOs are issued at a queue depth of 1. The transfer size breakdown is as follows:
| AnandTech Enterprise Storage Bench MS SQL UpdateDaily Stats IO Breakdown | ||||
| IO Size | % of Total | |||
| 8KB | 21% | |||
| 64KB | 35% | |||
| 128KB | 35% | |||
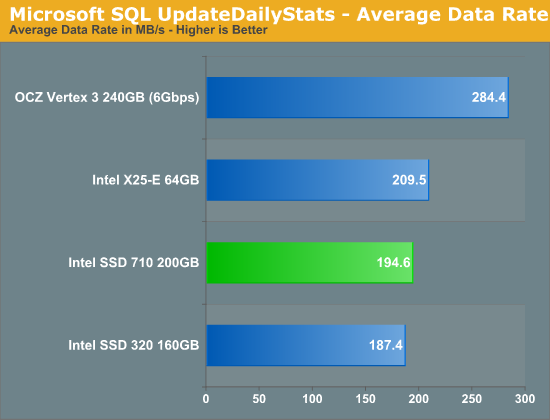
In the first of our two SQL tests the 710 and X25-E are far closer than they were in the Swingbench results. Although the 710 uses MLC-HET NAND, it delivers 93% of the performance of the X25-E. The SF-2281 based Vertex 3 pulls ahead, but this is obviously a consumer drive and not something I'd expect 710 customers to be cross shopping. An enterprise version of the Vertex 3 with a proven track record could be a very interesting option however.
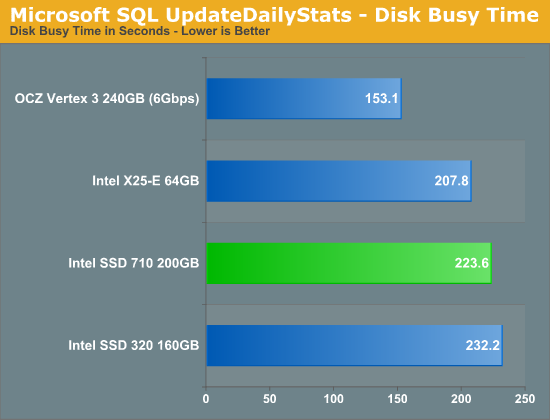
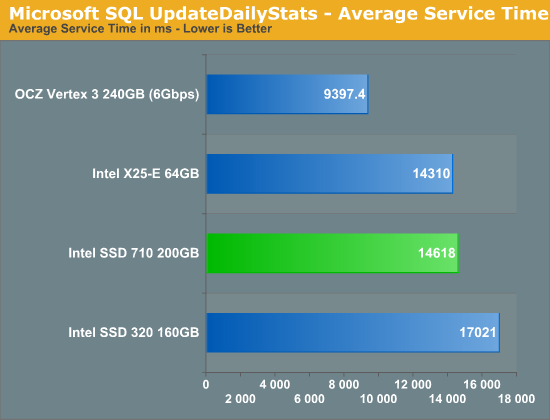
Despite relatively close average data rates, average service time is significantly improved over the desktop 320. Furthermore the 710 cranks through IOs at nearly the same latency as Intel's X25-E. Under heavy load, the X25-E and SSD 710 are virtually indestinguishable. Once again SandForce shows its strengths quite well here.
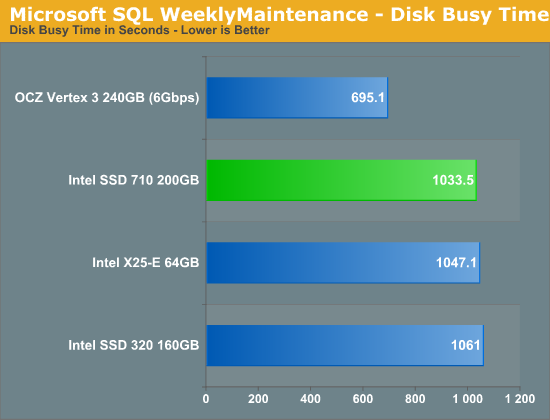
Enterprise Storage Bench - Microsoft SQL WeeklyMaintenance
Our final enterprise storage bench test once again comes from our own internal databases. We're looking at the stats DB again however this time we're running a trace of our Weekly Maintenance procedure. This procedure runs a consistency check on the 30GB database followed by a rebuild index on all tables to eliminate fragmentation. As its name implies, we run this procedure weekly against our stats DB.
The read:write ratio here remains around 3:1 but we're dealing with far more operations: approximately 1.8M reads and 1M writes. Average queue depth is up to 5.43.
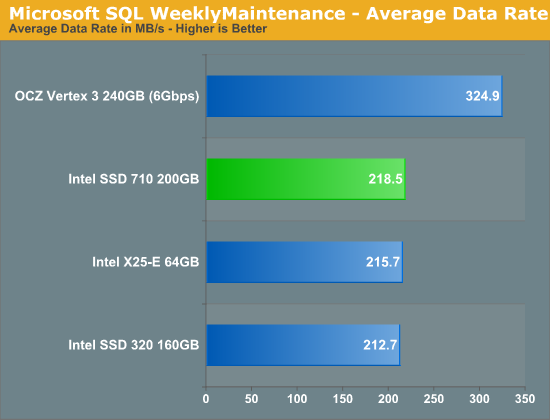
For our final enterprise test, the 710 actually manages to edge out the old X25-E. All three Intel drives appear to be bumping into the 3Gbps SATA barrier at this point though.
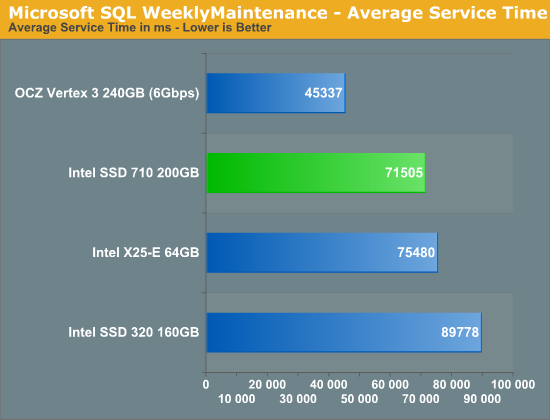
Average service times tell a story of firmware optimizations once more. Despite using the same controller, the 710 clearly does better than the 320 in enterprise workloads. Once again, under load, we see the 710 post better numbers than the X25-E (although the margin is small enough to be negligible). The SF-2281 continues to dominate.
AnandTech Storage Bench 2011
Last year we introduced our AnandTech Storage Bench, a suite of benchmarks that took traces of real OS/application usage and played them back in a repeatable manner. I assembled the traces myself out of frustration with the majority of what we have today in terms of SSD benchmarks.
Although the AnandTech Storage Bench tests did a good job of characterizing SSD performance, they weren't stressful enough. All of the tests performed less than 10GB of reads/writes and typically involved only 4GB of writes specifically. That's not even enough exceed the spare area on most SSDs. Most canned SSD benchmarks don't even come close to writing a single gigabyte of data, but that doesn't mean that simply writing 4GB is acceptable.
Originally I kept the benchmarks short enough that they wouldn't be a burden to run (~30 minutes) but long enough that they were representative of what a power user might do with their system.
Not too long ago I tweeted that I had created what I referred to as the Mother of All SSD Benchmarks (MOASB). Rather than only writing 4GB of data to the drive, this benchmark writes 106.32GB. It's the load you'd put on a drive after nearly two weeks of constant usage. And it takes a *long* time to run.
1) The MOASB, officially called AnandTech Storage Bench 2011 - Heavy Workload, mainly focuses on the times when your I/O activity is the highest. There is a lot of downloading and application installing that happens during the course of this test. My thinking was that it's during application installs, file copies, downloading and multitasking with all of this that you can really notice performance differences between drives.
2) I tried to cover as many bases as possible with the software I incorporated into this test. There's a lot of photo editing in Photoshop, HTML editing in Dreamweaver, web browsing, game playing/level loading (Starcraft II & WoW are both a part of the test) as well as general use stuff (application installing, virus scanning). I included a large amount of email downloading, document creation and editing as well. To top it all off I even use Visual Studio 2008 to build Chromium during the test.
The test has 2,168,893 read operations and 1,783,447 write operations. The IO breakdown is as follows:
| AnandTech Storage Bench 2011 - Heavy Workload IO Breakdown | ||||
| IO Size | % of Total | |||
| 4KB | 28% | |||
| 16KB | 10% | |||
| 32KB | 10% | |||
| 64KB | 4% | |||
Only 42% of all operations are sequential, the rest range from pseudo to fully random (with most falling in the pseudo-random category). Average queue depth is 4.625 IOs, with 59% of operations taking place in an IO queue of 1.
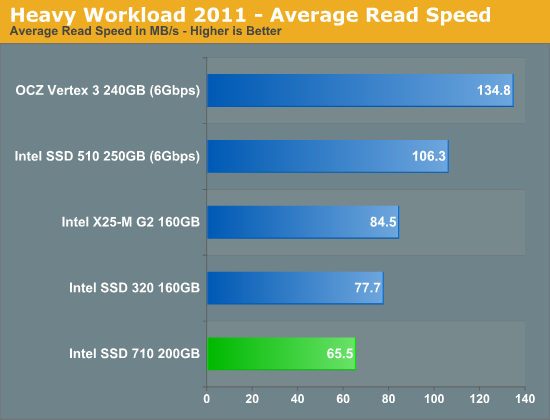
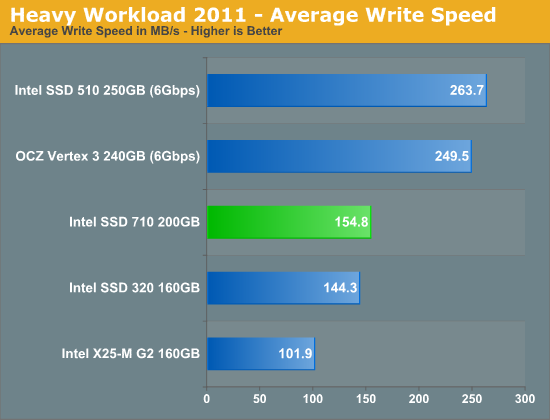
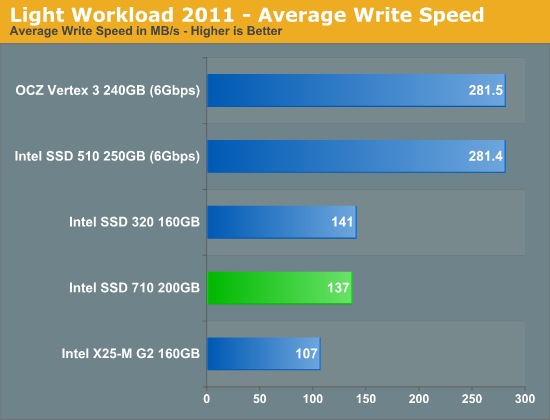
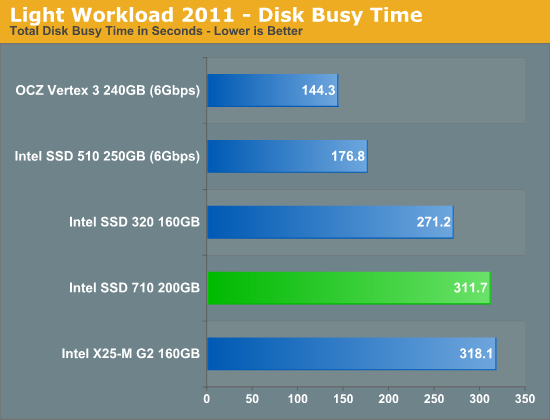
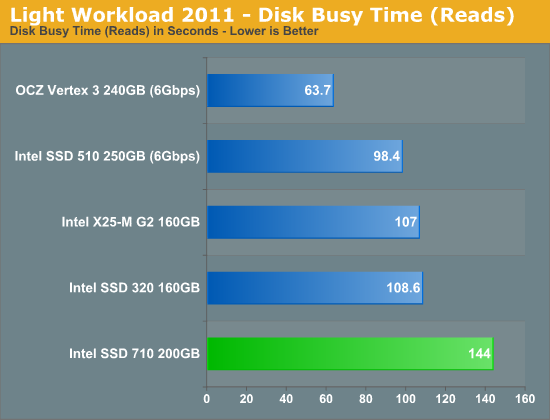
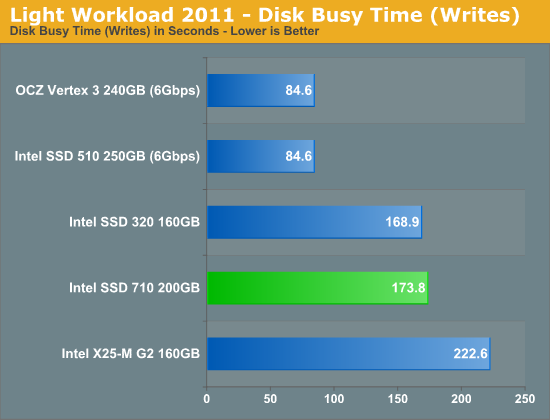
Many of you have asked for a better way to really characterize performance. Simply looking at IOPS doesn't really say much. As a result I'm going to be presenting Storage Bench 2011 data in a slightly different way. We'll have performance represented as Average MB/s, with higher numbers being better. At the same time I'll be reporting how long the SSD was busy while running this test. These disk busy graphs will show you exactly how much time was shaved off by using a faster drive vs. a slower one during the course of this test. Finally, I will also break out performance into reads, writes and combined. The reason I do this is to help balance out the fact that this test is unusually write intensive, which can often hide the benefits of a drive with good read performance.
There's also a new light workload for 2011. This is a far more reasonable, typical every day use case benchmark. Lots of web browsing, photo editing (but with a greater focus on photo consumption), video playback as well as some application installs and gaming. This test isn't nearly as write intensive as the MOASB but it's still multiple times more write intensive than what we were running last year.
As always I don't believe that these two benchmarks alone are enough to characterize the performance of a drive, but hopefully along with the rest of our tests they will help provide a better idea.
The testbed for Storage Bench 2011 has changed as well. We're now using a Sandy Bridge platform with full 6Gbps support for these tests. All of the older tests are still run on our X58 platform.
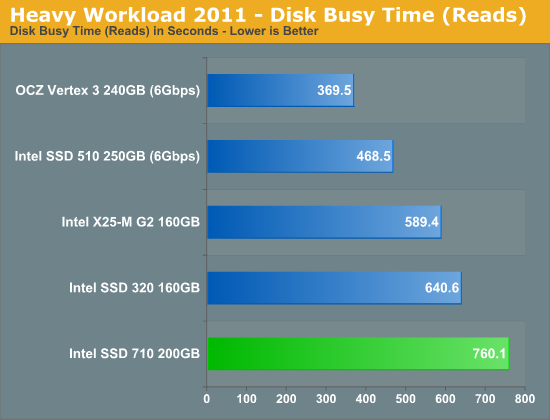
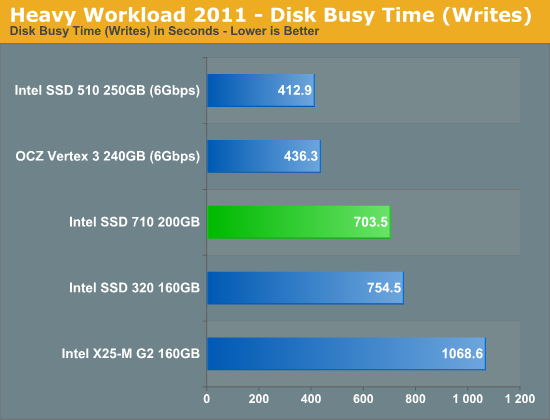
AnandTech Storage Bench 2011 - Heavy Workload
We'll start out by looking at average data rate throughout our new heavy workload test:
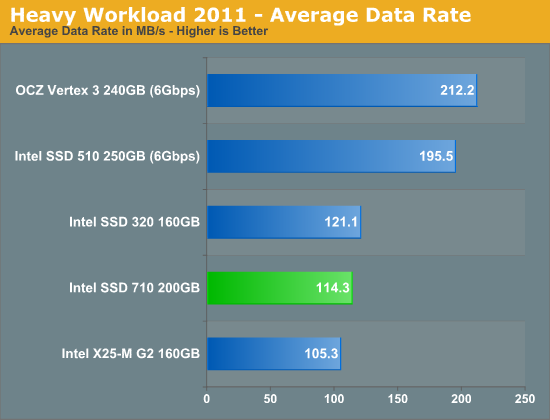
I threw in our standard desktop tests just to hammer home the point that the 710 simply shouldn't be used for client computing. Not only is MLC-HET overkill for client workloads, but the Intel SSD 320's firmware is better optimized for client computing.
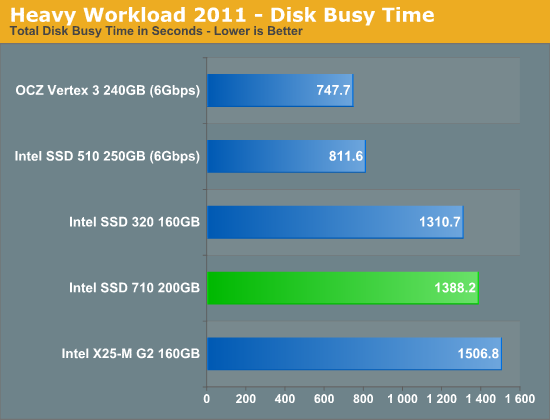
The next three charts just represent the same data, but in a different manner. Instead of looking at average data rate, we're looking at how long the disk was busy for during this entire test. Note that disk busy time excludes any and all idles, this is just how long the SSD was busy doing something:
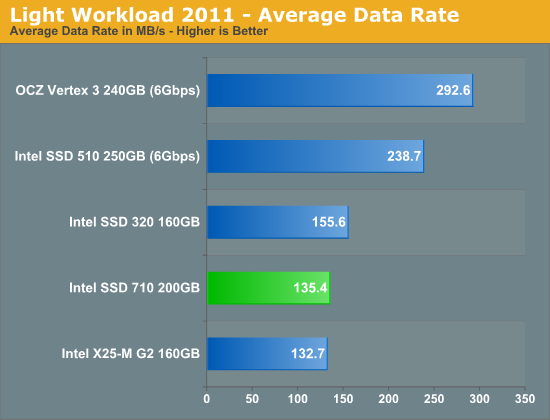
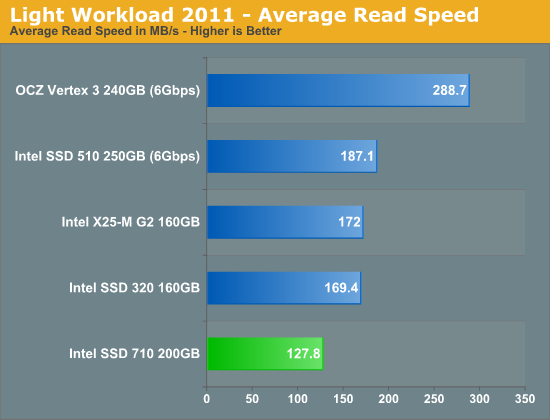
AnandTech Storage Bench 2011 - Light Workload
Our new light workload actually has more write operations than read operations. The split is as follows: 372,630 reads and 459,709 writes. The relatively close read/write ratio does better mimic a typical light workload (although even lighter workloads would be far more read centric).
The I/O breakdown is similar to the heavy workload at small IOs, however you'll notice that there are far fewer large IO transfers:
| AnandTech Storage Bench 2011 - Light Workload IO Breakdown | ||||
| IO Size | % of Total | |||
| 4KB | 27% | |||
| 16KB | 8% | |||
| 32KB | 6% | |||
| 64KB | 5% | |||
Despite the reduction in large IOs, over 60% of all operations are perfectly sequential. Average queue depth is a lighter 2.2029 IOs.
Power Consumption
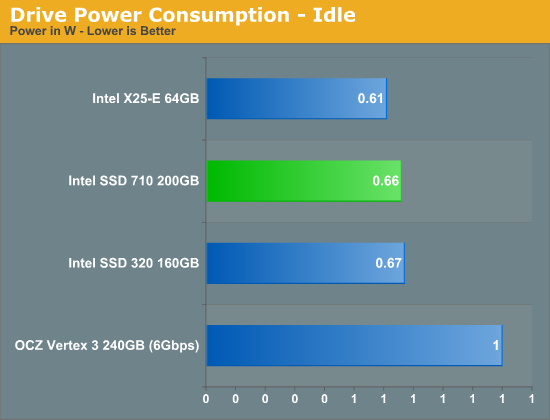
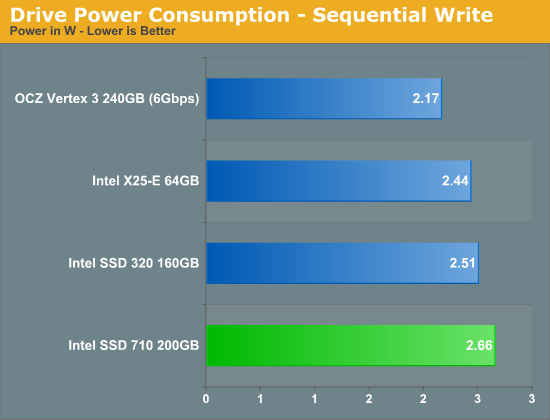
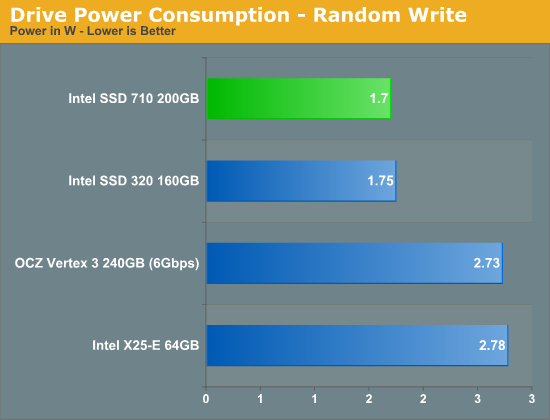
Although both idle and sequential IO power figures are up compared to the X25-E, random write power is down considerably. The 710 is able to pull less power under heavy random writes partially due to its lower performance, but it also looks like the drive as a whole simply draws less power. For a single drive that's not such a big deal but when you think about installing dozens if not hundreds of these in a server farm, the savings quickly add up. Lower power consumption in heavy random write workloads should deliver tangible savings given the target market of this drive.
Final Words
When I first ran through the performance data of the 710 I came away disappointed. As a desktop user the 710 offers lower performance than the Intel SSD 320 at a significantly higher price. Thankfully, Intel's focus for this drive is on the enterprise market and here the 710 does a lot better. Our SQL tests showed the 710 offering similar performance to the outgoing X25-E. It was in our Oracle OLTP benchmark that the older SLC drive was able to offer a 25% increase in throughput over the new MLC-HET solution. No matter how you look at it, small file random write performance is just tough to beat on SLC NAND. I suspect for many enterprise workloads however, the 710 could be a drop-in replacement for the X25-E. In the cases where it isn't as fast, the margins are significant but overcomable by upping the number of drives in the RAID array. This isn't the ideal solution but the cost savings alone (compared to the X25-E) should make the move to the 710 worth it. If you don't need additional capacity however and are running a write intensive OLTP workload, the 710 will likely do nothing for you.
Intel's SSD 710 appears to be targeted squarely at existing X25-E customers or companies who needed the endurance of the X25-E but at larger capacities. In fact we have a number of X25-Es deployed in our servers that I wouldn't mind moving to 710s simply because of the capacity increase. Most of our servers don't need a ton of space, but with DB sizes in the hundreds of GBs even a large array of 64GB drives doesn't give you all that much space for growth (especially if you're replicating data across SSDs for redundancy). For these uses, the 710 appears to be a success.
The big question for enterprise customers is whether or not you need the additional cycling offered by the 710. To know for sure you'll really have to do a lot of profiling of your own workload. I suspect Intel's SSD 320 would do just fine in a number of situations, particularly if you significantly increase the spare area on the drive (e.g. to 50%).
Where the 710 leaves me wanting more is that it doesn't actually move the performance bar up at all. At best Intel is able to deliver the same performance it did nearly three years ago with the X25-E. While it is true that customers moving from spindles to SSDs will likely be just fine with the 710's level of performance, I would like to see more. To date Intel hasn't delivered a 6Gbps SATA SSD based on its own controller. I suspect that's a big part of why we're not seeing better performance out of the 710. Intel is likely unwilling to try a third party controller in the enterprise space (can't blame them) so instead we get the 710: a decent performer with Intel's reputation for reliability. Should SandForce be able to convince customers that its solutions are just as reliable however, Intel could have a real problem in the enterprise space.


