Original Link: https://www.anandtech.com/show/8864/amd-fx-8320e-cpu-review-the-other-95w-vishera
AMD FX-8320E CPU Review: The Other 95W Vishera
by Ian Cutress on January 13, 2015 10:00 AM EST
Back in September we reviewed the FX-8370E, a new AMD CPU based on the older Vishera/Piledriver architecture but at a lower power – 95W rather than 125W. This was achieved by a combination of a mature 32nm process, adjusting clock speeds and (potentially) some specifically binned voltage characteristics. The FX-8320E was the other lower power CPU launched that day, which AMD has now been supplying for reviews.
The Information
Part of the world yearns for a new high performance processor from AMD to tackle the market. While Team Blue’s tick-tock model accounts for some of their aggressive product development, the limited success of the Bulldozer architecture put AMD on the back foot. In principle the basic design was a good idea, but the ecosystem to support it was not ready and it was almost left behind by those that focused on the platform metrics already at hand. I say almost, because AMD repositioned their high end product stack based on price to aim to compete on performance, albeit focused on the more mid-range but higher volume market segments, and AMD has not made a new high-end processor based on a new architecture in over two years.
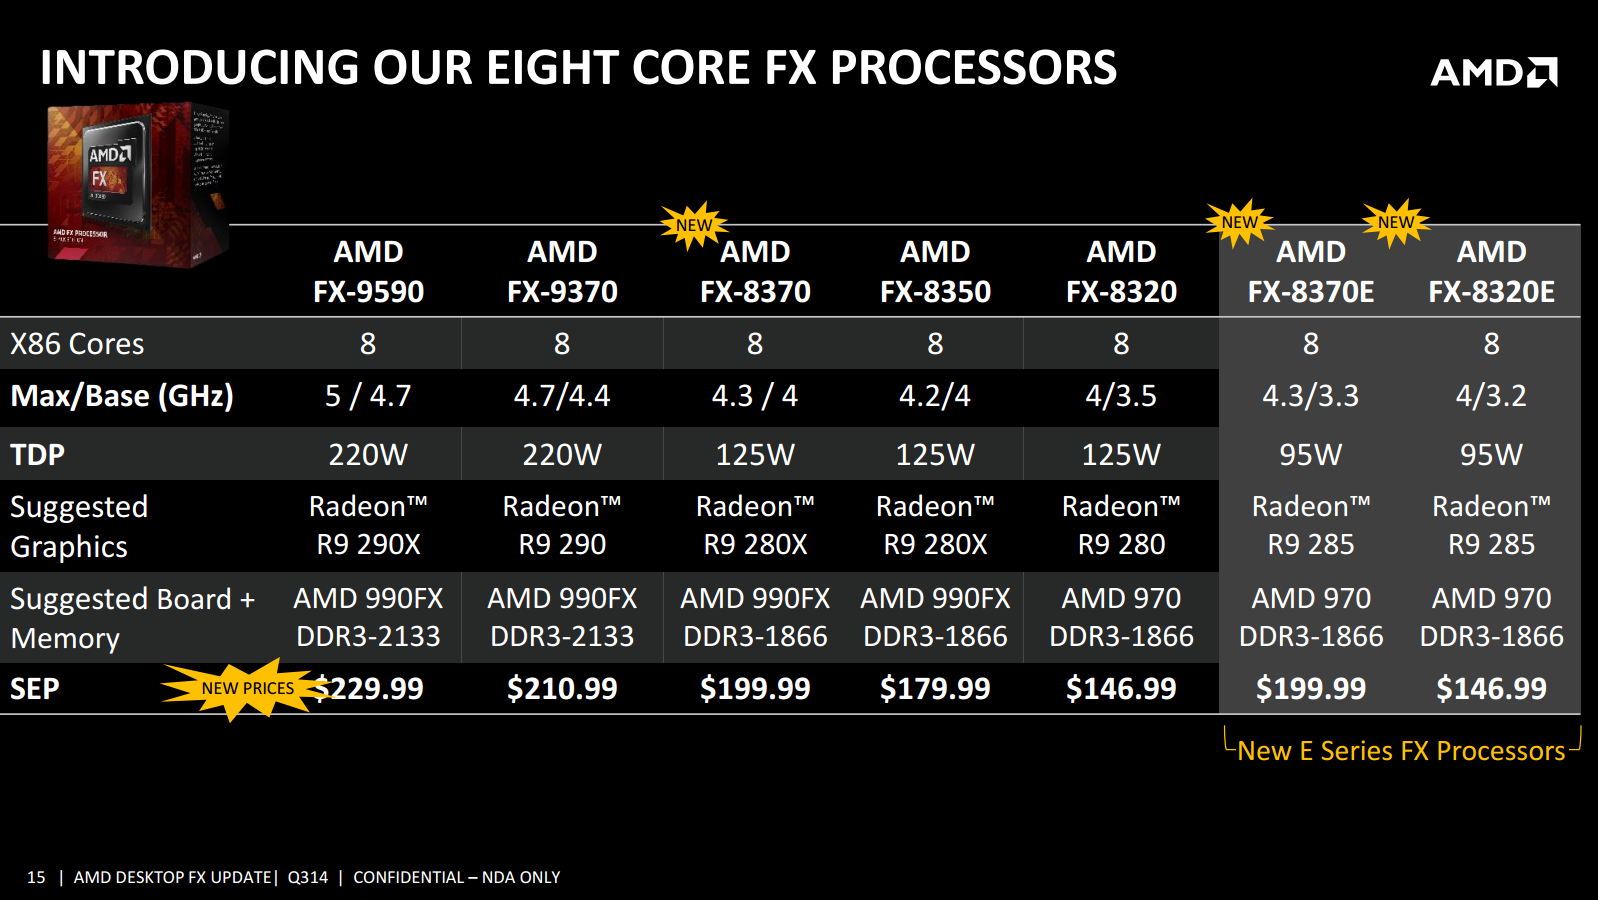
This Vishera platform is based on the Bulldozer-based Piledriver architecture and the 32nm process, but has still produced a number of new models since first launch, including the 220W FX-9000 series coming to retail earlier in 2014 (read our review of the FX-9590 here) and a set of new processors in September 2014. This included the 125W FX-8370, positioned at the top of the FX-8000 range with clock speed increases, and the 95W ‘E’ processors, the FX-8370E and FX-8320E.
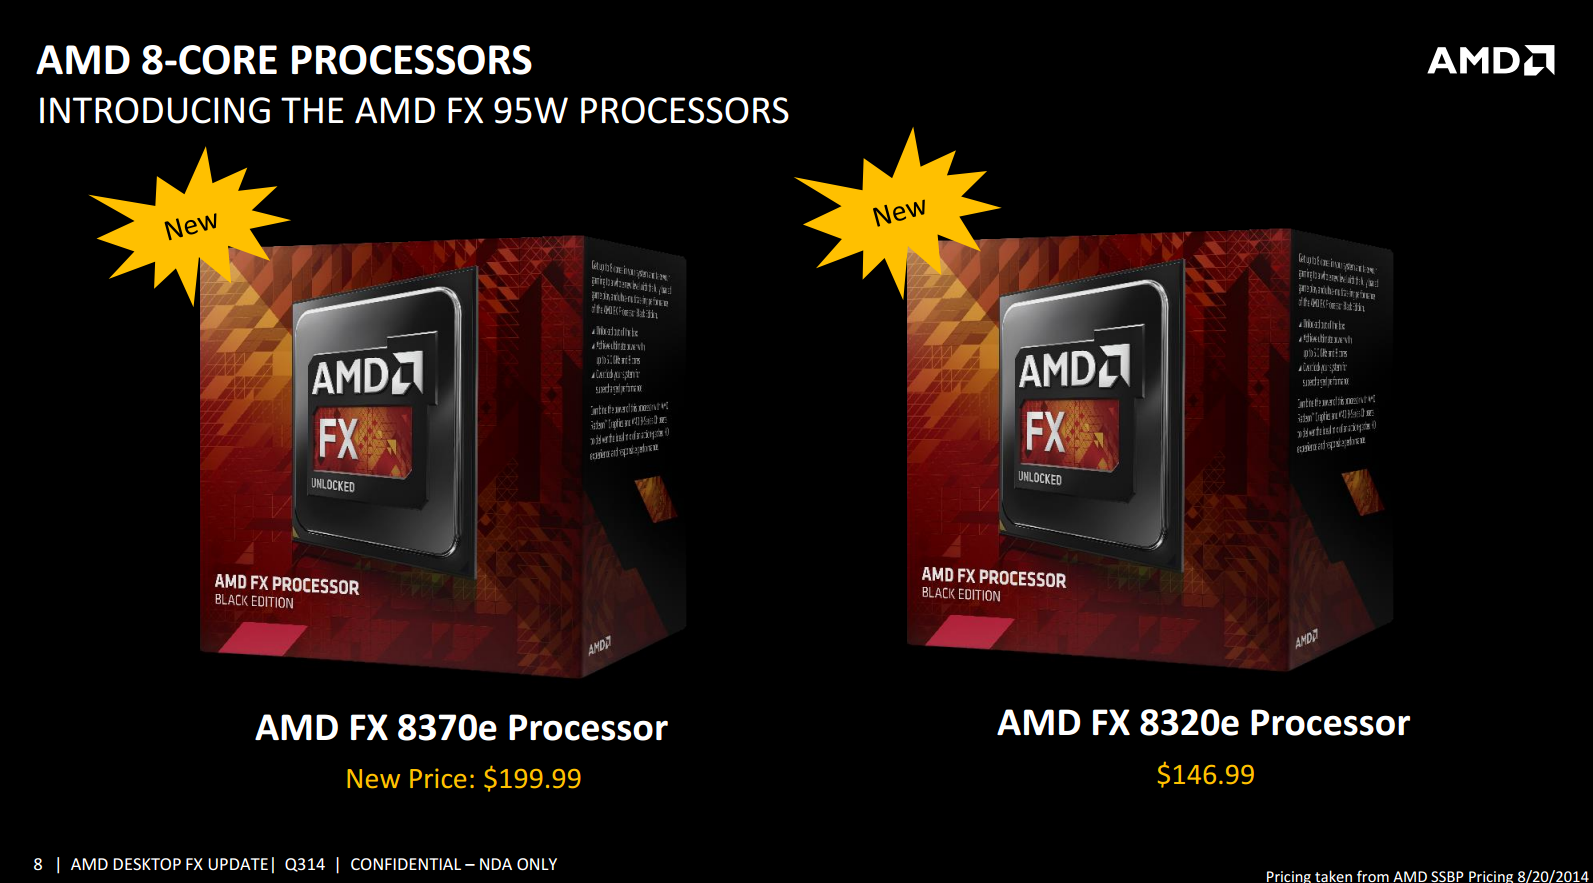
These processors are similar to their non-E counterparts, the FX-8370 and FX-8320, but with a lower base frequency but the same turbo frequency. This means, in theory, they should be as quick and responsive for most day-to-day tasks as their 125W brethren, but a bit behind when it comes to the hardcore processor mechanics. While priced the same as the 125W parts, AMD is hoping that the rated TDP reduction will entice users who might not need the full power all the time.
Due to the adjustment of TDP, these processors are also more aimed at the 970 chipset. This is a chipset that uses fewer GPU lanes (one PCIe 2.0 x16 slot, one PCIe 2.0 x4 slot) and is slightly cheaper than the 990FX range. Typically the newer 990FX boards are designed to take the large 220W behemoths from the FX-9000 list, but by using a 970 the motherboard makers can focus on 125W max and hopefully save the customer some money. As a result of this target, AMD also sampled the (anecdotally) most popular 970 board, the MSI 970 Gaming, which we have prepared for a separate review.
With the FX-8320E, it is worth noting that the base frequency is only 300 MHz less than the full-fat CPU. Saving 30W for 300 MHz is usually a good idea for most users, as it usually indicates a better binned CPU. 30W for 300 MHz for overclocking might be par for the course, which means that the FX-8320E might have overclocking potential. On the overclocking front, the FX-8320E is ready to be overclocked with an unlocked multiplier, and we have some interesting results later in the review.
Because the following question comes up repeatedly when coming across the latest in the FX line, I will copy the answer verbatim from our previous FX-8370E review:
“Why update the FX line with more Vishera based processors? Can’t we get an update?
AMD’s reasoning for these new processors, apart from the slowly increasing yields of the higher bin parts over the past year and tweaking the overall design, is because of the motherboards available on the market. Due to the construction of some of the early motherboards intended for AMD’s non-IGP line, these early motherboards could only support 95W or 125W maximum, let alone the 220W of the FX9590/9370 behemoths. By releasing an 8-thread Vishera processor with a 95W TDP, this allows these users to upgrade without spending an extra $120$200 on a new motherboard.”
With regards the old roadmap from AMD, it still looks bleak when we consider the FX CPUs. There is no named successor to Vishera, not even on the 28nm process used for the latest Kaveri APUs:

With the Excavator branded APUs due out at some point in the future, part of me hopes that AMD will release something on the FX line kin to that, but it might have the same issue as the Piledriver/Vishera units in the sense that power consumption spirals upward moving beyond 3.5 GHz without severe binning. The 28nm process was designed more for transistor density, especially when we consider the size of the integrated graphics AMD likes to use on the APUs, so there is debate from AMD's side that if a new FX release would offer much on the CPU side, except higher costs.
AMD stated for our FX-8370E review that ‘The AMD of today is funding the AMD of tomorrow … to ensure the ongoing success of products like FX’. Products like FX. It doesn’t give me hope. With AMD’s Jim Keller being the driving force behind Zen, the pin-compatible x86/ARM processors scheduled for 2016 and as noted in a round table talk, ‘scaling from tablet to desktop’, this is the barrier on the horizon that will focus AMD. But for now, we have 95W Vishera to play with, and our sample was a beast.
The CPU, The Chipset and The DRAM
Straight up, 32nm is up against the wall. Intel is on 14nm, recently releasing both Broadwell-Y (Core M) and Broadwell-U, with the latter up to 28W. This represents Intel’s second generation FinFET technology, and if we recall 32nm was back with Sandy Bridge. That being said, the longer you spend on a process node, the more optimized it can be made and the yields improved. One could argue that this reduces running costs, allowing AMD to get product into the market. The question still remains if it is the right product.
| AMD 900 Series Chipset Comparison | |||
| 990FX | 990X | 970 | |
| Code Name | RD990 | RD980 | RX980 |
| Released | Q2 2011 | Q2 2011 | Q2 2011 |
| Fab (nm) | 65 | 65 | 65 |
| IGP | No | No | No |
| CrossFire | x16 + x16 x8 + x8 + x8 + x8 |
x8 + x8 | x16 + x4 |
| SLI | x16 + x16 x16 + x8 + x8 x8 + x8 + x8 + x8 |
x8 + x8 | No |
| TDP | 19.6W | 14W | 13.6W |
| PCIe | Four PCIe 2.0 slots | Two PCIe 2.0 slots | One PCIe 2.0 x16 slot |
| HyperTransport (MHz) | 2600 | 2600 | 2400 |
From the chipset perspective, AM3+ motherboards come in with either 990FX, 990X or 970 and a choice of two 900 series south bridges. The most common and talked about by far is the 990FX+SB950 combination offering two PCIe 2.0 x16 slots for both CrossFire and SLI, and if you want to splash the cash there are a couple of PLX8747 enabled motherboards that use inter-GPU PCIe 3.0 communication and afford more than two-way setups. However, no matter which way the segment is sliced, there are relatively few new motherboards on the market. Almost all are at least twelve months old, with a select few more recent. We recently reviewed the ASRock 990FX Extreme9 which sits at the top of ASRock’s product stack, but they also released a 990FX Killer with an M.2 SATA slot. ASUS had the 990FX Sabertooth PCIe 3.0 model, or the ROG Crosshair V Formula-Z both at the top of the ranges. MSI’s 970 Gaming has been the talk of the town in recent months, offering a poignant target from them. GIGABYTE has not released a 990FX or 970 Sniper yet, although if the market wants it be sure to let them know.
On a functionality front, the 900 series chipsets suffer from a lack of native USB 3.0, requiring controllers to implement this which can be slower than a native solution. For example the MSI 970 Gaming uses two VLI controllers to give a total of 4 USB 3.0 ports, although the performance is not the best. This typically also adds cost of the controllers to the product, which is something to avoid on a bargain model. On the plus side AMD does have six native SATA 6 Gbps ports, all suitable for RAID.
This Review
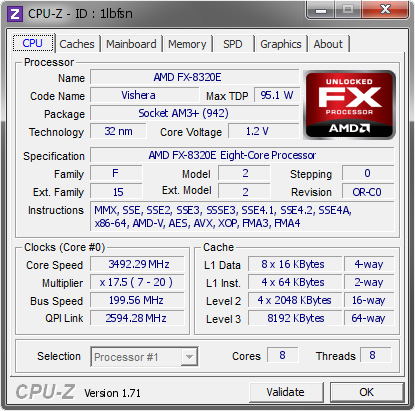
So the part in play for this review is the 95W AMD FX-8320E, a quad module/eight thread part with a 3.2 GHz base clock and a 4 GHz turbo mode. Priced at $147 when launched but now available for $150, the main competition from Intel resides from the Core i3-4350 (54W, 2C/4T) at $145 of the Core i3-4370 (54W, 2C/4T) at $160. The data points we have most relevant to this at the time of writing are the FX-8150, FX-8350, Core i3-4130T, Core i3-4330 and Core i3-4360, providing more than enough entertainment.

AMD FX-8320E Overclocking
Sometimes looking at CPU overclocking performance is not that relevant. Each CPU ends up being different, and the plural of anecdote is not ‘data’. At some point it might be useful to sample 100+ CPUs of the same type and gain a proper scientific distribution of overclocks, but even then a sample size of 100 is quite small. So our single point in the ether might not matter too much, but the end result this time around was more than interesting.
To put this into perspective, our recent CPU samples here at AnandTech have been bottom of the barrel for our 24/7 validation methods. Our current i7-5960X does 4.4 GHz on a good day, and our fall-back stock testing model only does 4.2 GHz. Similarly we had an i7-4770K that only did 4.1 GHz – that was particularly shocking. Our last true good overclocker was a Sandy Bridge i7-2600K that did 5.3 GHz with a little push but sat at 5.1 GHz comfortably. Since then, horse plop is a nice word to describe it. However, that changed with our FX-8320E sample when paired with our AM3+ CPU test bed, the 990FX Extreme9.
As the voltage was increased, the frequency increased. It kept going, and going, and going. The Nepton 140XL CPU liquid cooler from CoolerMaster kept the temperature low (when I remembered to plug the fan in), but on the other hand the power started to rise. Almost every bump in frequency required an adjustment in voltage, but the increases were small.
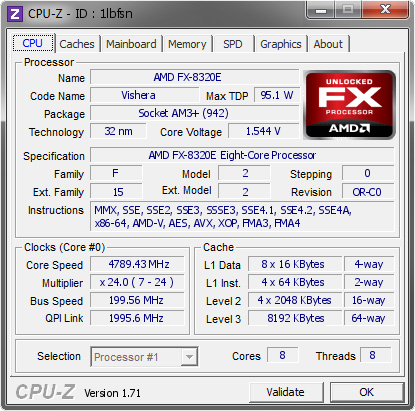
At the end of the day, we rose from a 3.2 GHz base frequency all the way up to 4.8 GHz, a +50% overclock.
Methodology
Our standard overclocking methodology is as follows. We select the automatic overclock options and test for stability with PovRay and OCCT to simulate high-end workloads. These stability tests aim to catch any immediate causes for memory or CPU errors.
For manual overclocks, based on the information gathered from previous testing, starts off at a nominal voltage and CPU multiplier, and the multiplier is increased until the stability tests are failed. The CPU voltage is increased gradually until the stability tests are passed, and the process repeated until the motherboard reduces the multiplier automatically (due to safety protocol) or the CPU temperature reaches a stupidly high level (100ºC+). Our test bed is not in a case, which should push overclocks higher with fresher (cooler) air.
Overclock Results
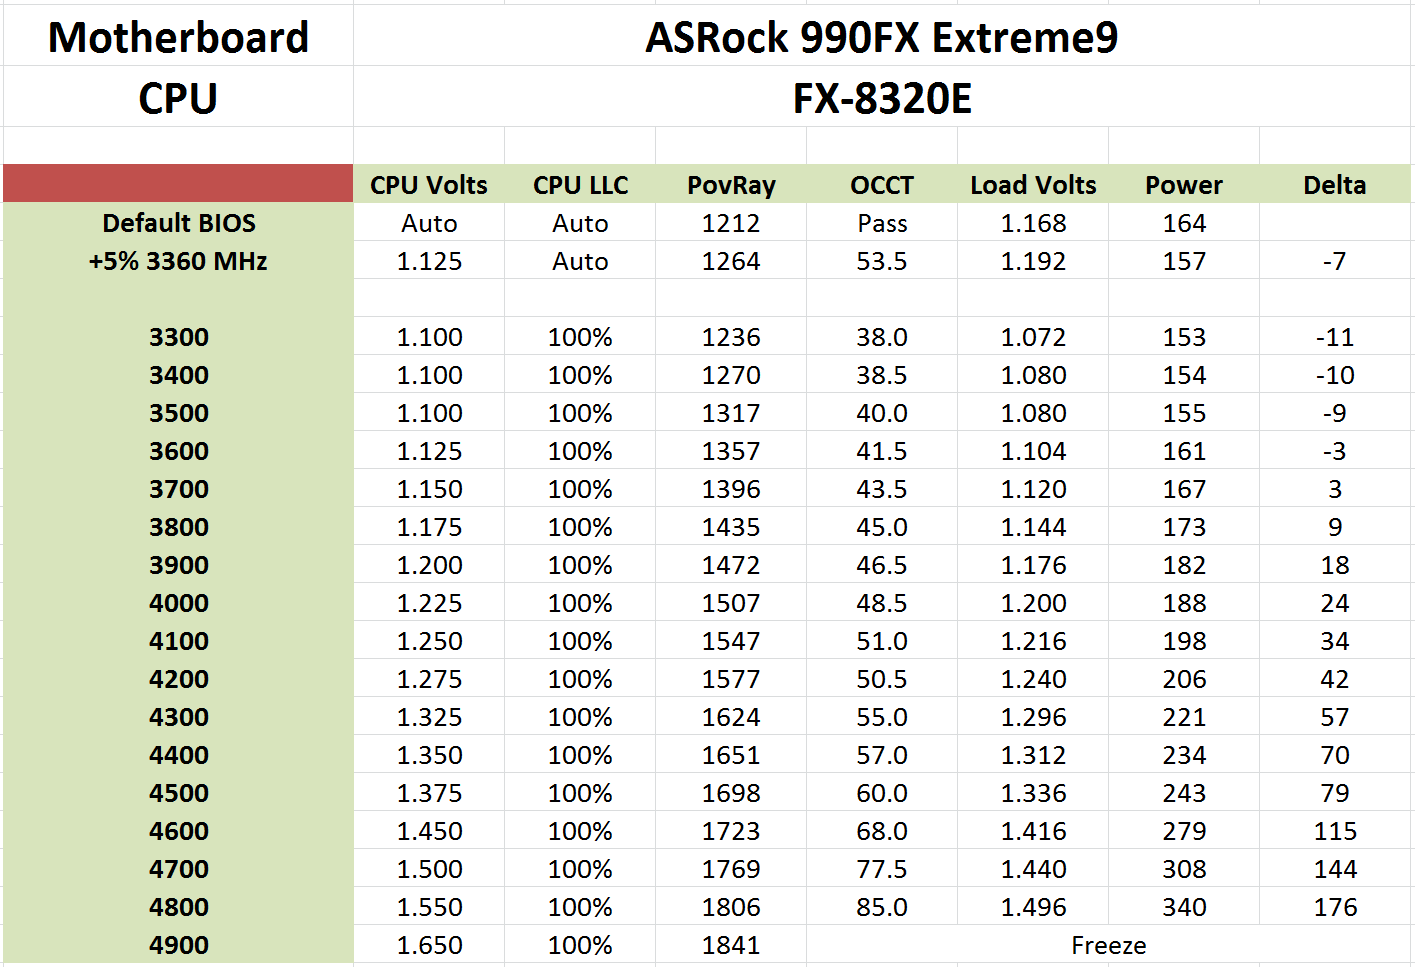
The voltage at 4.8 GHz ran at an alarming 1.550 volts, and the system was stable during our testing when we rested all the benchmarks at this new marker. For 50% extra MHz, our POV-Ray scores jumped from 1212 to 1806, a near 50% jump as well. The only thing that jumped more than 50% was the power consumption. We measured an 86W idle to peak delta when at stock, but the final power was an additional +176W, or +205%, for a total 262W all in, pushing it above the FX-9590's TDP.
Actually in our graphs over the next few pages, the FX-9590 proved to be the best competition when overclocked. That being said, if I were using the CPU 24/7, 1.550 volts at 4.8 GHz would not be the best place to leave it. At 4.5 GHz the CPU only needed 1.375 volts for only a +79W power consumption. Depending on the power delivery of the motherboard, perhaps another couple of notches as well. But all four modules at 4.8 GHz was pretty much unexpected. As always, your mileage may vary.
One argument for our good overclocking sample takes many prongs. A cynic might suggest that this was pre-binned to give a good result, however our past samples from AMD has nothing to suggest that this was particularly special. Karma might suggest that it was just ‘our time’ to get a good sample. A pragmatist would suggest that the FX-8320E is a particularly highly binned part to begin with, and the 30W saving from the regular FX-8320 for only 300 MHz loss might work in its favor depending on how far the voltage curve goes. Again, as stated at the top of this page, it is hard to pin it down without a representative overclocking sample.
Test Setup
| Test Setup | |
| Processor | AMD FX-8320E 4 Modules, 8 Threads, 3.2 GHz, 4.0 GHz Turbo |
| Motherboards | ASRock 990FX Extreme9 |
| Cooling | Cooler Master Nepton 140XL |
| Power Supply | OCZ 1250W Gold ZX Series Corsair AX1200i Platinum PSU |
| Memory | G.Skill RipjawsZ 4x4 GB DDR3-1866 9-11-9 Kit |
| Memory Settings | XMP |
| Video Cards | MSI GTX 770 Lightning 2GB (1150/1202 Boost) |
| Video Drivers | NVIDIA Drivers 337 |
| Hard Drive | OCZ Vertex 3 256GB |
| Optical Drive | LG GH22NS50 |
| Case | Open Test Bed |
| Operating System | Windows 7 64-bit SP1 |
We are using our ASRock 990FX Extreme9 for testing consistency and comparison, despite AMD sampling the MSI 970 Gaming with this review unit. The motherboard and BIOS can affect the performance quite dramatically, and this keeps our numbers comparable to each other.
Many thanks to...
We must thank the following companies for kindly providing hardware for our test bed:
Thank you to OCZ for providing us with PSUs and SSDs.
Thank you to G.Skill for providing us with memory.
Thank you to Corsair for providing us with an AX1200i PSU.
Thank you to MSI for providing us with the NVIDIA GTX 770 Lightning GPUs.
Thank you to Rosewill for providing us with PSUs and RK-9100 keyboards.
Thank you to ASRock for providing us with some IO testing kit.
Thank you to Cooler Master for providing us with Nepton 140XL CLCs.
Load Delta Power Consumption
Power consumption was tested on the system while in a single MSI GTX 770 Lightning GPU configuration with a wall meter connected to the OCZ 1250W power supply. This power supply is Gold rated, and as I am in the UK on a 230-240 V supply, leads to ~75% efficiency > 50W, and 90%+ efficiency at 250W, suitable for both idle and multi-GPU loading. This method of power reading allows us to compare the power management of the UEFI and the board to supply components with power under load, and includes typical PSU losses due to efficiency.
We take the power delta difference between idle and load as our tested value, giving an indication of the power increase from the CPU when placed under stress.
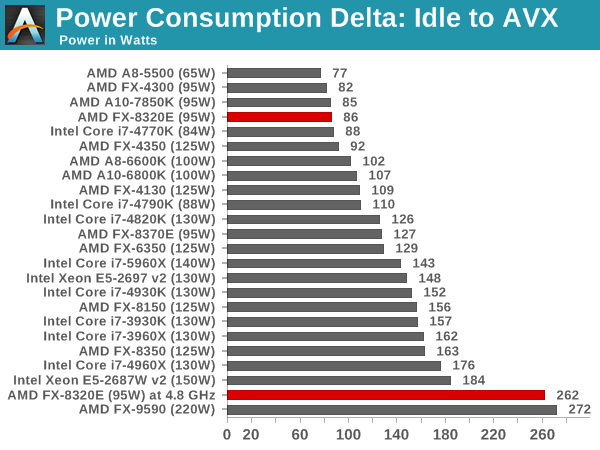
86W undercuts the 95W TDP by a good margin, however one might suggest that the power efficiency difference of the power supply would take that into account. The stock load voltage was 1.168 volts in our motherboard, which does not suggest anything untoward regarding the VID.
CPU Benchmarks
The dynamics of CPU Turbo modes, both Intel and AMD, can cause concern during environments with a variable threaded workload. There is also an added issue of the motherboard remaining consistent, depending on how the motherboard manufacturer wants to add in their own boosting technologies over the ones that Intel would prefer they used. In order to remain consistent, we implement an OS-level unique high performance mode on all the CPUs we test which should override any motherboard manufacturer performance mode.
HandBrake v0.9.9: link
For HandBrake, we take two videos (a 2h20 640x266 DVD rip and a 10min double UHD 3840x4320 animation short) and convert them to x264 format in an MP4 container. Results are given in terms of the frames per second processed, and HandBrake uses as many threads as possible.
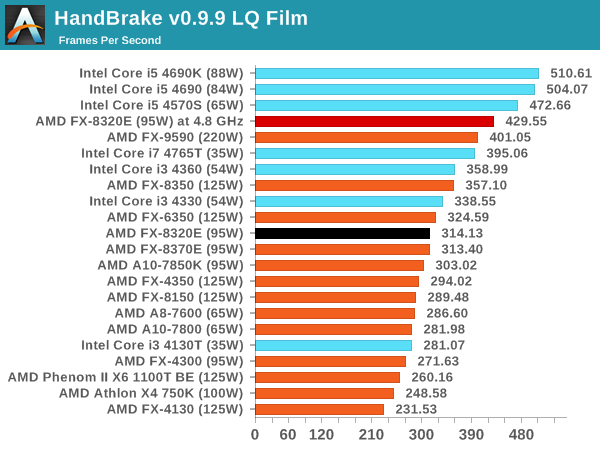
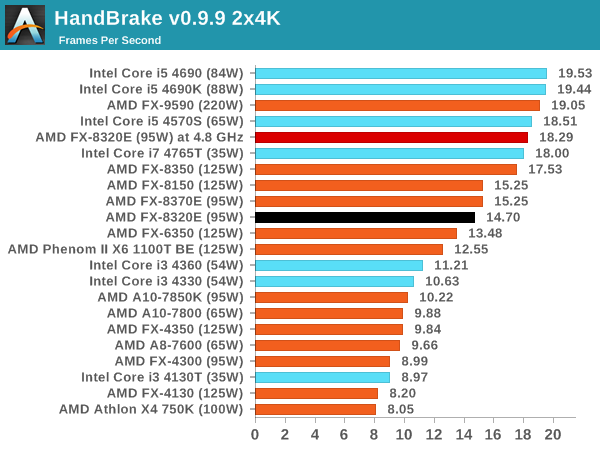
For Low Quality conversion, the 8320E has trouble keeping up with the full-fat i3, but beats them by a good margin when the frame sizes open up.
Dolphin Benchmark: link
Many emulators are often bound by single thread CPU performance, and general reports tended to suggest that Haswell provided a significant boost to emulator performance. This benchmark runs a Wii program that raytraces a complex 3D scene inside the Dolphin Wii emulator. Performance on this benchmark is a good proxy of the speed of Dolphin CPU emulation, which is an intensive single core task using most aspects of a CPU. Results are given in minutes, where the Wii itself scores 17.53 minutes.
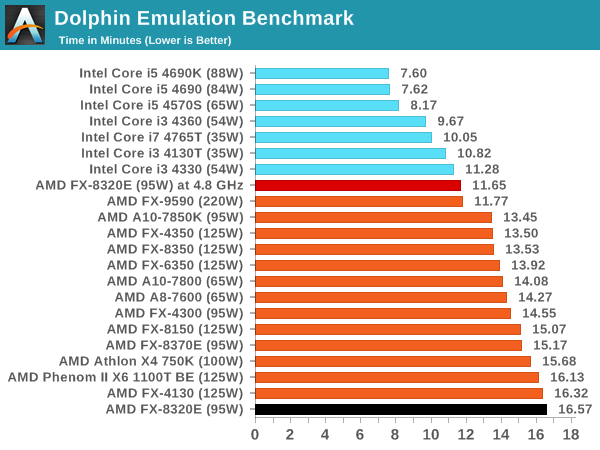
Dolphin historically prefers high IPC single core performance, which the 8320E is lacking.
WinRAR 5.0.1: link
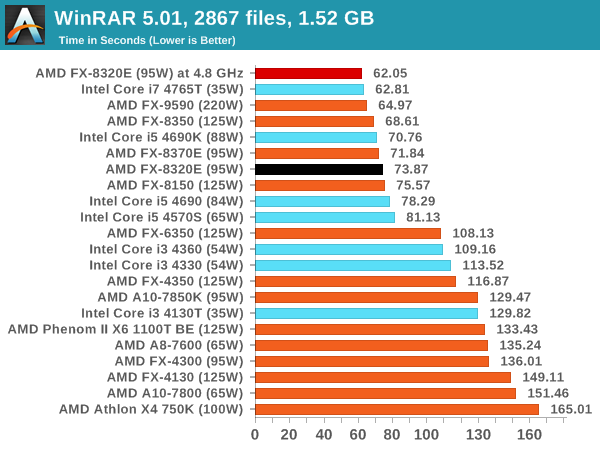
The eight threads of the FX-8000 series show through here, beating all the i3 and some of our i5 parts.
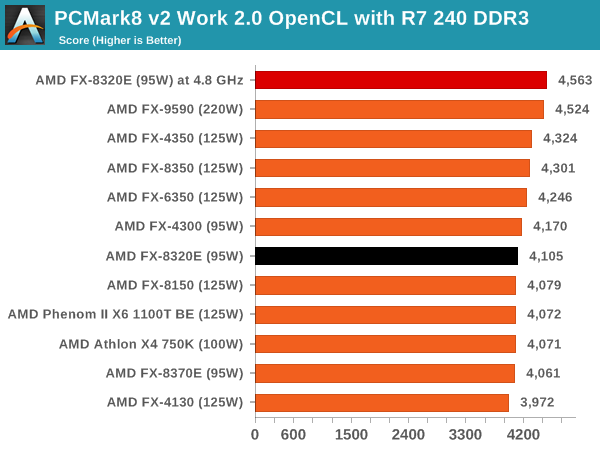
PCMark8 v2 OpenCL
A new addition to our CPU testing suite is PCMark8 v2, where we test the Work 2.0 suite in OpenCL mode.
Hybrid x265
Hybrid is a new benchmark, where we take a 4K 1500 frame video and convert it into an x265 format without audio. Results are given in frames per second.
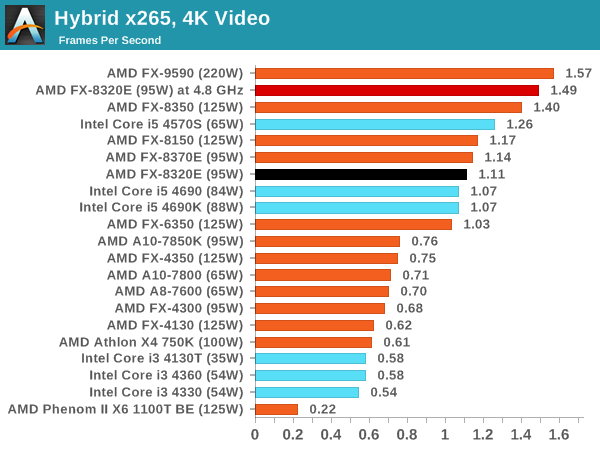
For x265 conversion those extra threads end up highly beneficial for the FX-8320E, nudging inbetween our i5 data.
3D Particle Movement
3DPM is a self-penned benchmark, taking basic 3D movement algorithms used in Brownian Motion simulations and testing them for speed. High floating point performance, MHz and IPC wins in the single thread version, whereas the multithread version has to handle the threads and loves more cores. For a brief explanation of the platform agnostic coding behind this benchmark, see my forum post here.
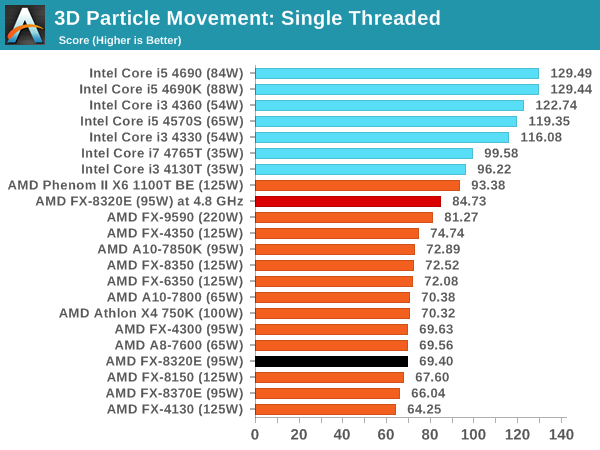
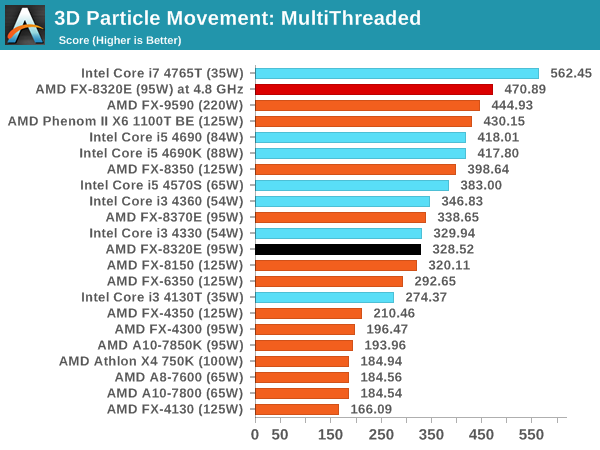
While single thread performance is behind, the overclocked FX-8320E storms ahead of our FX-9590 results.
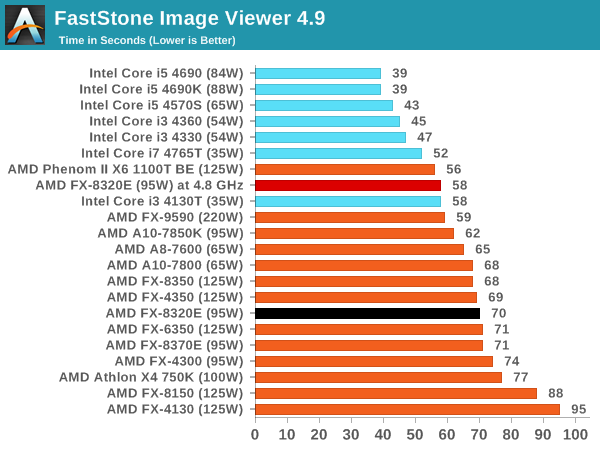
FastStone Image Viewer 4.9
FastStone is the program I use to perform quick or bulk actions on images, such as resizing, adjusting for color and cropping. In our test we take a series of 170 images in various sizes and formats and convert them all into 640x480 .gif files, maintaining the aspect ratio. FastStone does not use multithreading for this test, and results are given in seconds.
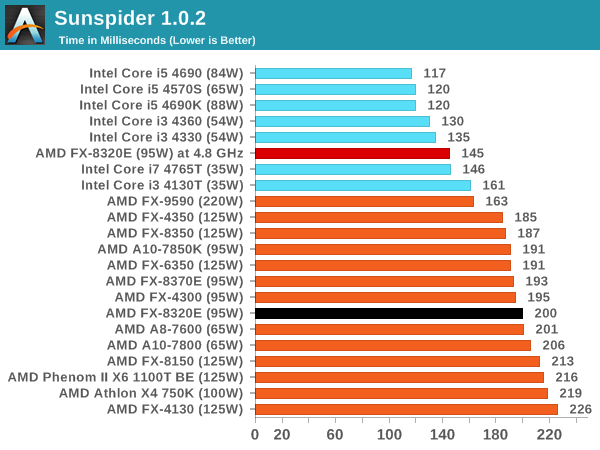
Web Benchmarks
On the lower end processors, general usability is a big factor of experience, especially as we move into the HTML5 era of web browsing. For our web benchmarks, we take four well known tests with Chrome 35 as a consistent browser.
Sunspider 1.0.2
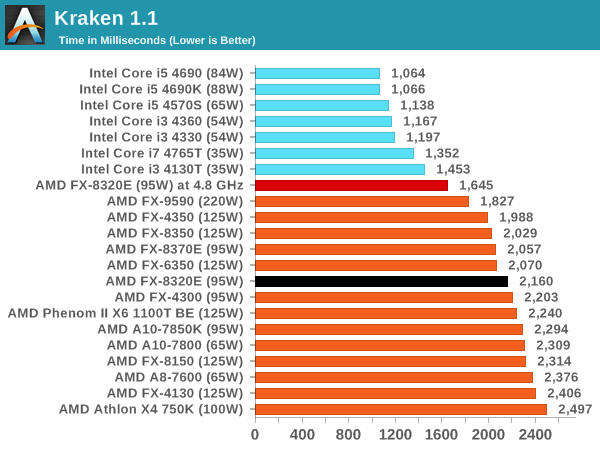
Mozilla Kraken 1.1
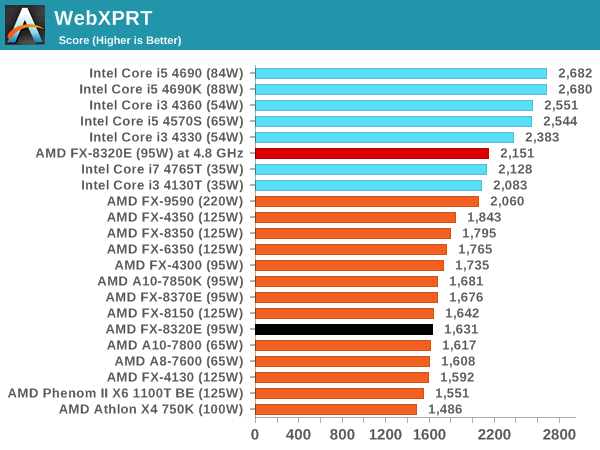
WebXPRT
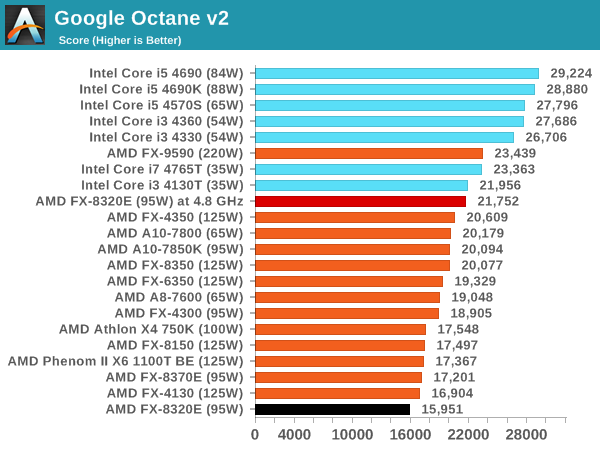
Google Octane v2
Professional Performance: Windows
Agisoft Photoscan – 2D to 3D Image Manipulation: link
Agisoft Photoscan creates 3D models from 2D images, a process which is very computationally expensive. The algorithm is split into four distinct phases, and different phases of the model reconstruction require either fast memory, fast IPC, more cores, or even OpenCL compute devices to hand. Agisoft supplied us with a special version of the software to script the process, where we take 50 images of a stately home and convert it into a medium quality model. This benchmark typically takes around 15-20 minutes on a high end PC on the CPU alone, with GPUs reducing the time.
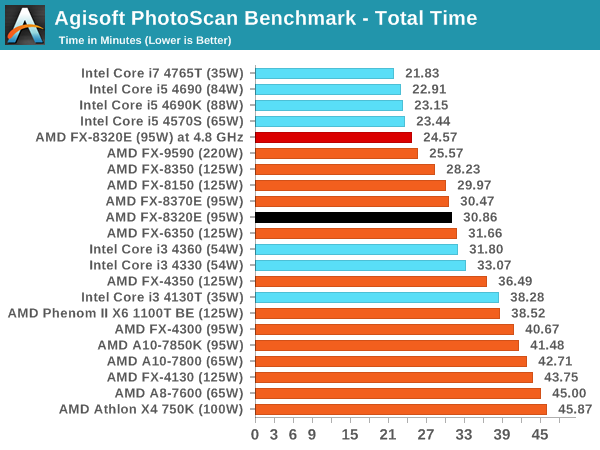
A highly parallel benchmark like Photoscan puts the FX CPUs ahead of our i3 results. When overclocked, it plays just behind the i5 results.
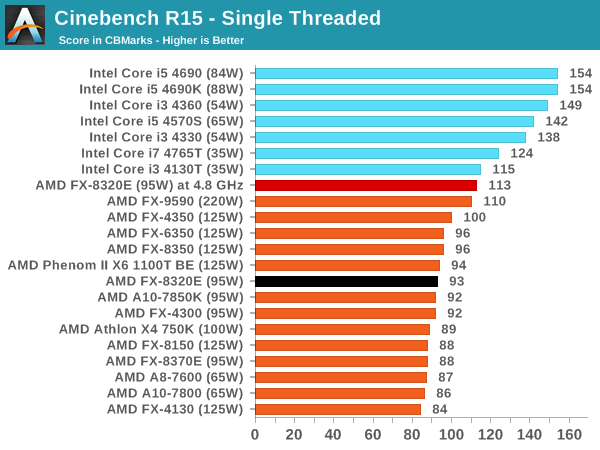
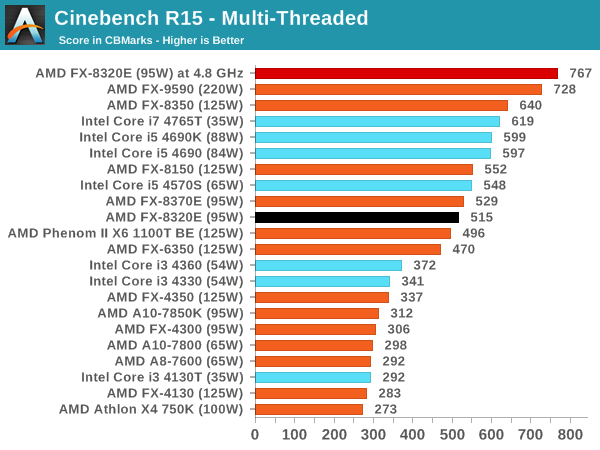
Cinebench R15
Professional Performance: Linux
Built around several freely available benchmarks for Linux, Linux-Bench is a project spearheaded by Patrick at ServeTheHome to streamline about a dozen of these tests in a single neat package run via a set of three commands using an Ubuntu 14.04 LiveCD. These tests include fluid dynamics used by NASA, ray-tracing, molecular modeling, and a scalable data structure server for web deployments. We run Linux-Bench and have chosen to report a select few of the tests that rely on CPU and DRAM speed.
C-Ray: link
C-Ray is a simple ray-tracing program that focuses almost exclusively on processor performance rather than DRAM access. The test in Linux-Bench renders a heavy complex scene offering a large scalable scenario.
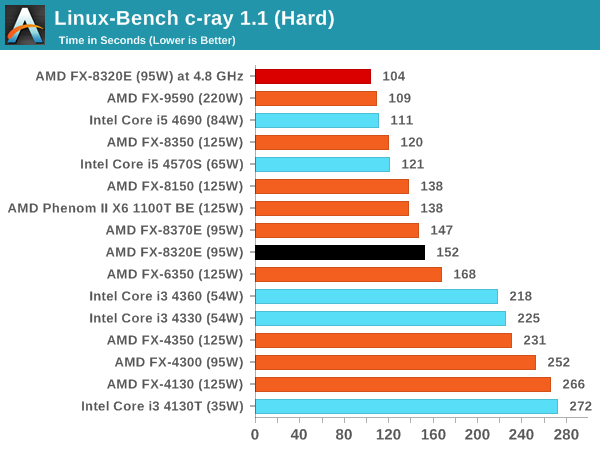
Ahead of the i3, behind the i5 until overclocked seems to be a good motto for this CPU.
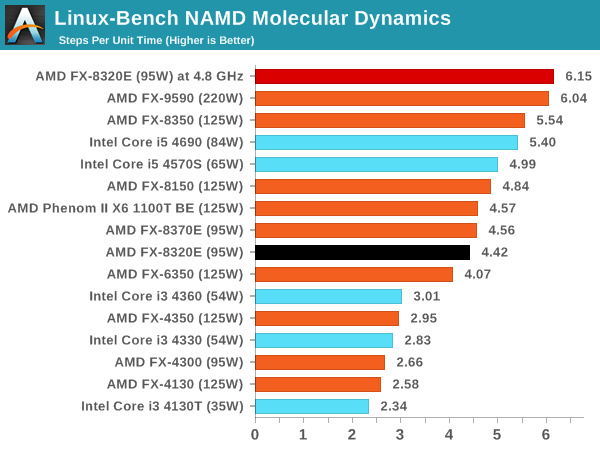
NAMD, Scalable Molecular Dynamics: link
Developed by the Theoretical and Computational Biophysics Group at the University of Illinois at Urbana-Champaign, NAMD is a set of parallel molecular dynamics codes for extreme parallelization up to and beyond 200,000 cores. The reference paper detailing NAMD has over 4000 citations, and our testing runs a small simulation where the calculation steps per unit time is the output vector.
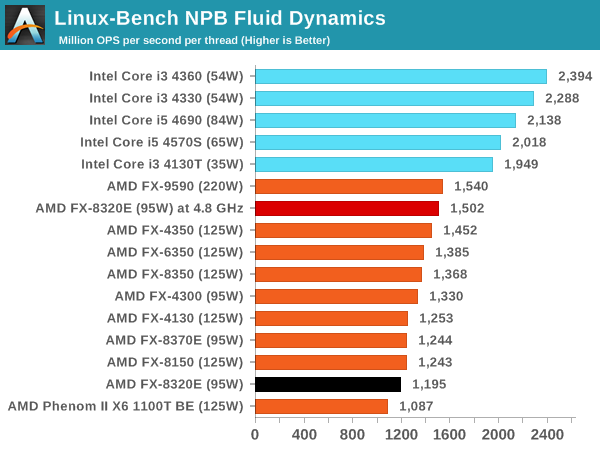
NPB, Fluid Dynamics: link
Aside from LINPACK, there are many other ways to benchmark supercomputers in terms of how effective they are for various types of mathematical processes. The NAS Parallel Benchmarks (NPB) are a set of small programs originally designed for NASA to test their supercomputers in terms of fluid dynamics simulations, useful for airflow reactions and design.
Redis: link
Many of the online applications rely on key-value caches and data structure servers to operate. Redis is an open-source, scalable web technology with a b developer base, but also relies heavily on memory bandwidth as well as CPU performance.
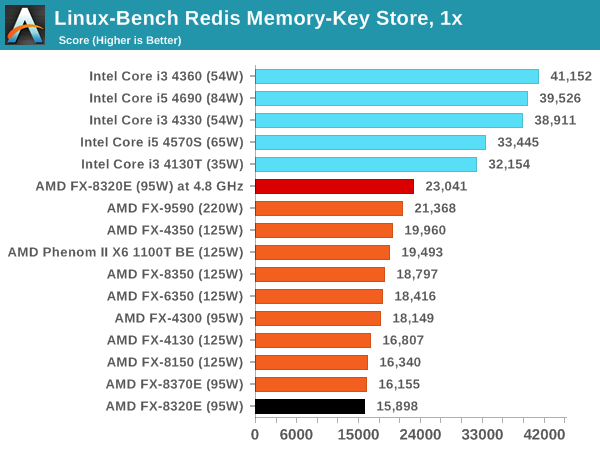
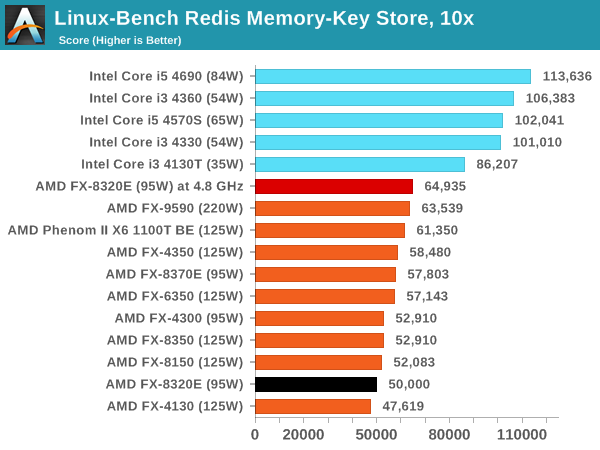
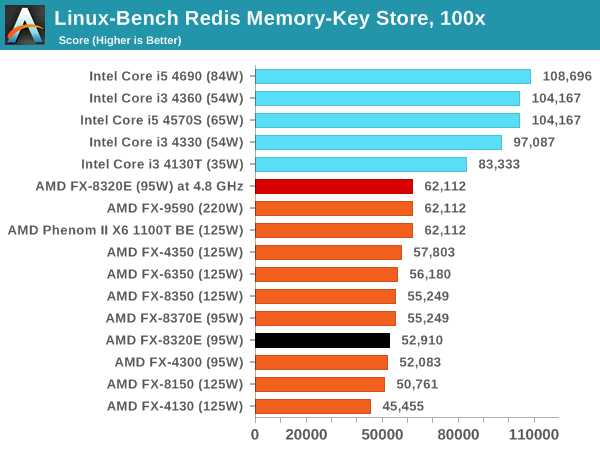
It would seem that one downside to the AMD FX line is the memory access limited scenarios, unless more cores can come into the equation. For redis, that is unfortunately not the case.
F1 2013
First up is F1 2013 by Codemasters. I am a big Formula 1 fan in my spare time, and nothing makes me happier than carving up the field in a Caterham, waving to the Red Bulls as I drive by (because I play on easy and take shortcuts). F1 2013 uses the EGO Engine, and like other Codemasters games ends up being very playable on old hardware quite easily. In order to beef up the benchmark a bit, we devised the following scenario for the benchmark mode: one lap of Spa-Francorchamps in the heavy wet, the benchmark follows Jenson Button in the McLaren who starts on the grid in 22nd place, with the field made up of 11 Williams cars, 5 Marussia and 5 Caterham in that order. This puts emphasis on the CPU to handle the AI in the wet, and allows for a good amount of overtaking during the automated benchmark. We test at 1920x1080 on Ultra graphical settings.

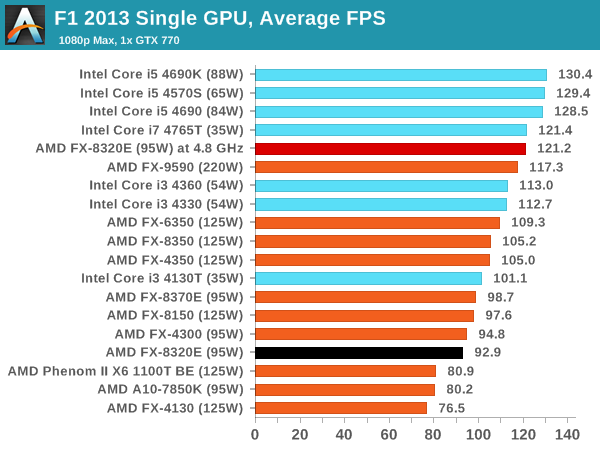
In both single and dual GPU cases, the stock performance of the FX-8320E falls behind the i3 CPUs by a 10-20 FPS margin, perhaps being noticeable on 120 Hz monitors. The minimum FPS on a single GPU still retains above 60 FPS, which is a plus.
Bioshock Infinite
Bioshock Infinite was Zero Punctuation’s Game of the Year for 2013, uses the Unreal Engine 3, and is designed to scale with both cores and graphical prowess. We test the benchmark using the Adrenaline benchmark tool and the Xtreme (1920x1080, Maximum) performance setting, noting down the average frame rates and the minimum frame rates.

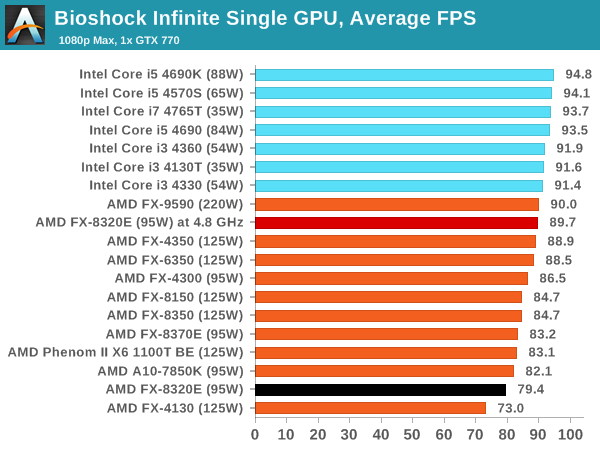
While average frame rates almost appear to be CPU agnostic, there is a clear AMD/Intel split here. More interesting is the minimum FPS results which seem to rely on IPC.
Tomb Raider
The next benchmark in our test is Tomb Raider. Tomb Raider is an AMD optimized game, lauded for its use of TressFX creating dynamic hair to increase the immersion in game. Tomb Raider uses a modified version of the Crystal Engine, and enjoys raw horsepower. We test the benchmark using the Adrenaline benchmark tool and the Xtreme (1920x1080, Maximum) performance setting, noting down the average frame rates and the minimum frame rates.

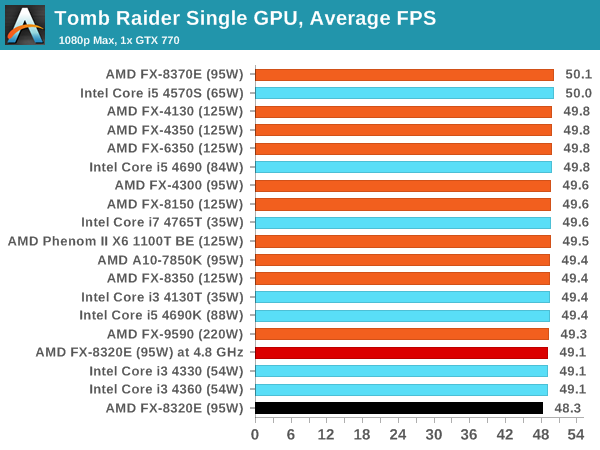
Tomb Raider still comes across as purely CPU agnostic.
Sleeping Dogs
Sleeping Dogs is a benchmarking wet dream – a highly complex benchmark that can bring the toughest setup and high resolutions down into single figures. Having an extreme SSAO setting can do that, but at the right settings Sleeping Dogs is highly playable and enjoyable. We run the basic benchmark program laid out in the Adrenaline benchmark tool, and the Xtreme (1920x1080, Maximum) performance setting, noting down the average frame rates and the minimum frame rates.

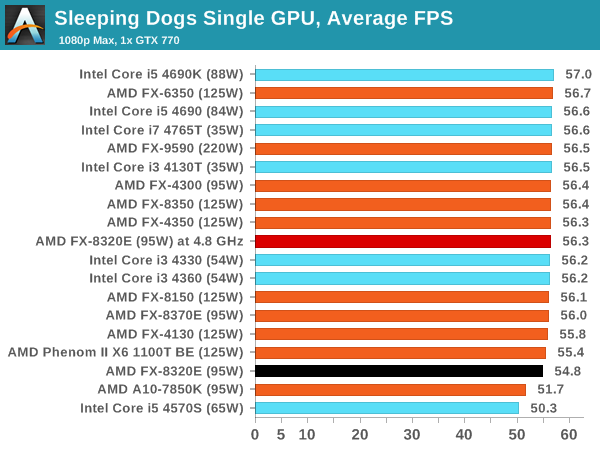
Single GPU usage puts the 8320E in the ballpark, but moving to dual GPUs sees an uplift in terms of the i5 CPUs for high refresh rate screens, albeit with the extra cost associated.
Battlefield 4
The EA/DICE series that has taken countless hours of my life away is back for another iteration, using the Frostbite 3 engine. AMD is also piling its resources into BF4 with the new Mantle API for developers, designed to cut the time required for the CPU to dispatch commands to the graphical sub-system. For our test we use the in-game benchmarking tools and record the frame time for the first ~70 seconds of the Tashgar single player mission, which is an on-rails generation of and rendering of objects and textures. We test at 1920x1080 at Ultra settings.
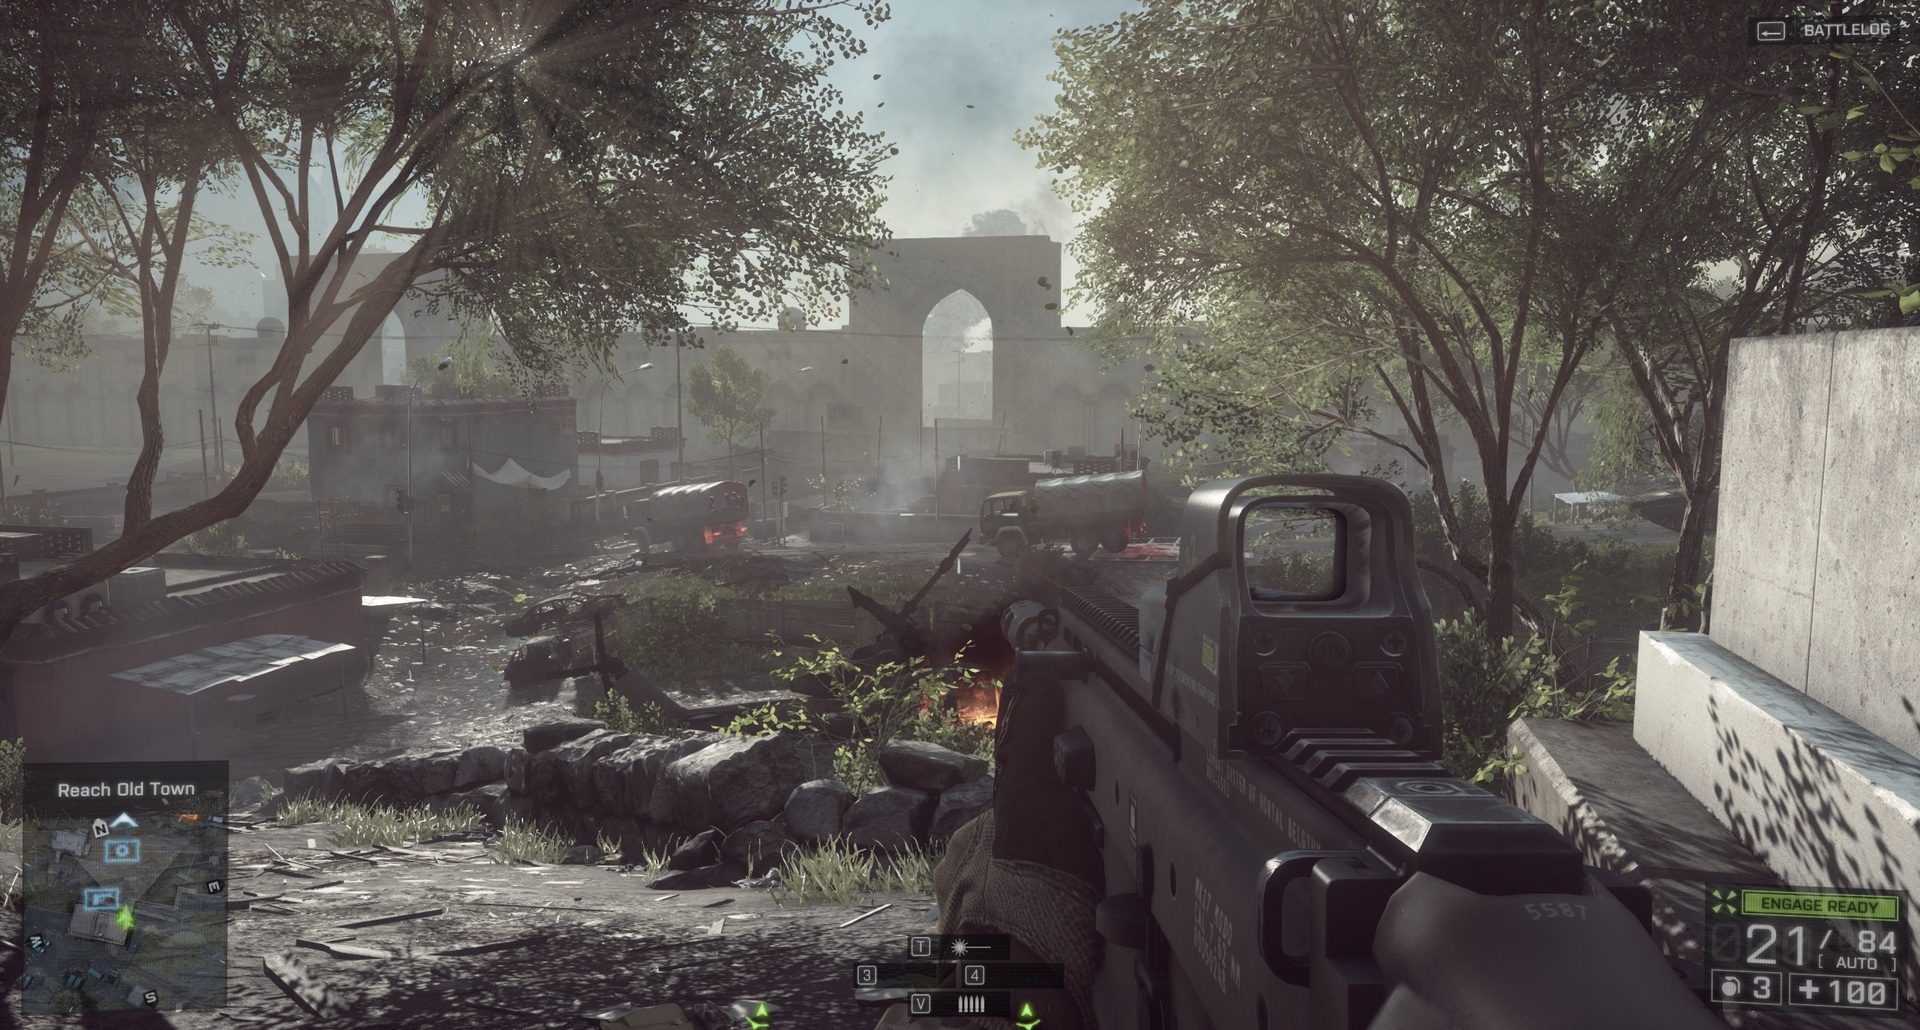
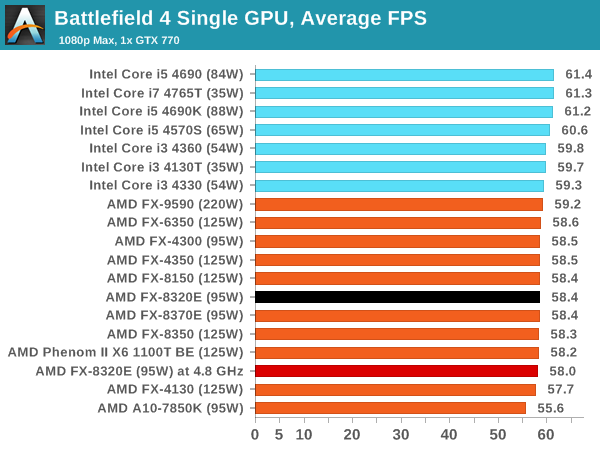
Single GPU shows little difference (despite a clear AMD/Intel separation line), but in dual GPU mode an i3 will make a 17 FPS rise, moving to 27 FPS with the i5 and more relevant to high refresh displays.
AMD FX-8320E Conclusion
Anyone building a new performance system today is not exactly spoiled for choice. On the super extreme end, native octo-core processors with threading are in the market. AMD’s high end FX models start by comparison to the Core i5 line but boasts double the threads, albeit at almost double the power consumption. Without looking at the reasons for AMD’s E-series launch, it can be easy to scoff and write these processors off.
AMD’s aim with the FX-8370, FX-8370E and FX-8320E was in part to generate new customers at a lower price portfolio and for those wanting to upgrade their AMD CPU from something lower down the stack. Users who purchased an FX-4100 or FX-6300 can happy get more performance by swapping in a CPU, rather than replacing the motherboard and potentially the DRAM to fit. The 95W power point for the E series allows 8-threads for almost all AM3+ motherboards ever made.
That being said, performance of the CPU is still reminiscent of 2012 when the first FX-8000 CPUs were launched and the 32nm process node on which it is formed. Back in our review of the FX-8370E, our conclusion was that it performed much like the FX-8150 except in power consumption, and it was perhaps a foregone conclusion that the FX-8320E was not going to be any better given the statistics on paper.
A plus point worth noting is that the turbo mode seemed a lot more aggressive than our FX-8150 and FX-8370E numbers. This allowed for higher frequencies in some of our variable threaded benchmarks, and gave some better results which is rather odd. However, it was only for a few select benchmarks in the end, with the pure single threaded ones and the fully multithreaded results still grasping at the FX-8150 numbers. The plus side in all this is that our FX-8150 power consumption measured significantly higher than the TDP (156W vs 125W TDP) and the FX-8320E gave a lower result (86W vs 95W TDP), essentially handing any performance/watt trophy to the FX-8320E.
The big number from our review however was the overclocking potential of our sample. Our FX-8320E overclocked like a beast (yes AMD, you can quote me on that), although your mileage may vary (as long as you quote this bit too). Our single data point gave 4.8 GHz at 1.550 volts for a 50% raise in both frequency and POV-Ray results, although the power consumption was over 3x the stock value (262W vs 86W). Most AMD users would also state that 1.550 volts was a bit high, so at 1.375 volts the CPU still gave 4.5 GHz which is still a good end.
The end result of the FX-8320E will be similar to that of the FX-8370E. Users will have to look at their use case and decide if an iterative CPU upgrade, from one of the earlier FX models or the Phenom II range, makes sense in their future computing. Putting down $150 on a CPU is reasonable enough if you have everything around it, although one might argue that if we add in the MSI 970 Gaming ($100), some memory ($50), some storage ($100) and a mid-range GPU ($150), then gaming at around $650 when you factor in the case and PSU is more than possible, especially when a similarly performing Intel system might cost more. AMD's key metric in this instance is pricing.
The end here will be the same as the FX-8370E review:
At the end of the day, most users feel that AMD needs to upgrade the architecture (and the chipset) to potentially increase performance or reduce power. At some point the architectures of the FX and APU line either need to diverge their separate ways, or there needs to be a hard earned reconciliation attempt to find a node and a manufacturing process suitable for both low power graphics cores and high frequency processor cores. We know about AMD's plans for 2016, dealing with ARM and x86, and the announcements on K12 so far point to AMD targeting servers, embedded markets and ultra-low power client devices. Here's hoping desktop side gets a good boost as well.


